10 Business Monitoring Software Options Compared
|
11
min read

The most popular advice about business monitoring software is to compare feature counts. That approach misses the decision that matters most: which monitoring layer needs control. A platform that watches revenue at the data source serves a different purpose from a BI tool that alerts users about a governed dashboard, an observability platform that connects checkout failures to application services, or a product analytics system that explains changes in conversion and retention.
This comparison evaluates each option by its monitoring boundary, deployment model, data movement, governance, anomaly detection, timeliness, validation, integrations, pricing approach, implementation burden, and fit for finance, healthcare, and telecommunications. Those criteria matter because a useful alert is only the beginning. Teams also need to know whether production data leaves their environment, who owns the metric definition, how an incident reaches the right operator, and whether costs grow with tables, telemetry, users, capacity, or data volume.
The category is expanding beyond dashboards and threshold rules. The broader observability market was estimated at USD 2.143 billion in 2023 and is projected to reach USD 4.7332 billion by 2030, with a 12.2% CAGR from 2024 to 2030, according to Grand View Research's data observability market analysis. For regulated enterprises, that growth makes evaluation discipline more important, not less. A broad platform may offer impressive coverage while creating unnecessary data movement, governance work, or pricing complexity.
Table of Contents
1. Solutions Business Monitoring
Solutions Business Monitoring is a module of the digna platform for monitoring business and operational KPIs directly on underlying datasets. Rather than waiting for a downstream dashboard to expose a problem, it analyzes data behavior where the metric is calculated, identifying unusual changes, volatility, trends, schema changes, validation failures, and delivery delays.
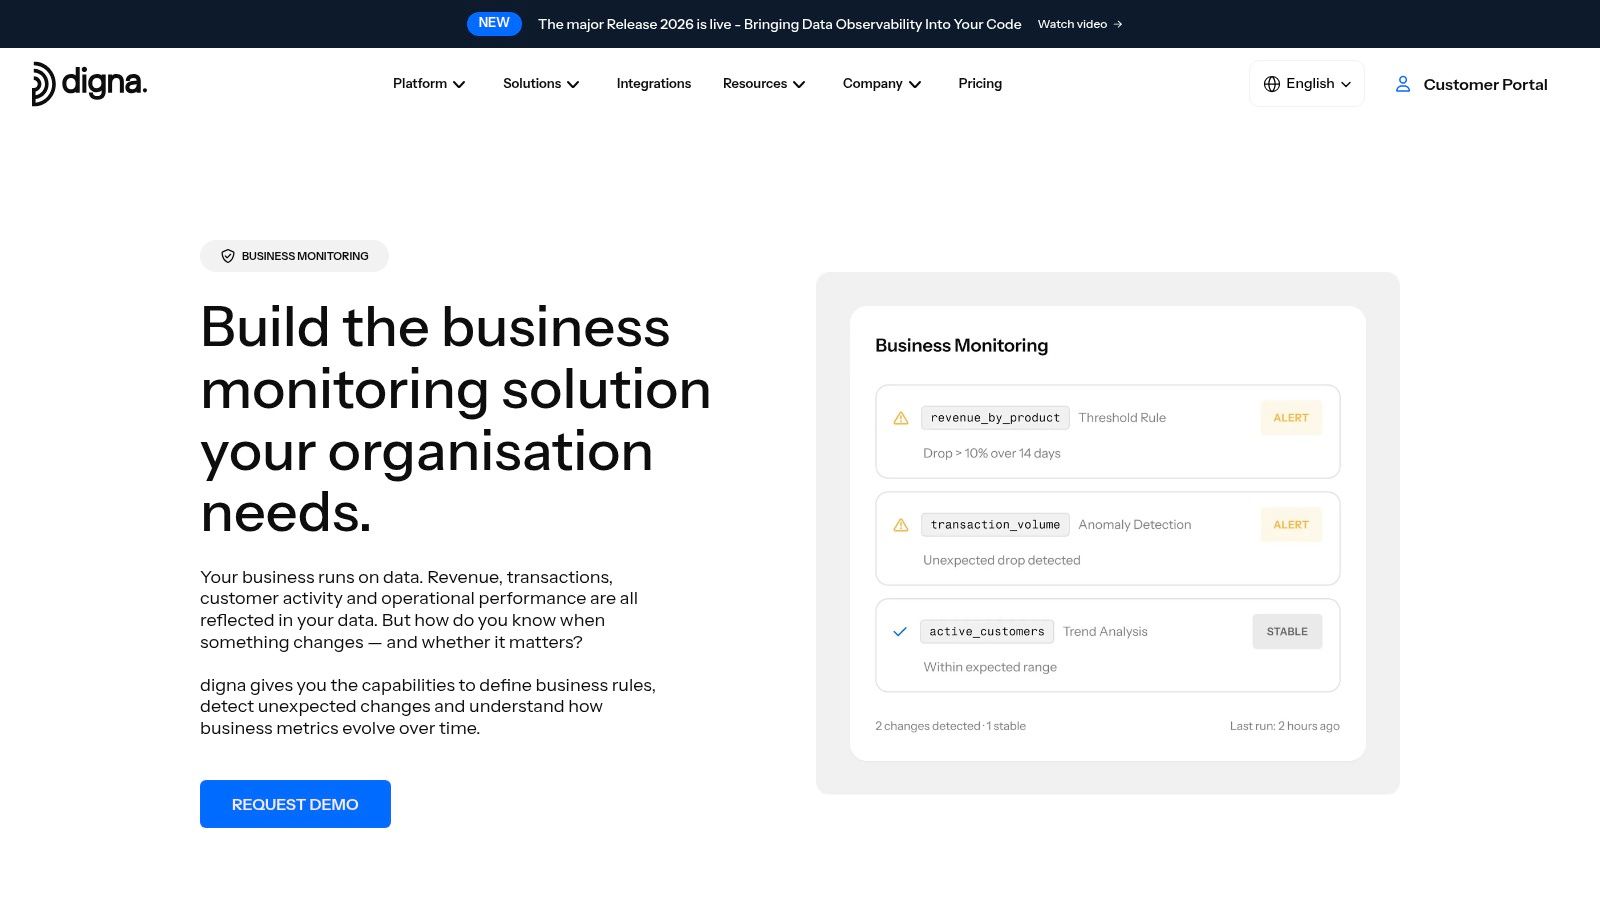
The important distinction is the monitoring boundary. digna executes metric computation and analysis inside the customer's database or data environment, with deployment available in a private cloud, VPC, or on-premises infrastructure. Production data remains under the customer's control, which is a meaningful advantage for financial records, clinical information, telecommunications data, and public-sector workloads. In-database execution also reduces the need to copy large datasets into a separate monitoring service.
The platform learns baseline behavior for datasets and uses AI-driven anomaly detection to reduce manual rule writing. It also combines several forms of observability that are often purchased separately:
Business KPI monitoring: Detects unexpected movement in revenue, sales, transactions, customer activity, and operational indicators.
Timeliness monitoring: Learns delivery patterns and calculates expected arrival times to identify late, missing, or early loads.
Data validation: Checks records against business rules and targeted quality controls.
Schema tracking: Detects structural changes such as added or removed columns and data-type modifications.
That combination makes digna stronger where a business alert must lead to a data investigation. The shared interface gives analysts, data engineers, and business stakeholders one place to review incidents, trends, and status. Teams evaluating monitoring and reporting workflows should test whether that shared view reduces handoffs between KPI owners and platform operators.
Deployment and commercial fit
digna's modular licensing lets a customer start with one monitoring module and expand. Pricing is based on a base fee plus active tables per module, rather than API calls, scan counts, or alert volume. That structure is easier to model for stable workloads, although very large table estates can increase costs when monitoring expands broadly across modules.
The implementation tradeoff is clear. The customer must provision and manage compute and storage inside its own environment, but that effort supports stronger security and governance controls. digna states that installation can produce initial insights in under two hours, a claim that should still be tested against the customer's warehouse, access model, and representative datasets.
Practical rule: Choose this option when the question is not only “Did the KPI change?” but also “Was the data delivered, structurally intact, valid, and safe to investigate inside our environment?”
For finance, healthcare, and telecommunications, digna is best suited to organizations that need combined business, data, and platform monitoring without sending production data to a vendor. Its limitation is that it isn't an application performance monitoring replacement. It explains abnormal data and KPI behavior, but teams needing request traces and service maps may need an application observability platform alongside it.
2. Anodot
Anodot is designed around business KPI monitoring and anomaly detection. Its strongest use case is a large, changing metric estate where teams need to detect meaningful deviations across revenue, conversion, cost, engagement, partner, or channel data without creating a separate static rule for every metric.
The platform's unsupervised approach learns normal patterns across high-cardinality business metrics. That makes it relevant to organizations where the same KPI needs to be segmented by product, region, customer group, channel, or partner. Contextual alerts and root-cause indicators help an operator distinguish a broad revenue movement from a localized distribution or partner issue.
Anodot also emphasizes business-impact alerting, including estimates of monetary impact, and provides use-case accelerators for scenarios such as real-time revenue monitoring. Its broad ingestion model can help teams centralize a wide range of signals and establish baselines quickly.
The main comparison with digna is scope and execution location. Anodot is a strong candidate when the primary objective is centralized, AI-driven monitoring of business metrics. digna is more differentiated when the same team needs anomaly detection combined with timeliness, record validation, and schema monitoring inside its own databases. Teams comparing anomaly approaches can also review time-series anomaly detection as a separate design question from dashboard alerting.
Anodot makes the most sense when the organization already has a broad, accessible stream of KPI signals and wants an AI layer to reduce alert noise.
Pricing is enterprise-oriented, with limited public list pricing, so procurement should model metric volume, ingestion patterns, retention, users, and required support rather than comparing license headlines. Implementation is relatively light when the organization can stream or centralize its signals, but less attractive when sensitive data cannot leave the customer environment or when source-level validation is the main requirement.
For finance, Anodot can help surface revenue leakage and cost changes. In healthcare, governance teams should verify data handling, access controls, and permitted signal movement before onboarding clinical or operational metrics. Telecommunications organizations with large, segmented KPI inventories may benefit from its high-cardinality approach, provided the platform can receive the required data with acceptable control.
3. ThoughtSpot
ThoughtSpot approaches business monitoring from the governed BI and self-service analytics layer. Its KPI Monitor lets business users subscribe to important metrics, receive anomaly or threshold alerts, and follow changes through channels such as Slack, Microsoft Teams, email, and mobile notifications.
That makes ThoughtSpot a good fit for stakeholders who don't want to open a dashboard repeatedly to check performance. SpotIQ and Spotter can surface metric changes and potential drivers, while governed data sources give teams a consistent analytical context. The platform is particularly useful when the business already treats its BI environment as the official place for KPI definitions.
The limitation is foundational. ThoughtSpot alerts depend on a well-modeled, governed data layer inside the platform. If the underlying table is late, malformed, or affected by schema drift, a clean-looking KPI monitor may still be reporting an incomplete result. ThoughtSpot can tell a user that a governed metric moved, but it isn't primarily a data timeliness or record-validation system.
That distinction matters in regulated environments. A finance team may want alerts on a governed risk or revenue metric, while data governance teams may separately need evidence that the source arrived on time and passed business rules. Healthcare teams should define who owns the semantic model and who can distribute alerts containing sensitive context. Telecom teams may value the collaboration workflow, but should test whether high-dimensional operational metrics remain usable in the BI model.
Where the BI boundary works
ThoughtSpot's strength is business adoption. A stakeholder can follow a KPI in the same environment used for search and analysis, then coordinate in a collaboration channel when a change appears. Review self-service analytics as a contrasting requirement if analysts need to explore anomalies at the underlying data layer rather than only consume governed metrics.
Pricing is enterprise-centric, and the platform isn't typically a low-cost choice for small teams. Implementation effort centers on semantic modeling, permissions, metric ownership, and alert design. For finance and healthcare, that governance work is a benefit if completed rigorously. For teams seeking source-level observability, it can become a dependency that delays value.
4. Splunk Observability Cloud
Splunk Observability Cloud serves the boundary between business process health and application telemetry. Its Business Journeys and APM Business Workflows help teams map multi-step processes such as checkout, onboarding, or other customer flows to the services that execute them.
The platform is most valuable when an organization needs to answer a causal question: a business process is degrading, which service, dependency, or transaction is responsible? Splunk combines logs, metrics, and traces, while APM supports high-cardinality analysis and unsampled traces for deeper diagnosis. Custom dashboards and alerts can connect business milestones to service health.
This is a different proposition from source-level KPI monitoring. Splunk can show that a checkout journey is failing and help engineers trace the failure through application components. It doesn't replace a data observability platform that validates warehouse records, monitors expected dataset delivery, or detects a changed column contract before downstream reporting breaks.
Technical depth versus operational burden
Splunk is a strong fit for enterprises where engineering and data teams already collaborate around application reliability. Unsampled tracing can provide valuable evidence when a KPI degradation has a technical cause, but the breadth of logs, metrics, traces, dashboards, and workflows also increases implementation and governance demands.
Organizations considering alternatives to Splunk should separate two buying decisions. If the primary problem is application and service diagnosis, Splunk's technical depth is relevant. If the primary problem is abnormal business data inside a regulated warehouse, its full observability stack may be more than the team needs.
Pricing and deployment complexity can be high for purely KPI monitoring. Finance teams may benefit when revenue processes depend on many services and transaction paths. Healthcare organizations should examine trace content, retention, identity controls, and whether sensitive application context is exposed in operational workflows. Telecommunications teams with distributed customer journeys may find the business-process mapping valuable, especially when application health and customer experience must be investigated together.
5. Datadog
Datadog is a broad observability platform for engineering and SRE teams that need to correlate custom business metrics with applications, infrastructure, logs, and traces. Its monitors can track custom KPIs, while Watchdog provides anomaly insights and contextual root-cause assistance.
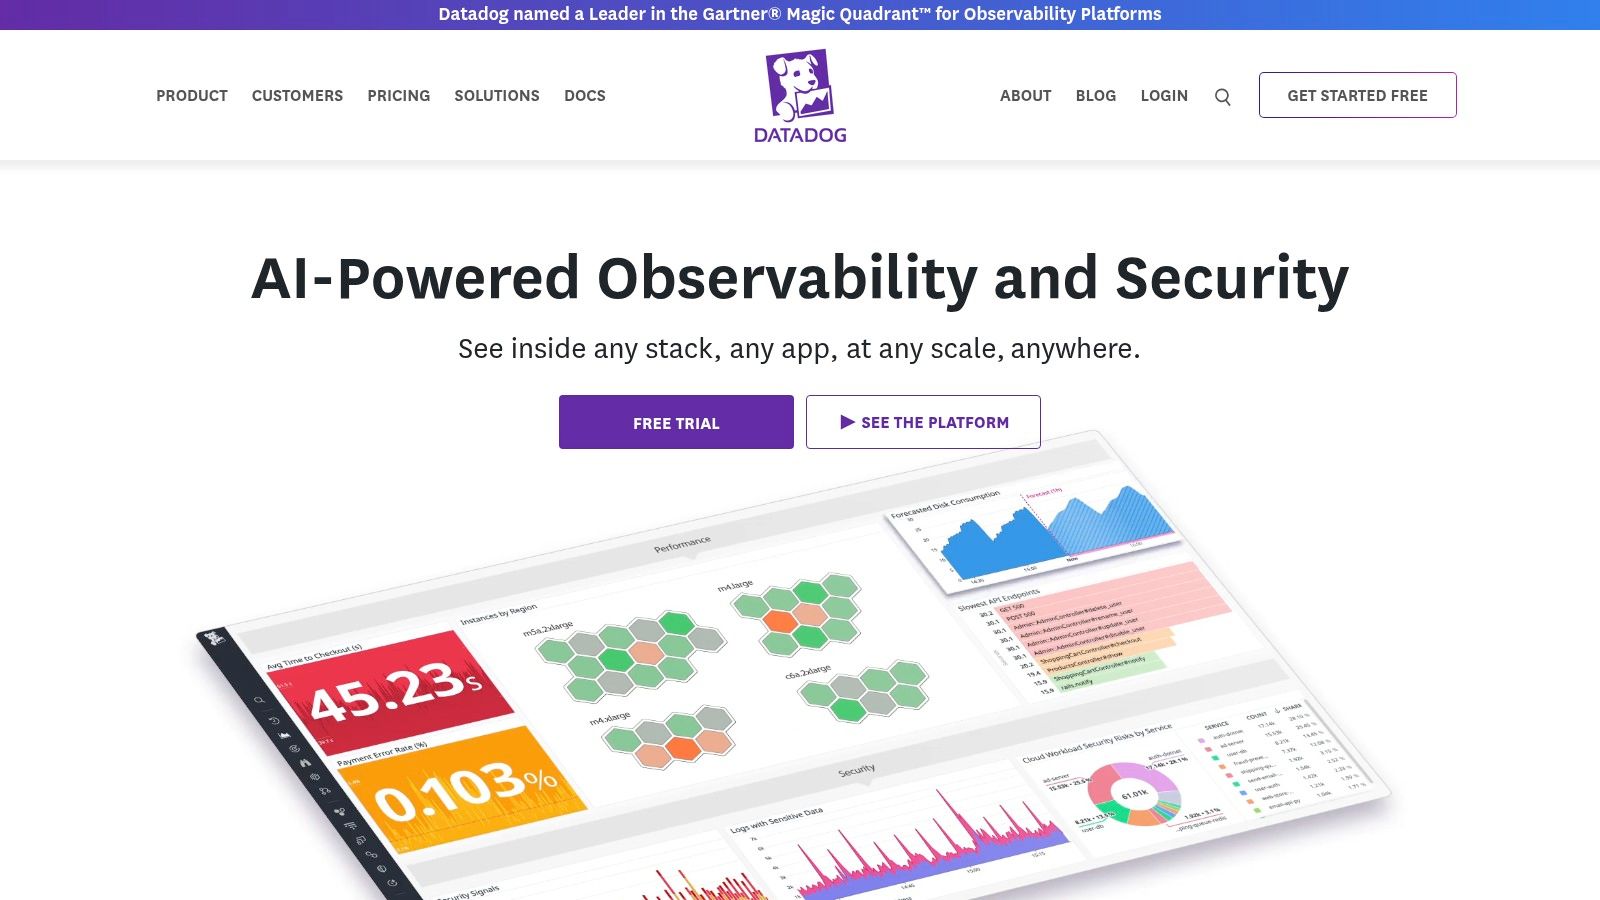
The platform's value comes from correlation. A team can place a business metric beside service performance, investigate a time-series anomaly, and route an alert through PagerDuty, Slack, email, or another operational channel. Forecasting and dashboard investigations add planning context to real-time monitoring.
Datadog is therefore strongest when business KPIs depend directly on application or infrastructure behavior. A failed payment rate, for example, may require a team to examine application errors, database latency, and infrastructure changes in one workflow. By contrast, teams monitoring business data quality may need a separate capability for record-level validation, schema contracts, and expected data delivery.
Datadog can reduce context switching, but it can't create metric meaning automatically. Tags, ownership, dimensions, and alert thresholds still need governance.
Pricing is one of the central evaluation issues. Costs can become complex with heavy custom metrics, telemetry ingestion, retention, hosts, and integrations. The commercial model rewards careful scoping, but poor tagging and unrestricted metric creation can generate both financial waste and alert noise.
Finance teams should test whether sensitive transaction context can be represented safely in telemetry. Healthcare teams need strict controls over attributes and logs. Telecommunications teams may benefit from the integration ecosystem and scale of operational monitoring, particularly when customer KPIs and network services are already managed by engineering teams. Review real-time data monitoring if the requirement is instead to monitor data arrival and behavior inside the data platform.
6. New Relic
New Relic combines full-stack observability with a business observability approach. Teams can send custom business events and attributes, query them with NRQL, build KPI dashboards, and configure alerts around thresholds or learned baselines.
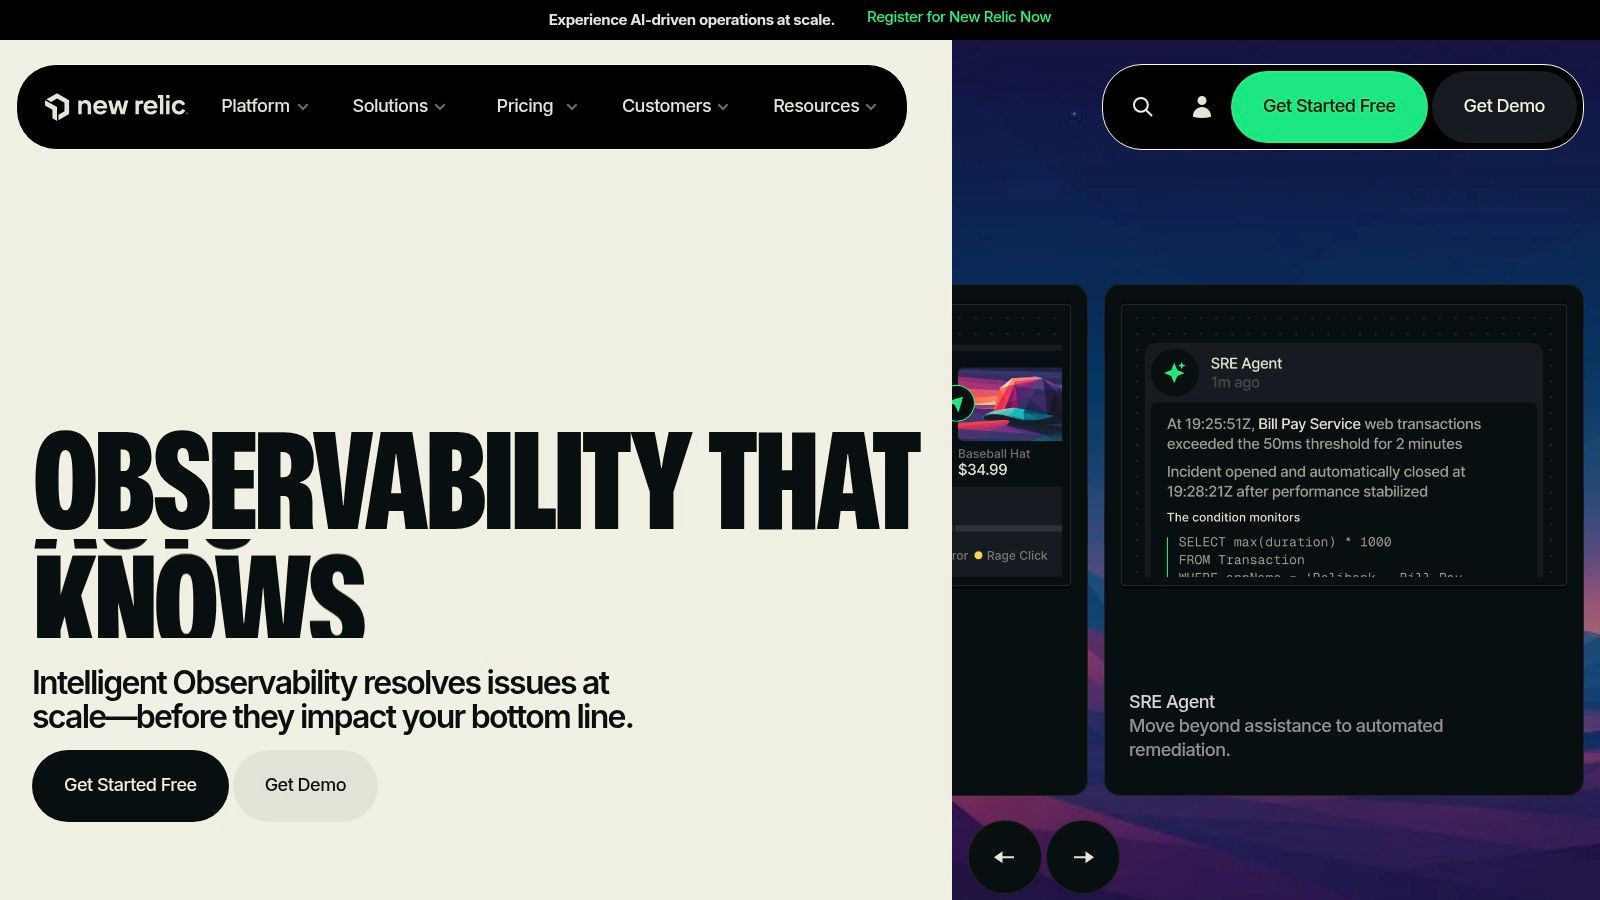
Its central advantage is consolidation. Application, infrastructure, logs, user experience, and business context can be queried through one telemetry platform. Prebuilt quickstarts, including ecommerce-oriented workflows, can shorten the path from instrumentation to an initial business view. Developer tooling and public documentation also support teams that want engineers to define custom business attributes.
The tradeoff is that New Relic works best when the organization is willing to model those attributes carefully. A business KPI is only useful when event names, dimensions, identity, timestamps, and ownership are consistent. That modeling effort belongs to the customer, and advanced capabilities may depend on the edition selected.
New Relic's consumption-based pricing and free-tier entry can support incremental adoption. That flexibility is useful for a team piloting one application or workflow, but buyers should still forecast telemetry volume, retention, custom events, and growth. The apparent simplicity of starting small doesn't remove the need for usage controls.
Fit by monitoring layer
For finance, New Relic is a plausible choice when transaction outcomes need to be traced through services. Healthcare teams should determine whether custom attributes contain protected information and how access is segmented. Telecommunications organizations can use it where customer experience and service performance share a telemetry foundation.
It is less suitable as the only platform when the requirement is in-database business monitoring with validation, timeliness, and schema tracking. The comparison with New Relic should therefore focus on the boundary being controlled, not merely on whether both products offer anomaly alerts.
7. Tableau Pulse
Tableau Pulse brings AI-assisted KPI monitoring into the Tableau ecosystem. It proactively surfaces changes, trends, and contextual explanations through summaries and digests, with delivery options that include Slack and email.
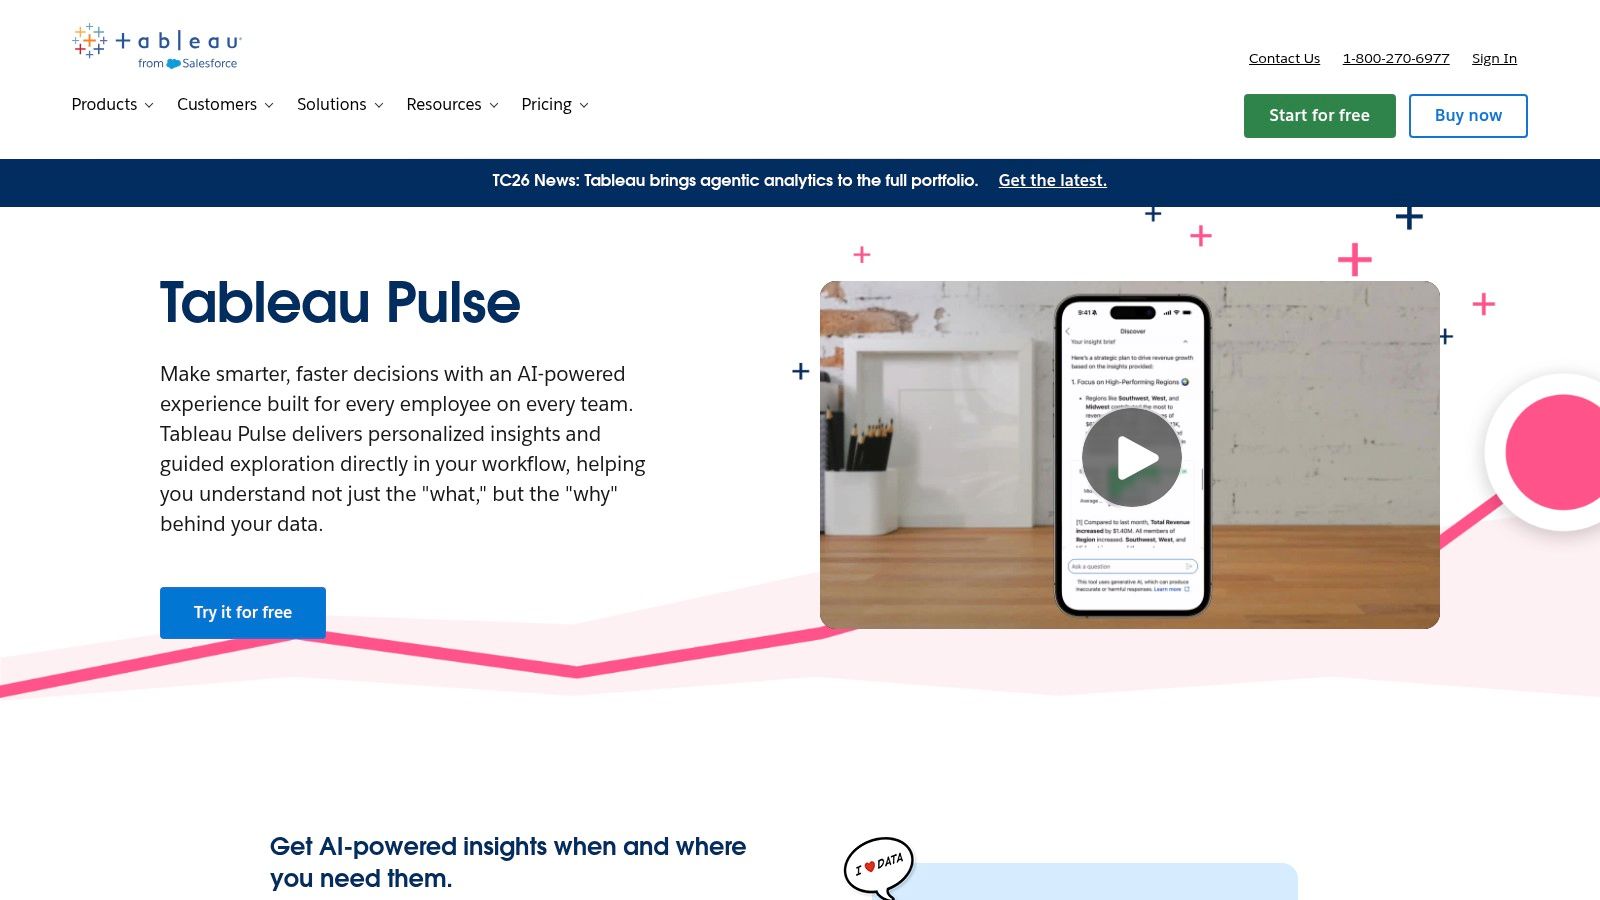
The product is built for business stakeholders who want relevant KPI updates in their daily workflow rather than another dashboard to visit. Its value is highest when Tableau Cloud is already the organization's BI standard and governed metrics are available for Pulse to interpret.
That dependency also defines the limitation. Tableau Pulse doesn't turn an ungoverned warehouse into a reliable monitoring system. The quality of its narrative context and alert usefulness depends on data modeling, metric definitions, permissions, and the Tableau Cloud edition in use. Availability and feature depth can vary by edition, so procurement should validate the exact configuration rather than relying on a general product description.
For finance, Tableau Pulse can improve distribution of approved management metrics, provided finance and data governance teams agree on definitions and recipients. Healthcare organizations should inspect how summaries handle sensitive dimensions and whether alert recipients are appropriately restricted. Telecom teams may value the daily flow of business updates, but operational service diagnosis will usually require an application or network observability layer.
Pricing can become complex when Tableau licensing, Cloud editions, governance, and user access are considered together. Implementation is moderate for an existing Tableau estate and considerably higher for teams that must first standardize their metric model. It is a strong BI-centered monitoring option, not a replacement for source-level anomaly, validation, or timeliness controls.
8. Looker Google Cloud
Looker provides business monitoring through a governed BI model built with LookML. Its alerts can run on time-series or categorical results, use thresholds, and deliver notifications through email or Slack. Public and private alert options help organizations control visibility.
The key differentiator is semantic governance. LookML gives teams a versioned way to define business metrics, dimensions, joins, and access rules. That structure can create a dependable source of truth for KPI alerts, especially in organizations where different departments otherwise calculate revenue, margin, utilization, or customer activity differently.
Looker requires modeling discipline and LookML expertise. An alert can be technically configured yet operationally weak if the model has ambiguous joins, incomplete filters, or unclear ownership. Some Slack capabilities also require workspace configuration by administrators, so integration readiness belongs in the implementation plan.
A governed alert is not a data contract
Looker is well suited to finance teams that need consistent metric definitions across reporting and alerting. Healthcare organizations may benefit from permission-aware delivery and controlled access to governed explores, although they still need to assess the underlying data controls. Telecommunications teams can use Looker for standardized commercial and operational KPIs, while separate platform tools monitor pipelines and infrastructure.
The pricing approach is tied to the broader Google Cloud and Looker deployment, so buyers should assess licenses, model development, administration, and warehouse consumption together. Implementation is heavier than a lightweight dashboard alert because the semantic layer is part of the product's value.
Looker is a good choice when the priority is trusted metric consumption. It is not the right sole tool when teams need AI baseline learning on raw datasets, record validation, expected delivery estimates, or continuous schema-change detection.
9. Amplitude
Amplitude is a product analytics platform for monitoring user behavior, product KPIs, and growth funnels. Its anomaly detection, forecasting, KPI monitors, and root-cause analysis are designed for metrics such as daily active users, conversion, retention, and other product or engagement measures.
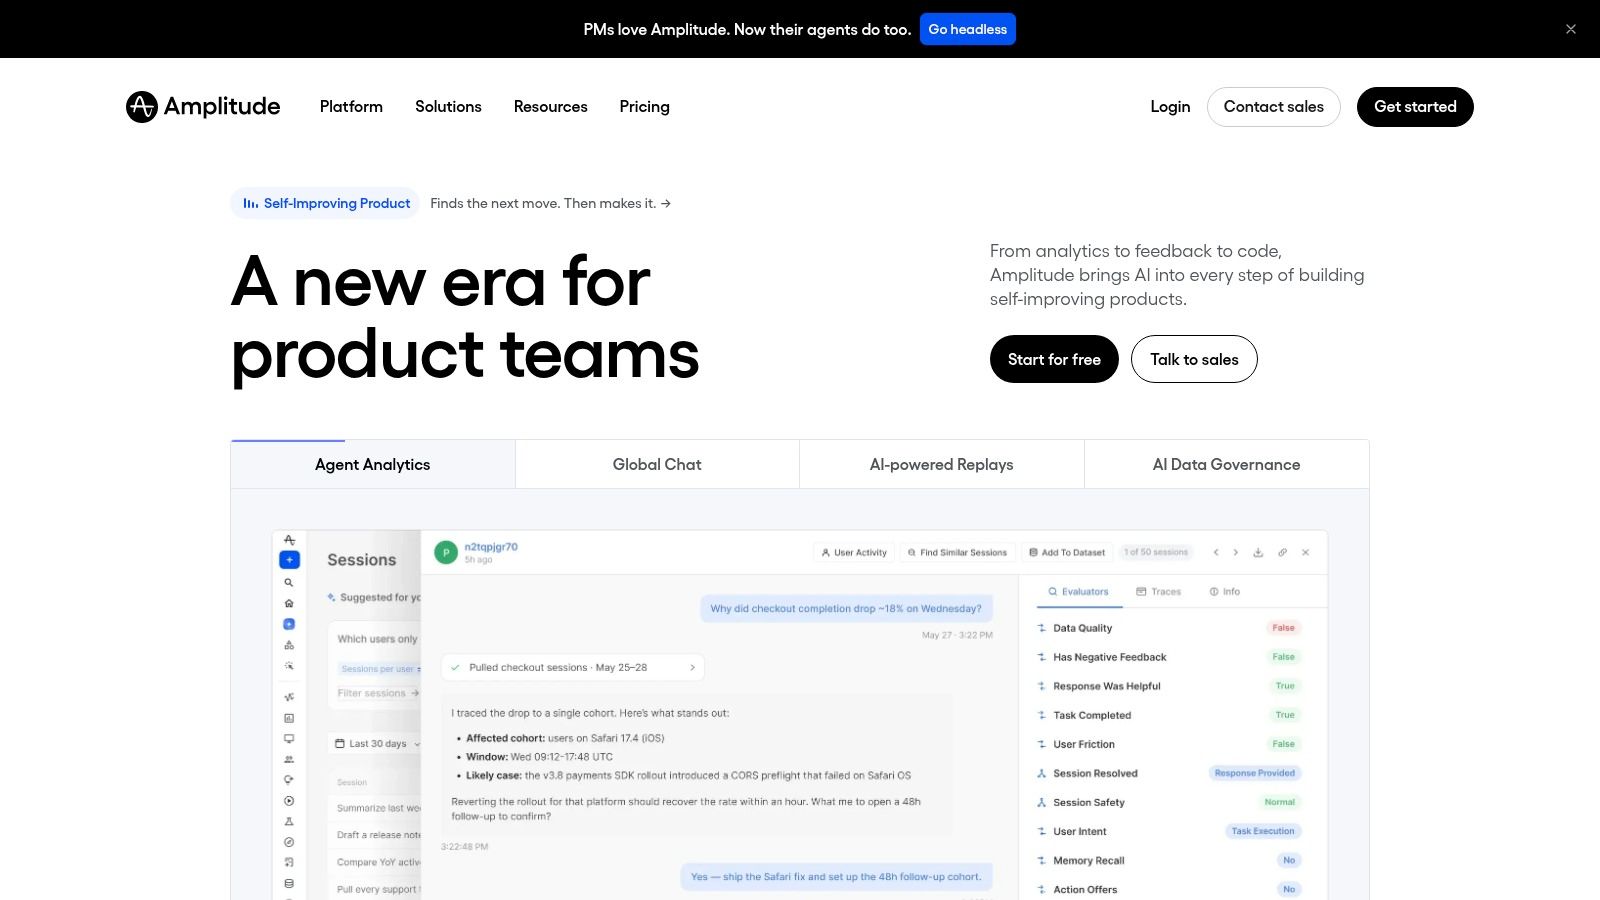
Amplitude's monitoring boundary is the product experience. Teams can detect changes in time-series metrics with confidence intervals, configure Slack or email alerts, and investigate drivers through behavioral segments and funnel analysis. AI-assisted charting can make it easier for product teams to create monitors without relying entirely on analytics engineers.
That focus gives Amplitude a practical advantage over general-purpose observability tools for product and growth questions. A product manager can investigate whether a conversion change is associated with a funnel step, device group, release cohort, or user behavior pattern. The same workflow isn't intended to monitor warehouse freshness, application traces, network health, or regulatory data controls.
Amplitude offers free and Plus tiers for piloting, while higher volumes and advanced capabilities move buyers toward Growth or Enterprise arrangements. Teams should model event volume, retention, seats, and the product areas included in the deployment. A pilot can be accessible, but enterprise rollout still requires instrumentation standards and event governance.
For finance, Amplitude is relevant to digital acquisition, conversion, and customer journeys rather than core financial controls. Healthcare organizations should review event collection carefully, particularly where patient or clinical behavior could be inferred. Telecom teams can use it to monitor self-service, onboarding, plan selection, and digital retention, but network and billing operations need complementary monitoring.
Use Amplitude when the question is “How are users moving through the product?” Use data observability when the question is “Can we trust the dataset behind the KPI?”
10. Qlik Qlik Cloud and Qlik Alerting
Qlik Cloud and Qlik Alerting combine analytics with notifications based on data conditions, outliers, and anomalies. The platform supports data, system, and broadcast alerts, while Qlik Automations can route notifications to Slack, Teams, and other systems.
Qlik is strongest for organizations standardizing on Qlik Cloud Analytics and needing flexible distribution of governed insights. Complex alert conditions can support operational use cases beyond simple threshold checks, while permission-aware delivery helps align notifications with user access.
The deployment distinction matters. Qlik Cloud capabilities and on-premises Qlik Alerting for Windows aren't identical, so enterprises with hybrid estates should validate edition-specific behavior, administration, connectivity, and alert ownership before choosing an architecture.
Qlik uses capacity-based Qlik Cloud plans that include alerting. That can make the commercial model easier to align with a broader analytics deployment, but buyers need to plan for data volume and usage. A capacity model can also make cost attribution less direct when many teams share the same environment.
Finance teams may use Qlik to distribute governed performance and risk indicators. Healthcare organizations should test permission behavior with realistic role structures and sensitive data classifications. Telecommunications companies can benefit from flexible alerts across commercial, operational, and service datasets, although source-level validation and pipeline timeliness may require a complementary platform.
Implementation is moderate when Qlik is already established and more demanding when teams are introducing its data model, automations, and alert administration together. Qlik is a good fit for analytics-centered alerting. It is less suitable as a standalone replacement for application traces or in-database data observability.
Top 10 Business Monitoring Solutions, Feature Comparison
Solution / Vendor | Core Features ✨ | Value / USP 🏆 | Quality / UX ★ | Target Audience 👥 | Pricing / Value 💰 |
|---|---|---|---|---|---|
Solutions - Business Monitoring (digna) | ✨ AI-driven anomaly, timeliness, record validation, schema tracking, in-database execution | 🏆 Runs inside customer infra + unified observability for KPIs & incidents | ★★★★☆ Shared UI, rapid time-to-value (<2h) | 👥 Enterprise data/analytics teams; regulated industries | 💰 Modular: base + per-active-table; transparent, usage-stable |
Anodot | ✨ Unsupervised AI anomaly detection for high-cardinality KPIs; fast baseline learning | 🏆 Strong KPI-focused detection with monetary impact signals | ★★★★☆ Low false positives; fast at scale | 👥 Revenue/ops/finance teams needing real-time KPI alerts | 💰 Enterprise pricing (limited public list) |
ThoughtSpot | ✨ KPI monitors, SpotIQ/Spotter AI, Slack/Teams/mobile alerts | 🏆 Search-driven BI + proactive KPI alerts for business users | ★★★★ Easy subscription to alerts; business-friendly UX | 👥 Business stakeholders and analysts | 💰 Enterprise-oriented licensing |
Splunk Observability Cloud | ✨ Business Journeys, APM, logs/metrics/traces correlation | 🏆 Correlates technical telemetry with end-to-end business processes | ★★★★ Robust diagnostics; complex UI for non-eng teams | 👥 Engineering + business ops at large enterprises | 💰 High cost/complexity for KPI-only use cases |
Datadog | ✨ Flexible metric monitors, Watchdog anomaly engine, rich integrations | 🏆 Mature alerting and cross-telemetry correlation | ★★★★ Scalable alerts; requires governance to avoid noise | 👥 SRE/engineering teams (can surface business metrics) | 💰 Usage-based; can become expensive with heavy ingest |
New Relic | ✨ Custom metrics/events, NRQL queries, unified telemetry | 🏆 Single telemetry platform with consumption-based pricing option | ★★★★ Good dev tooling; NRQL flexible dashboards | 👥 DevOps, SRE, and teams tracking custom KPIs | 💰 Consumption-based pricing; free tier entry |
Tableau Pulse | ✨ AI KPI digests/alerts, push to collaboration tools, Tableau-integrated | 🏆 Puts KPI monitoring into daily workflows for BI users | ★★★★ Business-friendly summaries; dependent on Tableau setup | 👥 Business stakeholders using Tableau | 💰 Edition-dependent licensing; can be complex |
Looker (Google Cloud) | ✨ Governed alerts on Looks/tiles, LookML modeling, Slack/email alerts | 🏆 Strong governance / single source of truth for KPIs | ★★★★ Reliable alerting if metrics are well-modeled | 👥 Analytics teams & metric owners | 💰 Enterprise pricing; requires LookML expertise |
Amplitude | ✨ Product analytics KPIs, anomaly detection, forecasting, RCA | 🏆 Fast operationalization for product/growth metrics | ★★★★ Friendly for product teams; good docs | 👥 Product, growth, analytics teams | 💰 Free/Plus tiers → Growth/Enterprise pricing |
Qlik (Qlik Cloud + Alerting) | ✨ Complex alert logic, Automations to Slack/Teams, governance-aware delivery | 🏆 Flexible distribution and enterprise-grade alerting | ★★★★ Fits governed Qlik environments; admin setup required | 👥 Organizations standardized on Qlik Cloud | 💰 Capacity-based plans; plan for volume/usage |
Choose the Monitoring Boundary You Need to Control
The right business monitoring software depends less on the number of dashboards, integrations, or AI labels than on the boundary your team must control.
Choose digna when data must remain inside the customer environment and the monitoring program needs to combine business anomalies with validation, timeliness, schema tracking, and platform visibility. Its in-database execution, private cloud and on-premises deployment options, shared interface, and modular structure address a problem that BI alerts often leave untouched: the KPI can be wrong because the underlying records are late, incomplete, structurally changed, or outside expected behavior. Timeliness should be treated as an operating model that includes delivery commitments, freshness, predicted arrival, failure detection, variability, and stage-level diagnosis, not as a simple timestamp check. digna's guidance on data timeliness outlines that broader approach.
Choose a BI-centered option such as ThoughtSpot, Tableau Pulse, Looker, or Qlik when the priority is governed metric consumption. These platforms are effective when business users need proactive updates in Slack, Teams, email, or mobile workflows and when the organization already has a trusted semantic model. Their alerts are only as reliable as the model, joins, permissions, and source data beneath them. They shouldn't be mistaken for automatic data contracts or complete pipeline observability.
Choose application observability such as Splunk Observability Cloud, Datadog, or New Relic when KPI changes must be traced to services, infrastructure, logs, requests, and user experience. These products are valuable when a transaction failure, latency change, or service dependency explains a business outcome. Their costs and implementation effort can rise with telemetry, custom metrics, retention, instrumentation, and tagging, so the pilot should include a realistic incident and a projected usage model.
Choose product analytics such as Amplitude when the central question concerns user behavior, funnels, conversion, retention, or product adoption. Product analytics can explain which users or journeys drove a change, but it won't by itself validate a warehouse table, identify a changed column, or prove that a regulated data feed arrived on time.
A practical evaluation should test the same representative workflow in each shortlisted platform. For finance, use a revenue, risk, or transaction process. For healthcare, use a clinical, operational, or regulatory dataset with appropriate access controls. For telecommunications, use a customer, billing, service, or high-volume operational workflow. Then verify six things:
Deployment: Does the platform run where governance requires, and does production data move outside the environment?
Ownership: Can the team assign every alert to a person or operating group with a defined response?
Data modeling: How much work is required to define metrics, dimensions, lineage, events, and business rules?
Integration: Can alerts reach the systems people use without creating duplicate incidents?
Pricing drivers: Does cost scale with tables, metrics, events, users, capacity, telemetry, retention, or alert volume?
Evidence: Can the platform show what changed, when it changed, which data or service was affected, and how the team resolved it?
Schema drift deserves particular attention because it is a contract failure, not merely a value-quality problem. Added or removed columns, renamed fields, and data-type changes can break downstream consumers even when individual rows appear valid. Independent schema drift guidance supports validating schemas against an expected baseline or contractual definition.
The market's scale reinforces the need for a boundary-first decision. One estimate places enterprise monitoring software at $33.3 billion in 2025, projected to reach $79.3 billion by 2034, with a 10.2% CAGR, while BFSI held the largest sector share at 28.2% in 2025 according to Dataintelo's monitoring software estimate. Those figures describe a broad category, not a reason to buy the broadest platform. The best choice is the one that controls the failure mode your team can't afford to miss.
digna provides in-environment business monitoring with AI-driven anomaly detection, data validation, timeliness tracking, schema monitoring, and platform observability for warehouses, lakes, and pipelines. Visit digna to evaluate how a controlled, modular monitoring boundary can support finance, healthcare, telecommunications, and other data-sensitive operations.
Picking a tool is only half the job: once it is running, the monitoring itself has to work. Our practical guide to running a business monitoring system covers how to move beyond fixed thresholds, connect KPI drift back to the data that produces it, and cut alert fatigue without missing real incidents.
Frequently asked questions
What is the best business monitoring software for regulated industries?
It depends on which monitoring boundary you need to control. If production data must stay in your environment, digna runs metric computation inside your database, on-premises, in a private cloud or VPC, and combines KPI anomaly detection with timeliness, validation and schema tracking in one shared interface.
How is business monitoring software priced?
Pricing models differ sharply between vendors. digna charges a base fee plus active tables per module, while Datadog and New Relic scale with telemetry and custom metrics, Qlik uses capacity-based plans, and Anodot and ThoughtSpot sell enterprise licenses with limited public list pricing. Model your real volumes before comparing headline prices.
Can BI tools like Tableau Pulse or Looker replace data monitoring?
No, not on their own. Tableau Pulse, Looker, ThoughtSpot and Qlik alert on governed metrics, but those alerts are only as reliable as the model and source data beneath them. A late, malformed or schema-drifted table can still produce a clean-looking KPI alert that reports an incomplete result.
Datadog vs digna for business KPI monitoring: which should I choose?
Choose Datadog when a KPI change must be traced to services, logs and infrastructure, for example a failed payment rate tied to database latency. Choose digna when the question is whether the data itself arrived on time, kept its structure and passed business rules. Some teams run both side by side.
What should I test during a business monitoring software pilot?
Run the same representative workflow in every shortlisted platform, such as a revenue process in finance or a billing workflow in telecom. Then check six things: deployment and data movement, alert ownership, data modeling effort, integrations, pricing drivers, and whether the tool shows evidence of what changed and how it was resolved.


