Anomaly Detection Time Series: The 2026 Guide
|
8
min read

Monday's dashboard review is where a lot of teams first realize they don't trust their monitoring. The revenue chart looks steady, but a load arrived late, one column changed type, and yesterday's “normal” number was already wrong by the time anyone opened the report. That's the kind of failure anomaly detection time series is meant to catch, and it's why a generic outlier check isn't enough once data starts flowing through real warehouse jobs, dbt models, BI layers, and downstream ML features.
The hard part is that the data didn't just spike. It drifted, arrived out of order, changed shape, or moved against a seasonal pattern that a static rule never learned. If you want a practical reference point for what's changing in the market around observability and detection tooling, the curated new tech products showcase is a useful place to scan current products without turning your workflow into a vendor tour.
Table of Contents
Evaluation, Thresholds, and Alerting That People Actually Trust
Online Detection and the Operational Signals Most Models Miss
Why a Healthy Dashboard Can Suddenly Lie to You
A dashboard can look healthy for days while the system underneath has already gone sideways. A late warehouse load can make yesterday's revenue appear stable until a finance analyst notices that the “final” number changed after the meeting. A column type change can quietly break a downstream aggregation without throwing a loud error, and a pipeline that used to land at 6 a.m. can slip to 9 a.m. without any metric value crossing a fixed threshold.
That's why time-series anomaly detection is its own discipline. In a time series, order matters, timing matters, and the expected shape of the data matters. A number that is unusual on a Tuesday may be completely ordinary on a holiday weekend, and a point that looks harmless in isolation can still be the first sign of a broader incident.
Static rules break when the baseline moves
The earliest practical systems leaned on rolling local baselines. Industry guidance on the rolling Z-score uses the 30 minutes of data before a timestamp, removes outliers, computes mean and standard deviation, and flags a point when its Z-score exceeds ±2; another common variant uses a rolling window with a threshold of 3 standard deviations. Those methods work because they compare a value to its recent context, not to some frozen global average. Tinybird's anomaly detection guidance is a clean example of that older baseline-first mindset.
Practical rule: if your metric has seasonality, delayed loads, or schedule changes, a static threshold will eventually lie to you.
The reason this keeps biting teams is simple. Warehouse data isn't a clean lab series, it's an operational artifact. Schedules shift, schemas evolve, and upstream systems behave differently on Monday mornings, month-end closes, and after product launches. A detector that only understands “high” and “low” misses the meaning of “late,” “changed,” and “unexpectedly different from this hour yesterday.”
The field has moved from simple outlier checks toward models that learn normal behavior over time and then score deviations from that learned pattern. That shift matters because real incidents are rarely just single points. They're sequences, trends, and context failures. A healthy dashboard can still be telling a false story if you only look for spikes and never ask whether the data arrived on time, in the right shape, and under the right baseline.
The Three Faces of a Time-Series Anomaly
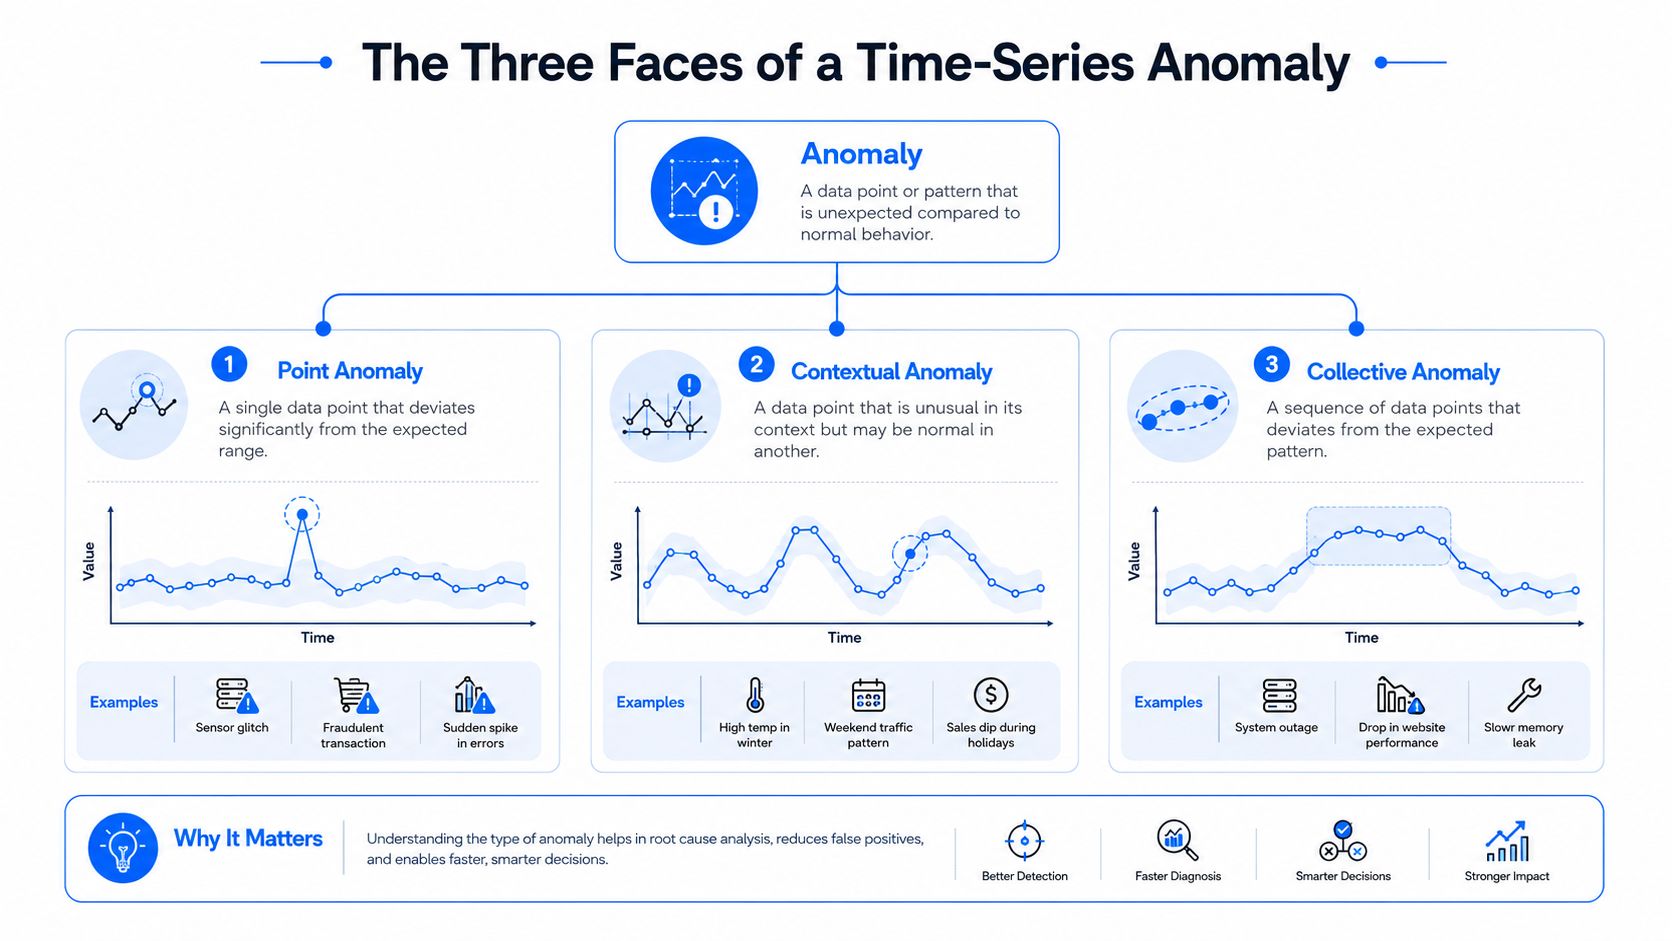
A useful way to think about anomaly detection time series is to sort what you're hunting into three buckets. The terminology matters because the wrong mental model leads to the wrong detector, and the wrong detector creates noisy alerts nobody trusts. A 2024 review groups anomalies into point, contextual, and collective types, and that framing matches what shows up in warehouses and pipelines. The review on anomaly types and method families is a solid taxonomy to keep in mind.
Point anomalies are the obvious ones
A point anomaly is a single rogue value. In a warehouse, that might be one order amount that was loaded with an extra zero, or one sensor reading that hit a nonsense value because the upstream parser misread the field. These are the easiest to describe and usually the easiest to explain to non-technical stakeholders.
Contextual anomalies depend on timing
A contextual anomaly is a value that looks fine by itself but is wrong for the moment. A Friday-night transaction count can be normal on Friday and suspicious on Sunday. A sudden traffic dip during a planned release window might be expected, while the same dip on an ordinary weekday could point to an outage. Context gives the number its meaning.
Collective anomalies show up as a pattern
A collective anomaly is a sequence that looks acceptable point by point but wrong in shape. A slowly rising null rate is the classic warehouse example, because each step can look small while the overall trend poisons downstream models. A drift in schema quality or a repeated late-arrival pattern can also be collective, because the incident is the shape, not any single point.
That's where the old rolling Z-score still earns its place. It gives you a first mental model for local deviation, and it teaches the discipline of comparing each value to a nearby baseline rather than a global rule. Academic lecture material on sequential statistics and later surveys of anomaly methods both show the same evolution, from suspicion scores and alarms to distance-based, density-based, and machine-learning approaches that try to learn normality rather than just catch obvious outliers. Berkeley's lecture slides on sequential statistics capture that historical shift well.
From Rolling Statistics to Deep Models
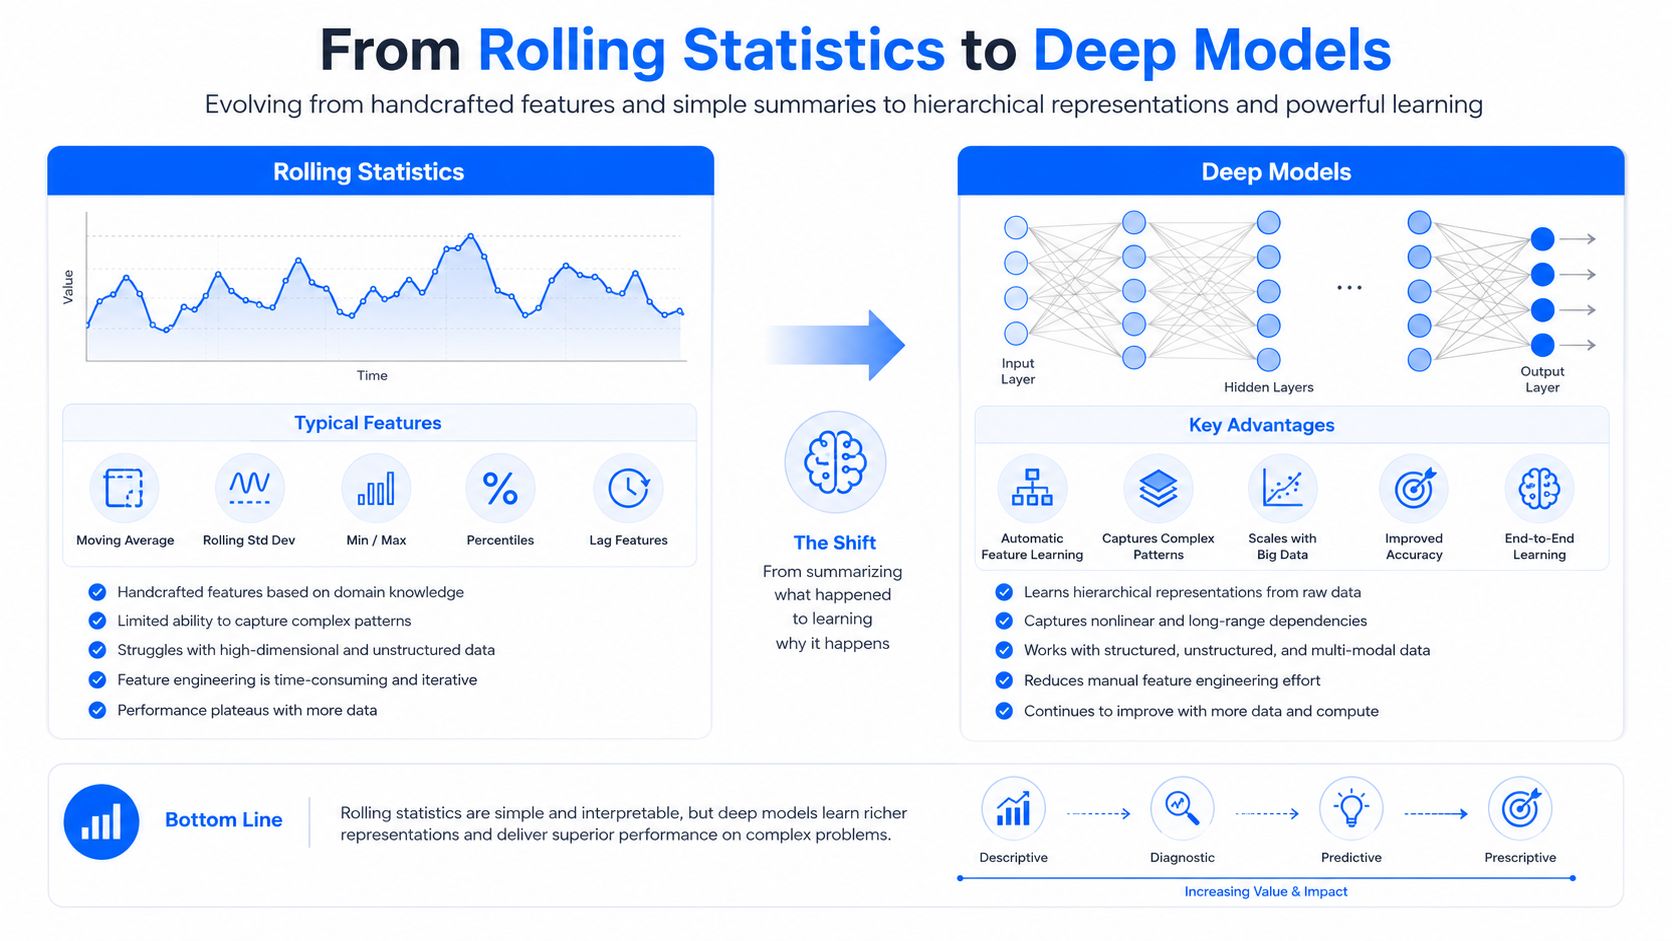
The method choice is usually where teams overcomplicate things. They jump to a deep model when the core problem is a bad baseline, or they cling to a simple threshold when the data clearly needs seasonality handling. A 2023 comparative study of unsupervised deep-learning anomaly detection breaks the workflow into preprocessing, anomaly scoring, and thresholding, which is a useful reminder that the model is only one part of the system. The comparative study on unsupervised anomaly detection is a good anchor for that pipeline view.
Compare the common methods side by side
Method | Best for | Key trade-off |
|---|---|---|
Rolling Z-score | Stable metrics with local baselines | Easy to explain, weak on seasonality and changing patterns |
STL decomposition | Series with strong seasonal structure | Better separation of trend and seasonality, more tuning |
Matrix profile | Repeating shapes and subsequence search | Good at shape-based anomalies, less natural for business context |
Isolation forest | High-dimensional feature sets | Works well on tabular features, not raw series intuition |
Autoencoders | Learning normal behavior from complex signals | Powerful, but harder to explain and maintain |
LSTM predictors | Sequence dependence and forecasting-style detection | Handles temporal patterns, but can be brittle to drift |
Transformers | Rich long-range dependencies | Strong on complex patterns, heavier operational cost |
What each method buys you
Rolling statistics are fast, understandable, and often enough for simple business metrics. STL decomposition helps when the daily rhythm is real and obvious, which is why it shows up in production for metrics with strong weekly or hourly patterns. It separates a song into melody and background, then checks whether the melody suddenly changed.
Matrix profile is useful when you care about repeated subsequences and shape changes, not just level shifts. Isolation forest can work well once you've engineered features from a series and want a lightweight detector on top of them. Autoencoders, LSTM-based detectors, and transformer-based methods are the right conversation only when normal behavior is complex enough that simpler scoring keeps missing the same incidents.
Operational takeaway: if an engineer can't explain why the alert fired in one sentence, the detector is probably too abstract for first-line monitoring.
This is also where many teams can get practical help from the kind of method summaries linked at outlier identification methods in a production context. The useful question isn't which algorithm sounds modern. It's which one survives baseline drift, can be tuned without weekly retraining, and still makes sense when a BI analyst is asked to trust the alert at 8 a.m.
Univariate, Multivariate, and the Curse of Extra Dimensions
A univariate detector watches one signal at a time, and that is often the right place to begin. Daily revenue, failed jobs, delayed rows, and null rate all work well as single-series checks because the link between the metric and the incident is easy to explain. A multivariate detector watches several signals together, which helps when the failure comes from a combination of changes that no single metric would flag.
The benefit is clear in the right setup. Revenue, sessions, marketing spend, and weather can move together in a way that reveals a correlated shift long before any one line looks broken. But extra dimensions bring baggage. False correlations appear, thresholds become unstable, and an alert can fire on an interaction that is just normal business behavior.
Add dimensions only when they change the decision
Add a second or third signal only when it answers a different question. If the extra metric merely repeats the first one, it adds noise. If it helps explain whether the change is operational, commercial, or environmental, it earns its place.
Correlation helps, but it doesn't solve the whole problem
Use correlation analysis as a filter, not as a guarantee. Strongly related metrics are good candidates for joint monitoring, but correlation alone will not tell you whether a spike is expected, whether the schedule changed, or whether the schema drifted. That is why operational signals matter so much in real systems, especially when a bad load or a delayed partition can make multiple downstream tables look “anomalous” for the wrong reason.
For warehouse teams, that distinction matters more than the model choice. A late upstream job, a missed partition, or a renamed column can trigger a cascade of downstream alerts that look like value anomalies even though the underlying issue is timeliness or schema drift. In practice, that means the detector needs to watch both the business metric and the pipeline state, because one without the other leaves too many false leads on the pager.
Practical rule: if a multivariate alert needs five minutes of explanation before anyone knows what to do, break it back into simpler monitors.
The curse of extra dimensions shows up in thresholding too. More inputs usually mean more chances to trigger on harmless variation. In warehouse environments, that is dangerous because the true incident may be that the data arrived late, the schema changed, or a column was renamed, not that the metric itself moved. A detector focused only on value changes can drown in the noise that the operational signal would have clarified.
Some teams try to fix this by adding more features and more correlation checks. That often makes the model harder to tune and harder to trust. A better pattern is to keep the value detector narrow, then pair it with operational checks for freshness, completeness, and schema stability so the alert tells the on-call engineer what kind of problem is likely happening.
Evaluation, Thresholds, and Alerting That People Actually Trust
Accuracy is the wrong metric for rare anomaly data. If anomalies are scarce, a model can look excellent while missing the exact failures you care about, and a high score on a benchmark says little about how the detector behaves when the pattern shifts in production. That's why evaluation has to be built around alert usefulness, not just classification math.
The practical workflow starts with threshold tuning on historical slices that reflect real operating conditions. A threshold that looks fine on a clean development window can fall apart after a holiday, a schedule change, or a schema migration. The detector should be judged on whether it raises the right alarms at the right time, with enough context for a human to act.
Calibrate the score before you ship it
A suspicion score means little to a business user unless it's anchored. That can mean comparing the score to recent history, showing the baseline range, or surfacing which run, table, or metric changed. The goal is not to make the math simpler. The goal is to make the output actionable.
Alerts need context, not just color
A red flag is not a diagnosis. Good alerts name the metric, the baseline, the run, and the likely type of anomaly. If a timeliness issue caused the pattern, the alert should say that. If the schema changed upstream, the alert should say that too. Anything less forces the engineer to start from scratch every time.
The 2023 study on unsupervised deep-learning anomaly detection is useful here because it reminds teams that scoring and thresholding are separate phases, not a single magical step. That comparative study also aligns with the operational reality that the score is only as good as the threshold you're willing to maintain.
A pre-shipping checklist
Historical slices: test on periods that include seasonality, late loads, and known schema changes.
Threshold stability: see how often the detector fires when the baseline shifts but the business process has not.
Alert payload: include the metric name, time window, and baseline description.
Human triage path: make sure the recipient can tell whether the issue is data, pipeline, or business behavior.
Noise tolerance: check whether one bad day causes alert fatigue for the next two weeks.
A detector that wins on paper but creates noisy pages in production won't last. Teams keep the system that helps them act quickly and discard the one that only improves a benchmark slide.
Online Detection and the Operational Signals Most Models Miss
Operational time series are not just streams of values, they're streams of events with arrival patterns, schema structure, and job timing attached. That's why online detection matters. It watches the series as it evolves, updates a baseline as new data arrives, and reacts before the next dashboard refresh hides the incident.
The overlooked problem is that a lot of “anomalies” in warehouse work are not value anomalies at all. A partition lands late. A downstream table changes shape. A run that normally finishes before breakfast slips into the middle of the business day. If you only monitor values, you miss the business event.
What online detection needs to see
A useful operational detector usually needs three views at once. It needs a value view for the metric itself, an arrival view for timeliness, and a structure view for schema or field changes. That combination is what catches incidents that would otherwise surface only after a broken dashboard or a bad model prediction.
Late loads are not the same as low values
A late-arriving load can make the metric look temporarily low even when the upstream process is healthy. If the detector doesn't understand schedule expectations, it can raise false alarms and teach the team to ignore it. That's why the best pipelines compare actual arrival against learned or declared schedules, not just against yesterday's value.
Recent research on operational data streams points to the same gap, with newer methods focusing heavily on detection accuracy while leaving timing, drift, and schema evolution underexplained. The review on operational time-series anomaly detection highlights that mismatch, especially for warehouse environments and private deployments where data can't leave the customer boundary.
Practical rule: a detector that knows the value but not the delivery time is only solving half the incident.
Structural drift can invalidate downstream features
Schema evolution is especially dangerous because it can break a pipeline without breaking the source system. A column type change, a removed field, or a newly added attribute can poison features and embeddings long before anyone spots a visible metric shift. That's why operational anomaly detection has to include structure, not just numbers.
For teams wanting a concrete workflow around that broader view, automating anomaly detection in production is a relevant internal reference point. The main lesson is simple, though. Real monitoring has to cover the values, the arrival pattern, and the shape of the data together, or else the most expensive incidents slip through.
Common Pitfalls and the Case for Simpler Baselines
The most common mistake is reaching for a complex model before proving that a simpler baseline fails. Teams do this because deep learning feels safer against edge cases, but in practice the extra complexity can make an operational system harder to tune, harder to explain, and harder to keep stable when schedules change.
The failures repeat in predictable ways
A stale baseline after a holiday can make everything look broken. Alert fatigue builds when a score is noisy and the threshold is too aggressive. Point anomalies and collective anomalies get confused when the team uses one detector for everything. And once a single major incident happens, many teams freeze the threshold too conservatively and stop catching smaller but still important drifts.
Mitigations should be boring
Keep the baseline window honest, and revisit it after schedule changes. Separate detectors for value, timeliness, and schema usually work better than one giant monitor that tries to do everything. Retain a simple interpretable model even if a deep model is also in the stack, because the simple one becomes the sanity check when production behavior gets messy.
A recent survey's contrarian nuance lines up with what I've seen in real systems, simpler baselines often stay competitive when explainability and maintenance matter more than benchmark numbers. The literature continues to rely on reconstruction error, trend inconsistency, and threshold tuning, which is a strong hint that the field hasn't made interpretability obsolete. The survey on scarce labels and normal-only training captures that practical tension well.
Don't retrain just because the graph moved
A retrain reflex can hide a monitoring problem instead of solving it. If the issue is a broken schedule, a delayed feed, or a schema change, more training won't help. The model may get more fluent at modeling yesterday's mess, but the incident will still be in the pipeline.
The cleaner operating model is to start with interpretable baselines, add complexity only where the incident class demands it, and preserve a fallback that engineers can trust when the fancy detector goes quiet.
Enterprise Deployment With digna in Your Database
Most anomaly projects don't fail on algorithms, they fail on deployment friction. Data residency, governance, vendor access, and the cost of moving large tables around can block a good model before it ever reaches a dashboard. That's where in-database execution matters, because it keeps analyses next to the data and avoids turning observability into another ETL problem.
digna fits that pattern as one option in the enterprise stack. Its Data Anomalies module detects irregularities without manual rule writing, while Timeliness, Schema Tracker, Data Validation, and Data Analytics cover the operational signals that pure value detectors miss. The platform runs in customer-controlled environments, which matters when the warehouse can't leave private cloud or on-prem boundaries.
What makes this relevant for anomaly detection time series is the combination of signal types and deployment location. The same system can watch values, arrival patterns, schema changes, and historical trends without shipping the raw data somewhere else first. That's the practical bridge between method choice and production reality.
If you're trying to move anomaly detection out of notebooks and into a warehouse-native workflow, start with the data that already lives in your environment and the signals your pipelines already expose. digna gives teams an in-database way to monitor anomalies, timeliness, schema changes, validation, and trend behavior in one place, so you can catch real incidents without exporting sensitive data or layering on more brittle plumbing.


