Data Timeliness: Definition, Metrics and How to Monitor It
|
9
min read

A data pipeline can finish cleanly and still leave a dashboard wrong, a report stale, or a downstream model waiting on information that never arrived. That's the core mistake behind treating “on time” as the same thing as timely. In practice, data timeliness means data becomes available at the moment it's needed, in the window that makes it usable for reporting, decisions, and automated processing. Statistics Canada's framing, summarized in the Pedowitz Group reference, makes the operational point clear, timeliness is the delay between the reference point and availability, while punctuality is the gap between planned and actual availability, and the same source also notes that timely information should ideally arrive with its metadata, not after it. Pedowitz Group on measuring timeliness in data
That distinction matters because a job can succeed while the business still loses. A warehouse load can complete, but if the data is stale, missing, early, or delayed relative to the business window, the consumer still gets a bad outcome. The most useful way to manage this is as an operating system with eight metrics that move from commitments to freshness, predicted delivery, failure detection, variability, stage-level diagnosis, and anomaly monitoring.
digna's in-database monitoring, timeliness tracking, anomaly detection, analytics, schema tracking, and validation fit that model well because they keep the work inside the customer's environment and let teams monitor behavior without moving data around. When monitoring lives next to the data, teams can compare expected and actual arrivals, see patterns over time, and connect timing issues to schema changes or validation failures faster.
Service Level Agreement Compliance Tracking
A service-level agreement is the first line of defense in timeliness monitoring because it turns a vague expectation into a business commitment. If a finance team needs transaction data by a specific morning cutoff, or a healthcare operations group needs records before a shift change, the SLA defines whether the data was usable in time. Without that commitment, “the pipeline ran” can sound like success even when the business missed its window.
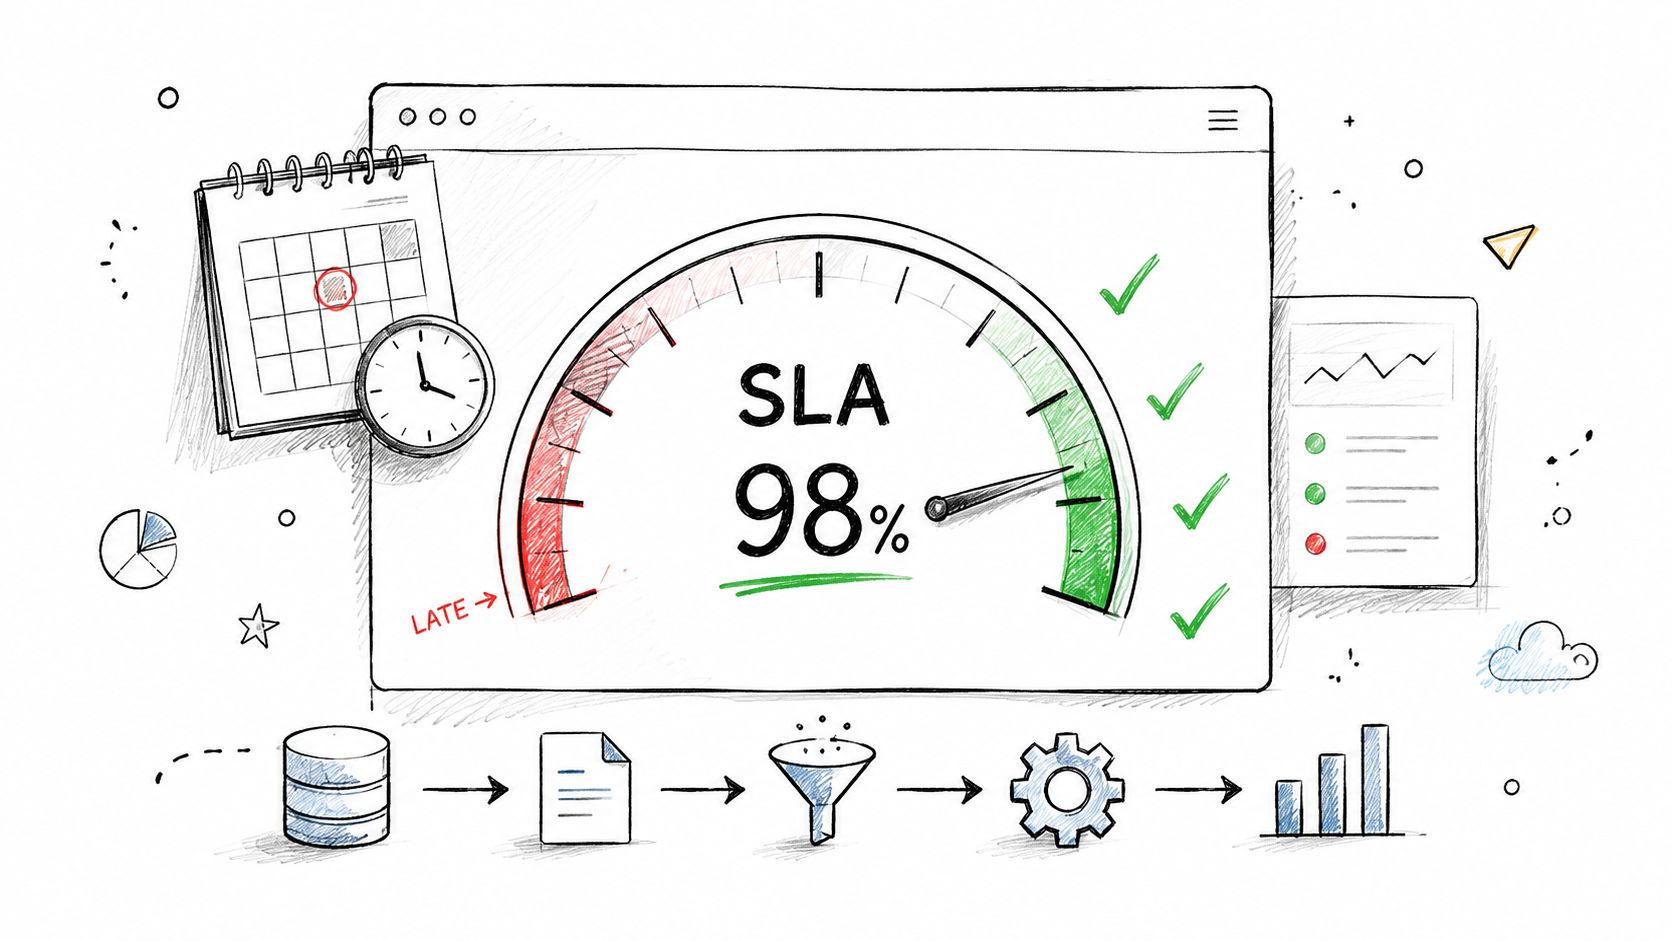
In practice, SLA compliance tracking compares actual delivery against the agreed window and makes the gap visible to everyone who depends on the data. That visibility matters for operational teams because late arrival often triggers a chain reaction, delayed reporting, manual workarounds, and mismatched downstream jobs. digna's timeliness module uses AI-learned patterns to estimate expected delivery times, then flags both delays and early arrivals against the agreed SLA in the customer's environment, which is exactly where the compliance check belongs. digna monitoring and reporting
A few habits make SLA tracking work better:
Define the SLA from the downstream process: set the target based on reporting, controls, or job sequencing, not on an arbitrary clock time.
Leave room for infrastructure noise: if a pipeline has normal variation, the SLA should reflect that reality instead of forcing constant false alarms.
Review the agreement regularly: quarterly review is a practical cadence when source systems, load patterns, or business expectations change.
Tell consumers what to expect: business users need to know whether a dataset is considered available, late, or still pending.
Keep execution near the data: in-database calculation avoids moving sensitive data just to measure compliance.
Practical rule: an SLA should describe when the data must be usable, not just when someone hopes the file lands.
A telecom team watching hourly billing feeds, a hospital loading patient records before the day shift, and a bank checking daily transaction data for regulatory reporting are all using the same logic. The difference is the business window, not the monitoring principle.
Data Freshness Metrics
Freshness is the age of the data at the moment someone consumes it. That's a different question from whether the pipeline eventually completed, because a technically successful load can still deliver information that's too old to support the decision at hand. In the FIM reference, freshness is usually computed as now minus the last update time, and alerting starts when that age crosses the SLA threshold. FIM data timeliness reference
The operational value is straightforward. A trading screen, a clinical alerting workflow, and an e-commerce inventory dashboard all care about how current the data is at consumption time. If freshness drifts, decisions drift with it. That's why freshness should be monitored separately by domain, not rolled into one broad “data health” score.
Freshness is not one universal target
A real-time dashboard and a daily finance close do not need the same freshness standard. Treating them the same creates noisy alerts for one team and blind spots for another. The better approach is to document freshness requirements in the catalog, set thresholds by domain, and let the monitoring layer compare each stream to its own expected currency window.
digna's analytics module is a good fit here because it can surface freshness trends and volatility instead of just checking a single cutoff. That matters when data is gradually getting older but hasn't crossed a hard threshold yet. The problem is often easier to catch as a trend than as a failure.
Use cases make the difference obvious:
Investment desks: stock price data has to stay current enough for the decision window, or the screen becomes historical rather than operational.
Hospitals: vital signs and test results have to surface quickly enough for clinical alerts.
Retailers: inventory freshness helps prevent overselling and unnecessary cancellations.
Public sector teams: case-management updates need to reflect current status for service coordination.
Freshness checks work best when each domain has its own acceptable age, not when everything is measured against a single clock.
If you're building the control layer, keep one rule in mind. Measure freshness where it is consumed, because that's where stale data hurts.
Expected Delivery Time Estimation
Expected delivery time is more useful than a fixed schedule when pipelines behave differently by day, volume, or system load. A static schedule says when data should arrive in theory. EDT says when it should arrive based on how it behaves. That makes it a better fit for teams that need to distinguish an ordinary delay from a true anomaly.
The FIM reference separates this into timestamp-based monitoring of event time, ingestion time, and processing time, which is the right foundation for EDT. The point isn't to guess wildly, it's to learn normal delivery patterns and then ask whether today's run still fits them. That's also where digna's AI-learned patterns help, because the module can calculate expected delivery times from historical behavior instead of forcing every dataset into a fixed rule. FIM data timeliness reference
Use prediction to cut noise, not to hide problems
EDT is most useful when teams need to avoid false alarms from ordinary variation. A retail sales load might always drift a bit after a higher-volume day. A telecom batch may shift around when network activity changes. A healthcare lab feed may slow down under operational load. In each case, the “late” signal should reflect unusual behavior, not ordinary pipeline rhythm.
That's why EDT should be reviewed with confidence, not worshipped as a perfect forecast. Historical pattern learning helps, but the model still needs operators who know when a source changed, a batch got heavier, or a deployment altered timing. If the prediction keeps missing in the same direction, the issue is usually operational, not statistical.
A practical way to use EDT:
Wait for enough history: use several weeks of stable behavior before trusting the learned window.
Check prediction reliability: treat EDT as an expectation band, not a promise.
Watch for repeated misses: repeated underestimation often points to infrastructure or source-side changes.
Pair it with schema tracking: structure changes can shift delivery behavior in surprising ways.
Use a visual comparison: expected versus actual arrival is easier to diagnose than a lone age number.
Retail, telecom, and healthcare teams all benefit from this layer because it helps them ask a better question. Not “did the job run,” but “did it run when we expected it to?”
Missing Data Load Detection
Late data is annoying. Missing data is worse, because a dashboard can look normal while the underlying batch never arrived at all. That's the gap this metric closes. It identifies the complete absence of an expected load inside a defined window, which is how teams catch silent failures before consumers make decisions on empty or stale datasets.
The internal failure mode is simple. A source system can stop sending a batch, a scheduler can break, a file transfer can fail, or a dependency can drift enough that nothing lands on time. If nobody is checking for the absence itself, downstream users may not discover the problem until a report looks strangely unchanged.
digna's timeliness monitoring is designed to detect missing loads from learned schedules and patterns, which gives teams immediate visibility when the expected dataset, table, or file doesn't show up. The internal data completeness checks guidance is relevant here because missing loads often look like timeliness problems first and completeness problems second.
Detection has to be faster than consumption
The strongest missing-load controls are built around business criticality. A daily regulatory feed deserves a louder alert than a low-priority reference table. A batch that drives operations may need a shorter detection window than one used for background analytics. That's not a technical preference, it's a business decision about how much stale data the organization can tolerate.
Correlating alerts with deployment changes helps too. If a new release, a connector upgrade, or a permission change coincides with a missing batch, the diagnosis often starts there. The point is to move from “the data is gone” to “the data stopped because X changed.”
A practical response pattern looks like this:
Set severity by downstream impact: alerting should reflect how badly the business is affected.
Write runbooks for the common cases: don't wait for an incident to define who checks what.
Document expected schedules in the catalog: teams need a shared source of truth.
Use different windows by source: high-criticality feeds deserve faster escalation.
Correlate with changes: deployment and infrastructure events often explain the break.
Financial services, healthcare, telecom, and public sector teams all hit this problem because they rely on recurring batches that people assume will always arrive. Missing-load detection removes that assumption.
Early Delivery Detection and Alerts
Early data sounds good until it breaks sequencing. If a batch lands far ahead of schedule, that can mean the pipeline logic changed, a scheduler fired incorrectly, or a dependency was bypassed. In tightly choreographed environments, early delivery can be just as disruptive as late delivery.
Timeliness monitoring needs to think beyond “delay.” The signal is not only about lateness, it's about any meaningful departure from the expected window. digna treats early deliveries as anomalies, which is the correct stance when timing is part of the contract between systems. The related real-time data monitoring page fits well for teams that need to watch those fast-moving behaviors closely.
Early can mean wrong, not better
A financial close process is a good example. If a ledger feed appears before late transactions have posted, the close may proceed on incomplete data. In healthcare, an early batch process can finish before dependent jobs are ready, creating broken handoffs. In investment operations, a market data load that arrives outside the learned window may indicate a schedule change that needs validation, not celebration.
The operational challenge is to separate legitimate optimization from a faulty change. Some teams do intentionally improve processing times, and those improvements should be documented. But undocumented early arrivals deserve investigation because they often hide a contract change that downstream users haven't been told about yet.
A useful review pattern:
Don't treat early arrival as a success signal until you've checked the dependency chain.
Confirm the reason: find out whether the timing shift was intentional.
Document approved changes: legitimate speedups should be written down.
Use anomaly detection with timeliness: timing alone doesn't explain whether the shift is safe.
Focus on material early arrivals: tiny deviations often don't matter operationally.
Check downstream readiness: if consumers weren't ready, the load arrived too soon.
This metric matters most in finance, healthcare, and any batch workflow where order matters. When sequencing is part of the process, early delivery is a control problem, not a win.
Load Completion Time Windows and Variability
A single arrival time hides too much. What teams really need to know is whether a load completes inside a stable window or whether the window is widening over time. That's why variability belongs in the monitoring system. It shows whether the process is getting less predictable, even if it still finishes before the SLA most days.
The useful measures here are the mean completion time and a measure of spread, such as standard deviation or coefficient of variation. The exact formula is less important than the operational question, which is whether the process is staying consistent. High variance often appears before a visible incident. A pipeline that still “works” can become fragile long before it starts missing hard deadlines.
digna's Data Analytics module helps surface trends and volatility in timeliness metrics, which is exactly what this layer needs. A stable average with growing spread is often the first sign that infrastructure, source volume, or dependency timing is changing. You don't need a failure to justify attention.
Variability is an early-warning signal
Retail analytics teams see this when daily sales loads start finishing at less predictable times. Healthcare teams notice it when patient record arrivals vary more than usual. Telecom teams feel it when billing completion shifts around without a clear source-side reason. In each case, the issue may not yet be a missed SLA, but the system is getting harder to trust.
The monitoring response should be statistical and operational at the same time. Compare the current window with prior baselines, then check whether any deployment, volume spike, or infrastructure change explains the spread. If the variance grows without an obvious reason, the safest move is to investigate before the instability becomes a service incident.
Useful actions include:
Track separate windows by source type: high-volume and low-volume feeds won't behave the same way.
Review monthly trend changes: you want to catch drift before it becomes routine.
Correlate with volume and infrastructure events: variability often follows pressure points.
Use trend evidence for capacity requests: unstable completion times help justify investment.
Avoid overreacting to one noisy run: sustained variance is more meaningful than a single outlier.
Variability analysis makes timeliness monitoring less reactive. Instead of waiting for the next late batch, teams can spot the conditions that make lateness more likely.
End-to-End Latency Tracking Across Pipeline Stages
End-to-end latency tells you how long data takes to move from source to final destination. That sounds simple, but the value comes from breaking the path into stages. Extraction, transformation, loading, and consumption each add their own delay, and without stage-level timestamps, teams end up guessing where the slowdown lives.
The source-to-destination view matters because a pipeline can be slow for different reasons in different places. One stage may be healthy while another is absorbing all the delay. If the only thing you measure is the total elapsed time, diagnosis gets fuzzy fast.

The FIM reference already recommends separating event time, ingestion time, and processing time, which is the right mental model for this metric. digna's data pipeline architecture view supports that same logic by making the full path visible inside the customer's environment. That makes stage-level diagnosis far more practical than waiting on one aggregated latency number.
Separate the stages or you'll miss the bottleneck
A financial feed can spend most of its time in extraction. A healthcare dashboard may be delayed by transformation logic. An e-commerce inventory update might be fast in the warehouse but slow in the last hop to the website. The bottleneck changes by environment, which is why a single end-to-end SLA isn't enough on its own.
The best teams add timestamps at major transformation points and monitor each stage separately. That makes it easier to assign ownership too. Platform engineers can own extraction and loading, analytics engineers can own transformation, and BI or app teams can own consumption timing.
A practical implementation pattern:
Measure the stage that failed, not just the dataset that suffered.
Add timestamps at handoff points: source, staging, transform, and final publish.
Set stage-level SLAs: each major handoff should have its own expectation.
Investigate localized degradation: a single slow stage often explains the whole delay.
Establish baselines before optimizing: you can't improve what you haven't measured.
Use in-database execution where possible: keep diagnosis close to the data.
This metric gives the monitoring stack its diagnostic backbone. Without it, the team knows something is late. With it, the team knows where.
Data Timeliness Trending and Anomaly Detection
Point-in-time checks are useful, but they don't tell you whether timing behavior is getting better or worse. Trending does. It shows whether delivery patterns are stable, drifting, or becoming erratic, and anomaly detection highlights when the current behavior breaks from what the system has learned over time.
That matters because not every delay is a failure and not every change is harmful. A product launch, a deployment, or a source-volume spike can all shift timing patterns. The question is whether the new pattern is expected, explainable, and safe. digna's AI-driven baseline learning and Data Analytics module are built for that type of continuous comparison without manual rule setup.
Use trends to spot the next problem before it becomes visible
A bank may see transaction latency creep upward gradually as infrastructure pressure grows. A healthcare team may notice lab result availability become more volatile after a workflow change. A telecom provider may see delivery patterns shift after a product launch. A public sector agency may catch timing anomalies before they become obvious data-quality incidents.
The strength of trending is that it turns timing into evidence. Rather than waiting for a missed SLA, the team can review how the pattern changed, whether it lines up with a known event, and whether it looks like a one-off or a sustained shift. That's a better basis for prioritizing root-cause work than a single late alert.
A practical operating loop looks like this:
Visualize trends beside key events: deployments and launches often explain timing shifts.
Review anomalies on a regular cadence: monthly review works well for root-cause learning.
Pair timing with schema tracking: structure changes can alter delivery behavior.
Investigate repeated deviations quickly: patterns that keep breaking baseline deserve priority.
Monitor timeliness alongside validation: a dataset can be on time and still be wrong.
Timeliness monitoring becomes proactive. Instead of detecting only late data, the team learns which timing patterns are healthy and which ones are about to turn into incidents.
Table of Contents
8-Point Data Timeliness Comparison
Metric | 🔄 Implementation complexity | ⚡ Resource requirements | 📊 Expected outcomes | Ideal use cases | ⭐ Key advantages & 💡 Tips |
|---|---|---|---|---|---|
Service Level Agreement (SLA) Compliance Tracking | Medium, requires SLA definitions & scheduler integration | Medium, schedule integration, historical baselines, alerting | Percentage on-time deliveries, real-time breach alerts | Regulatory reporting, contractual SLAs, recurring reports | Clear accountability, stakeholder-friendly metrics; 💡 Define SLAs from downstream needs, include buffers |
Data Freshness Metrics (Age of Data) | Low–Medium, needs reliable timestamps and measurement logic | Medium, clock sync, ingestion/event-time support, monitoring | Visibility into data currency, stale-data detection, prioritization | Real-time dashboards, trading, clinical monitoring | Direct impact on decision quality; 💡 Distinguish event vs ingestion time and monitor per domain |
Expected Delivery Time (EDT) Estimation | High, ML models, continuous recalibration | High, weeks of historical data, ML compute, accurate metadata | Adaptive delivery windows, fewer false alerts, smarter anomalies | Variable pipelines, high-volume retail/telecom, dynamic schedules | Reduces false positives and adapts to patterns; 💡 Require 4–8 weeks history and monitor confidence intervals |
Missing Data Load Detection | Low–Medium, pattern/schedule learning and alerting | Low–Medium, schedule metadata, simple detection logic | Immediate alerts for absent loads, prevents silent failures | Batch feeds, nightly loads, mission‑critical daily feeds | Prevents unnoticed pipeline outages; 💡 Configure severities and maintain runbooks for common scenarios |
Early Delivery Detection and Alerts | Low, compare arrivals against expected windows | Low, threshold config, simple anomaly checks | Flags unexpectedly early arrivals to avoid sequencing issues | Financial close, batch job sequencing, regulated workflows | Catches scheduling or process regressions; 💡 Document valid early cases and tune thresholds to reduce noise |
Load Completion Time Windows & Variability | Medium, statistical measures and trend analysis | Medium, historical timing data, analytics tools | Mean/variance, percentiles, volatility trends for planning | Capacity planning, performance regression detection | Reveals instability and supports capacity decisions; 💡 Monitor coefficient of variation and correlate with volume changes |
End-to-End Latency Tracking Across Pipeline Stages | High, instrumentation across heterogeneous stages | High, timestamps at each stage, cross-team coordination | Stage-level bottleneck identification, targeted optimizations | Complex ETL pipelines, multi-stage processing, performance tuning | Pinpoints where to optimize for max impact; 💡 Add timestamps at key stages and ensure clock sync |
Data Timeliness Trending & Anomaly Detection | High, AI baselining and continuous anomaly detection | High, substantial historical data, ML/analytics platform | Early detection of emerging issues, trend insights, fewer false alarms | Large-scale observability, proactive monitoring, evolving pipelines | Adaptive baselines and automated alerts; 💡 Review anomalies regularly and combine with schema/context tracking |
Turn Timeliness Metrics Into an Operating Model
Eight timeliness metrics only matter if they work together as one operating model. The sequence is practical. Define the business delivery requirement first, then measure freshness and SLA compliance, learn expected delivery behavior, detect missing and early loads, watch variability, break down end-to-end latency by stage, and use trending plus anomaly detection to decide what deserves root-cause attention.
The cleanest implementations keep the control loop close to the data. Start with the most critical datasets, assign owners, add timestamps at meaningful handoffs, and set alert severity based on business impact. Then build runbooks for missing loads, early arrivals, and delayed batches so people know what to do the moment the alert fires. Validation and schema tracking belong in the same workflow, because timing problems often show up alongside structure changes or record-level issues. Maintenance windows and review cadence also need explicit ownership, or teams end up treating every deviation as an incident.
A compact rollout checklist looks like this:
Dataset criticality: decide which tables, files, and feeds deserve first attention.
Timestamps: record event, ingestion, and processing times where they matter.
Owners: assign one accountable person or team per dataset.
Alert severity: match the alert to the downstream business impact.
Maintenance windows: suppress noise only when change is expected.
Runbooks: document missing-load, early-arrival, and delay procedures.
Validation: confirm the records are not only on time, but also correct.
Schema tracking: watch for structural changes that affect timing or consumption.
Review cadence: inspect trends regularly, not only after incidents.
digna can support that progression well because the Timeliness module covers expected delivery behavior, while Data Anomalies, Data Analytics, Schema Tracker, and Data Validation extend the operating model into adjacent controls. Since it runs in-database inside the customer's environment, teams can keep data in place while measuring what matters. That's a practical path from isolated alerts to a reliable timing control system.
The main takeaway is simple. Data timeliness is not one number, it's an evidence-based operating signal tied to business impact, and teams that treat it that way catch stale, late, missing, early, and unstable data before those issues reach the people making decisions.
If you're building a timeliness program and want the checks to stay close to your data, digna provides in-database monitoring for timeliness, anomalies, validation, schema changes, and analytics inside your own environment. Visit the platform to see how those modules fit together for datasets that need to arrive on time and stay usable.
Frequently asked questions
Why can a clean pipeline run still fail the business?
Because a job can succeed while the business still loses. A pipeline can finish cleanly and leave a dashboard wrong, a report stale, or a downstream model waiting on information that never arrived.
What is the first line of defence in Timeliness monitoring?
A service-level agreement, because it turns a vague expectation into a business commitment. SLA compliance tracking compares actual delivery against the agreed window and makes the gap visible to everyone who depends on the data.
Where should the SLA target come from?
From the downstream process, not from an arbitrary clock time. Set it against reporting deadlines, controls or job sequencing, such as a finance team needing transaction data by a morning cutoff or a healthcare group needing records before a shift change.
How do you avoid constant false alarms?
Leave room for infrastructure noise. If a pipeline has normal variation, the SLA should reflect that reality rather than forcing alerts every time an ordinary fluctuation crosses a line nobody calibrated.
What does learned delivery prediction add?
Expected delivery times rather than fixed thresholds. digna's Timeliness module uses AI-learned patterns to estimate when data should arrive, then flags both delays and early arrivals against the agreed SLA inside the customer's environment.


