Self Service Analytics: A Complete Guide for 2026
|
6
min read
Most advice about self service analytics starts with the wrong problem. It treats the hard part as the interface, then assumes drag-and-drop dashboards will somehow produce trustworthy decisions on their own. In regulated enterprises, that's backward. The constraint is whether the organization has a governed semantic layer, reliable metadata, access controls, and data quality checks strong enough to let nontechnical users move quickly without breaking reporting logic or compliance.
The category became mainstream because business users wanted to ask questions without waiting on central teams, and modern platforms now make that easier with natural-language querying, visual exploration, and automated preparation. But the historical shift from IT-owned reporting to line-of-business analysis only works when the data environment is curated, not when users are dropped into raw tables and told to figure it out.
Table of Contents
Why Most Self Service Analytics Initiatives Fail
The most common failure mode is simple. Teams buy a BI tool, point it at shared data, and call that self service analytics. The first month looks promising because people can click around and build dashboards. The second month exposes the core problem: metric drift starts, business logic forks by team, and no one trusts the numbers anymore.
A tool does not create shared meaning. A governed semantic layer does. Without it, one finance dashboard calculates revenue one way, a regional sales team calculates it another way, and leadership gets two versions of the same answer. That's where self-service breaks, not in the UI, but in the absence of a common definition layer.
The interface is the easy part
Drag-and-drop design lowers the skill barrier, but it also lowers the barrier to inconsistency if governance is weak. Users can create dashboards faster than analysts can review them, which sounds efficient until the catalog fills with duplicated datasets and similar-looking reports that answer different business questions. The result is dashboard sprawl, not autonomy.
Practical rule: if a business user can build it faster than a data steward can name it, approve it, and classify it, the organization doesn't have self service analytics yet. It has uncontrolled reporting.
The other hidden failure is access. When users query raw production tables, every field becomes a potential policy problem, and every query becomes a support issue. That's why modern enterprise deployments separate presentation from storage and put policy enforcement between them. The point isn't to restrict users. It's to keep them from accidentally building on data they shouldn't see, or using a metric that no one can reproduce later.
Core Components of Self Service Analytics Architecture
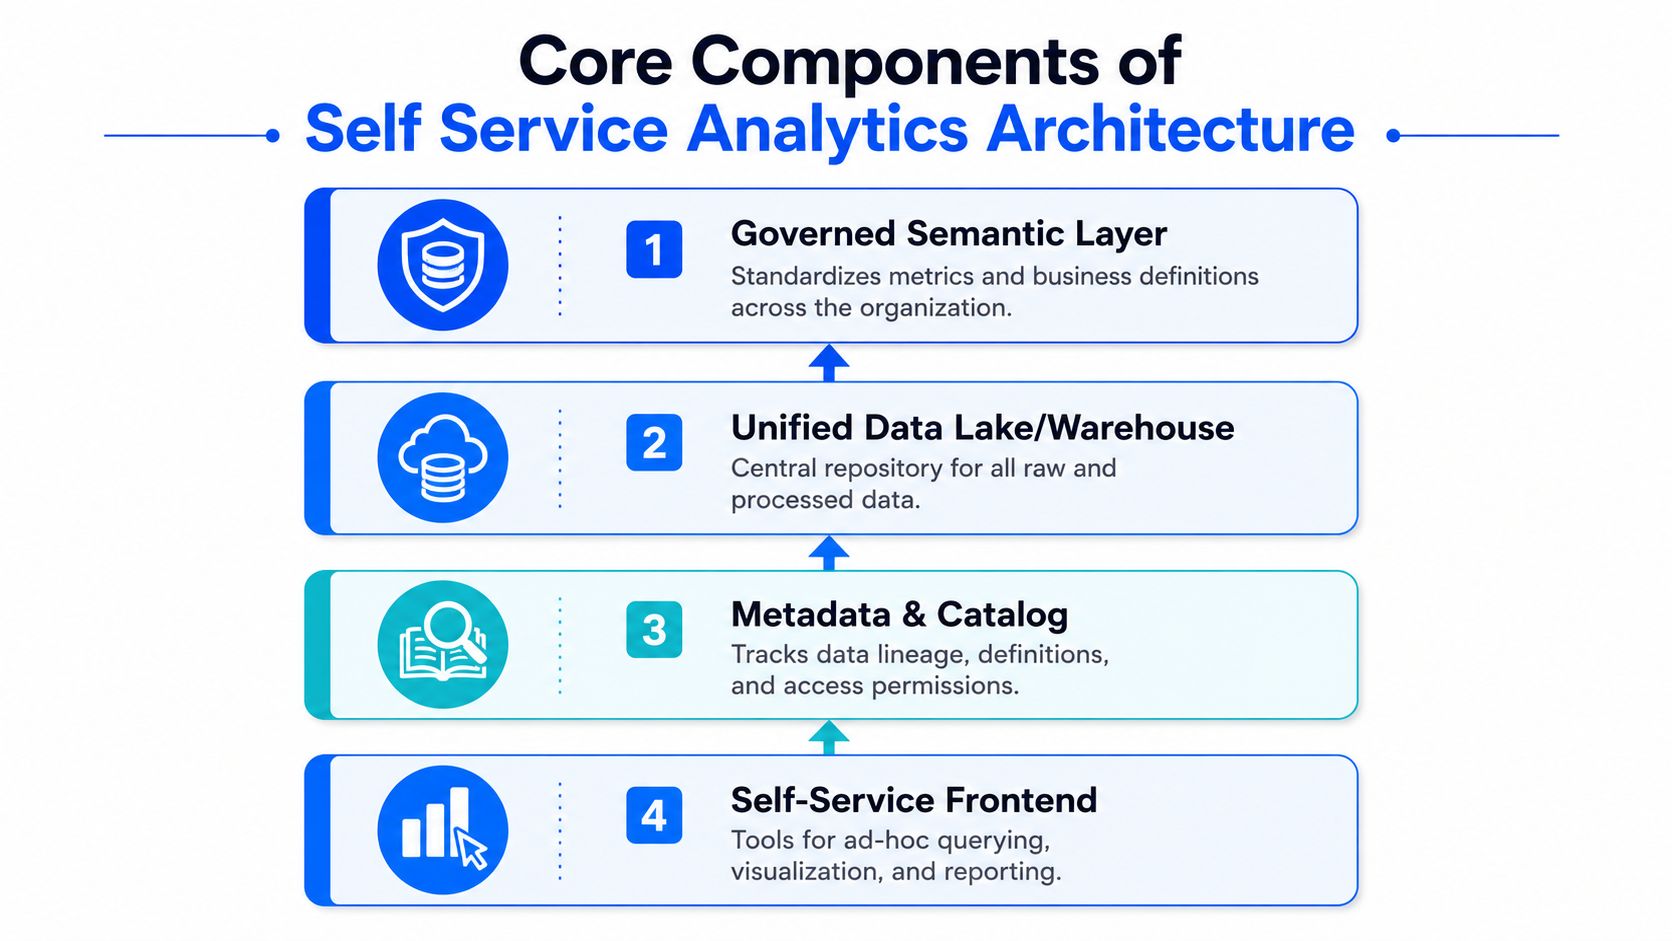
A working enterprise architecture needs four layers that each solve a different problem. The stack isn't complicated because of fashion, it's complicated because each layer removes a specific failure mode. The goal is to let users move independently while the platform keeps meaning, security, and performance intact.
Governed meaning before broad access
The governed semantic layer is the part that many organizations postpone, and it's usually the reason adoption gets messy later. It standardizes business definitions so a KPI means the same thing across departments, even if the visualizations differ. That matters more than any front-end polish, because users can tolerate a slightly clunky interface, but they won't tolerate arguments over what a metric means.
A catalog and metadata layer comes next because users can't discover what they can't find. Good metadata tells them who owns a dataset, how fresh it is, what it contains, and where the lineage runs. In practice, that turns data discovery from a hunt into a selection process, which is why platforms and data teams keep pushing for business glossaries and searchable catalogs rather than more ad hoc spreadsheets.
The access control layer is where governance becomes real instead of aspirational. Role-based permissions, dataset-specific access, and request workflows for restricted data keep self-service from turning into uncontrolled exposure. That's especially important in finance, healthcare, telecom, and public-sector environments where auditability is part of the operating model.
Performance isolation matters more than people think
The last layer is self-provisioned compute, or some equivalent way to isolate ad hoc work from shared production workloads. Without quotas or sandboxed compute, a few exploratory joins can slow down the warehouse for everyone else. That doesn't just hurt performance, it destroys confidence in the platform.
A strong reference point for data discovery workflows is data discovery in governed enterprise environments, because the same discipline that helps users find datasets also helps them avoid misusing them. Teams evaluating delivery partners can also compare how Bidwell data analysis offerings approach governed analytics work, especially when the organization needs both business usability and platform discipline.
A platform that exposes raw tables and calls it empowerment is saving setup time at the cost of future trust.
Governance Models That Balance Speed and Control
Governance isn't one model. It's a set of trade-offs between consistency, autonomy, and operating overhead. The wrong approach is usually the one that sounds simplest in a slide deck. Centralized control is safe, federated governance is practical, and fully decentralized setups are fast only until the first dispute over a KPI definition or access policy.
Three models, three different risks
Centralized control works when compliance pressure is high and user populations are small. Every request flows through a central data team, which gives you consistency and tight review, but it also creates a queue. That model protects definitions, yet it slows the business down, and it can make self-service feel like a branding exercise rather than an actual operating change.
Federated governance is the model most regulated enterprises end up with because it splits responsibility in a useful way. Central teams standardize core metrics, access rules, and quality thresholds. Domain teams build reports and visualizations within those guardrails. That keeps autonomy high enough for teams to move, while preserving the enterprise standards that leadership and auditors need.
Decentralized and democratic governance gives teams the most freedom. It can work in small, low-risk environments with highly aligned users, but it's fragile at enterprise scale. Definitions drift, duplicate logic spreads, and no one can tell which dashboard is authoritative. If the organization already struggles with metric consistency, this model makes the problem worse.
Model | Strength | Weakness | Best fit |
|---|---|---|---|
Centralized control | Maximum consistency | Slowest approvals | Highly regulated, narrow use cases |
Federated governance | Balanced autonomy and standards | Requires disciplined stewardship | Large enterprises with multiple domains |
Decentralized and democratic | Fastest local experimentation | Highest risk of metric drift | Small teams, lower compliance pressure |
Turning policy into operating rules
Good governance checklists are concrete. A catalog should show ownership, update frequency, quality notes, and business definitions for key fields. Access procedures should spell out who can see what, how to request restricted data, and what privacy or compliance checks apply before approval. Validation rules should be visible to the people who use the data, not hidden in a ticketing system somewhere.
That's why data governance strategy has to be designed as an operating model, not a policy document. If the rules aren't embedded into everyday analysis, users create workarounds. Once that happens, governance starts to exist only on paper.
The best federated setups don't try to eliminate local variation. They keep the core metrics stable and let teams adapt the presentation layer to their own questions. That's the balance that preserves speed without letting reporting fragment into competing versions of the truth.
Data Quality and Observability Requirements
Self-service fails when data quality is invisible. A dashboard can look fine while the underlying load is stale, a schema changes without notice, or a record-level rule breaks in a way that only affects one downstream team. The users don't see the root cause, they only see that the report stopped matching reality.
What needs to be monitored
The first gate is ingestion monitoring. If data arrives late, incomplete, or in the wrong format, downstream analysis inherits the problem immediately. The second gate is schema and lineage tracking, because column additions, type changes, and upstream transformations can invalidate dashboards without warning. The third is anomaly detection, which helps surface statistical breaks that simple thresholds miss. The fourth is a quality dashboard that makes freshness, accuracy, and coverage visible to both engineers and business stakeholders.
These checks matter most in enterprises that can't just ship sensitive data into a vendor environment for inspection. In-database execution keeps the analysis inside customer-controlled systems, which is the right fit when privacy, residency, or compliance constraints are tight. It also reduces the amount of specialist effort needed for routine monitoring, because the platform can watch the data where it already lives.
A practical monitoring sequence
Check freshness first. Late loads create stale reports before anyone notices. If timeliness isn't visible, business users assume the dashboard is current when it isn't.
Track structural changes next. Schema tracking catches renamed or removed fields before a BI layer breaks.
Watch for outliers and drift. Anomalies in volume, distribution, or business rules often show up before humans spot them in a dashboard.
Expose the results in a shared view. Quality dashboards make it obvious which datasets are stable enough for self-service and which ones need attention.
Rule of thumb: data quality for self-service is not a back-office task. It is the control plane for every report, model, and decision that depends on shared data.
The strongest observability programs don't flood teams with alerts. They reduce noise by learning baseline behavior and surfacing the exceptions that matter. That's the difference between monitoring as theater and monitoring as an operational safeguard.
Enterprise Use Cases Across Regulated Industries
A social insurance provider is a useful example of what changes when governance is engineered properly. The team moved away from maintaining 9,000 hand-crafted data quality rules and shifted toward AI-driven anomaly detection, which reduced daily alerts from 140+ to actionable signals. The exact lesson isn't about the alert count alone. It's that rule maintenance stopped dominating the quality workflow, so engineers could spend time on the failures that changed outcomes.
That pattern shows up across regulated sectors. In healthcare, timeliness monitoring catches late data loads before patient care dashboards turn stale. In telecom, schema tracking protects billing analytics from upstream changes that would otherwise cascade into broken reports. In finance and the public sector, the need is broader, because reproducible reporting and auditability matter as much as user convenience.
For teams that need structured educational pathways around these operating changes, pursue an MBA in operations and supply can help professionals understand process control, though the analytics work itself still depends on solid platform design and governance discipline.
What these deployments have in common
The organizations that make self-service stick don't treat every dataset the same way. They separate high-trust, standard metrics from experimental work. They also assign ownership clearly, so analysts know who curates the semantic layer, who approves access, and who responds when a data issue appears.
The important part is not that each industry has different charts. It's that each one has different tolerance for error. A billing dashboard, a patient dashboard, and a public-benefits report all need independent controls, even if they sit on the same platform.
Implementation Roadmap and Success Metrics
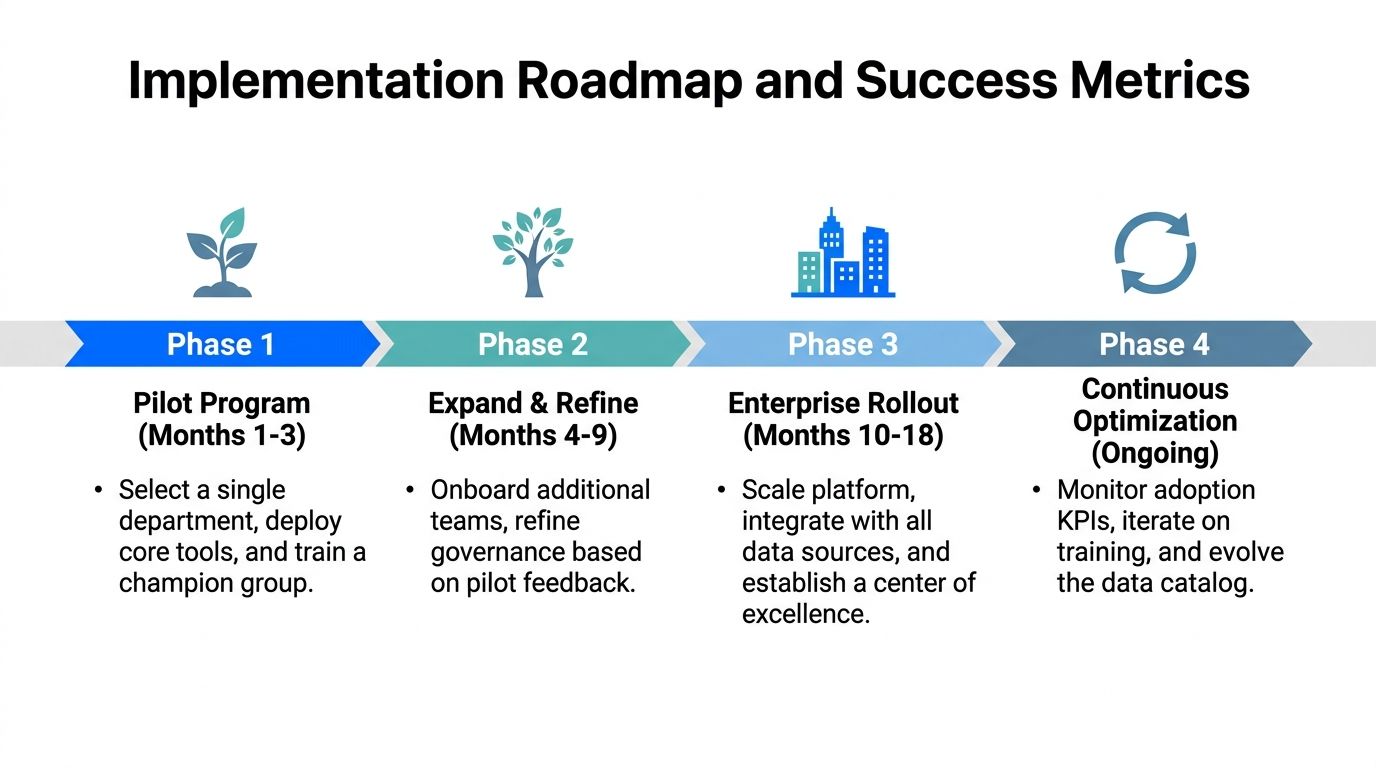
The cleanest rollout path is the one that stays small long enough to prove the model. Start with a pilot team that has real business pressure but limited blast radius, then expand only after definitions, access, and quality checks hold up under daily use. If the pilot grows too quickly, governance gets diluted before the process is stable.
Measure the rollout like an operating program
The right metrics are operational, not cosmetic. Time-to-insight tells you whether users are moving faster. Data team workload shows whether analysts are being pulled into fewer repetitive requests. Dashboard adoption indicates whether the business trusts the platform enough to use it. Data quality incident frequency shows whether the environment is getting safer or just busier.
Those measures work best when they're tracked together. If time-to-insight improves but incident frequency rises, the organization may be moving fast at the cost of trust. If adoption is low and workload never drops, the platform may be useful but not embedded in day-to-day work. The point is to watch for balance, not just speed.
Common rollout mistakes
Expanding the pilot too early: Teams often add more departments before the semantic layer and governance rules are stable.
Undertraining users: A self-service platform without onboarding just shifts confusion from the data team to the business user.
Ignoring maintenance work: Glossaries, permissions, and quality checks need ongoing ownership, not a one-time launch.
Treating dashboards as the product: The product is the operating model that keeps dashboards trustworthy.
The best programs evolve into a center of excellence that curates shared definitions, supports domain teams, and keeps the catalog healthy. That's what turns self-service analytics from a tool rollout into a durable capability.
Tool Selection Checklist and Deployment Strategy
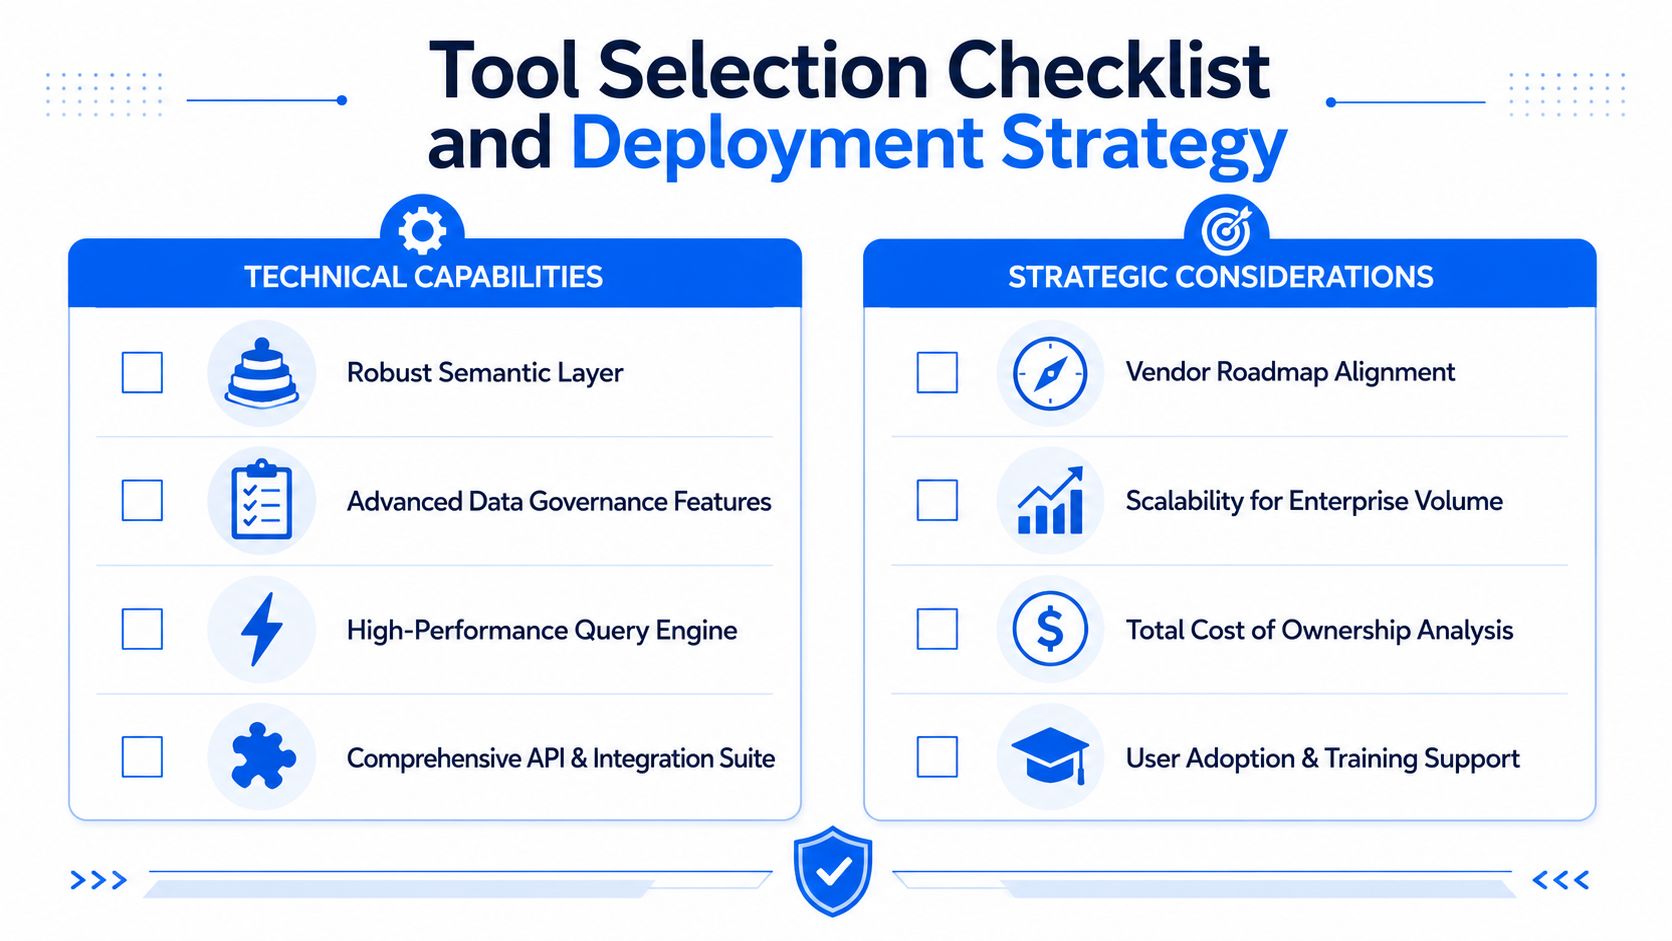
Tool selection should start with architecture, not screenshots. A polished interface is useful, but it won't compensate for weak semantic support, poor governance automation, or a platform that can't fit your security model. Enterprise buyers should evaluate tools the same way they evaluate infrastructure, by asking what breaks under real usage.
What to check before you buy
Strong semantic layer support. Verify that business definitions can be centralized and reused across teams.
Data governance features. Confirm that role-based access, approvals, and policy enforcement are built in.
Observability integration. Make sure quality, freshness, and schema tracking can connect to the analytics workflow.
Deployment flexibility. Private cloud, on-prem, or customer-controlled environments matter when data residency is a constraint.
API and integration depth. The platform should fit into existing warehouses, catalogs, and pipeline tools.
Scalability for enterprise volume. Pilot success doesn't mean the platform can survive broad adoption.
Training and adoption support. Business users need enablement, not just access.
Total cost of ownership. Hidden costs usually show up in governance overhead and support burden, not the license line.
A good deployment strategy is staged. Run the new platform in parallel with the current reporting stack long enough to validate output and catch gaps. Bring users on in waves, starting with the group that will benefit most and can tolerate some process change. Keep the old path available until the new workflow is trusted.
The most important check is whether the tool helps the organization enforce consistent meaning without slowing users to a crawl. If it can't do that, it won't matter how good the demo looked.
If you're building self-service analytics for a regulated enterprise, digna can help you put the quality and observability layer in place without exposing sensitive data to a third-party environment. Visit digna to see how in-database anomaly detection, timeliness monitoring, schema tracking, and validation support trustworthy analytics at scale.