10 Alternatives to Splunk for Observability in 2026
|
9
min read

Splunk is often treated like the default answer, but replacing it with another log platform is usually the wrong starting point. The question is what problem your team is trying to solve, because full-stack observability, economical log aggregation, security operations, cloud alignment, and in-database data reliability point to very different architectures. That's why the alternatives to Splunk below are grouped by how they work, not by a generic feature checklist.
The market already reflects that spread. Security and log-management buyers are comparing cloud-native SIEM, open-source stacks, and legacy platforms rather than one obvious successor, and many alternatives remain below 5% share individually, which makes deployment model, pricing exposure, and integration breadth the decision drivers, not brand familiarity alone. Splunk also sits at the center of the log-to-SIEM evolution, while many teams now prefer modular observability stacks, lower-infrastructure logging, or SaaS platforms that reduce operational lift. For teams whose issue is unreliable warehouse or pipeline data rather than machine telemetry, digna fits as a complementary data observability layer for anomalies, timeliness, validation, schema changes, and platform behavior inside their own infrastructure, not as a log replacement. For context on telemetry-driven reconstruction in modern systems, see the autonomous AI agent logging guide.
Table of Contents
1. Elastic Observability
Where Elastic solves the problem
2. Datadog Log Management and Observability
Why Datadog fits cloud-standardized teams
3. Sumo Logic
Cost control is the main reason to look here
4. New Relic
The pricing model changes the buying discussion
5. Dynatrace
Dynatrace shifts effort from triage to automation
6. Grafana Loki and Grafana Cloud Logs
Why label design matters more than people expect
Where digna fits beside Loki
7. Graylog
Graylog rewards buyers who know their deployment boundary
8. CrowdStrike Falcon LogScale
Security teams care about search latency and retention
9. Microsoft Sentinel
Azure alignment is the reason to choose it
10. Devo Security Data Platform
Devo is a security platform, not a broad observability suite
Top 10 Splunk Alternatives: Feature Comparison
Choose the Architecture That Fits the Problem
1. Elastic Observability
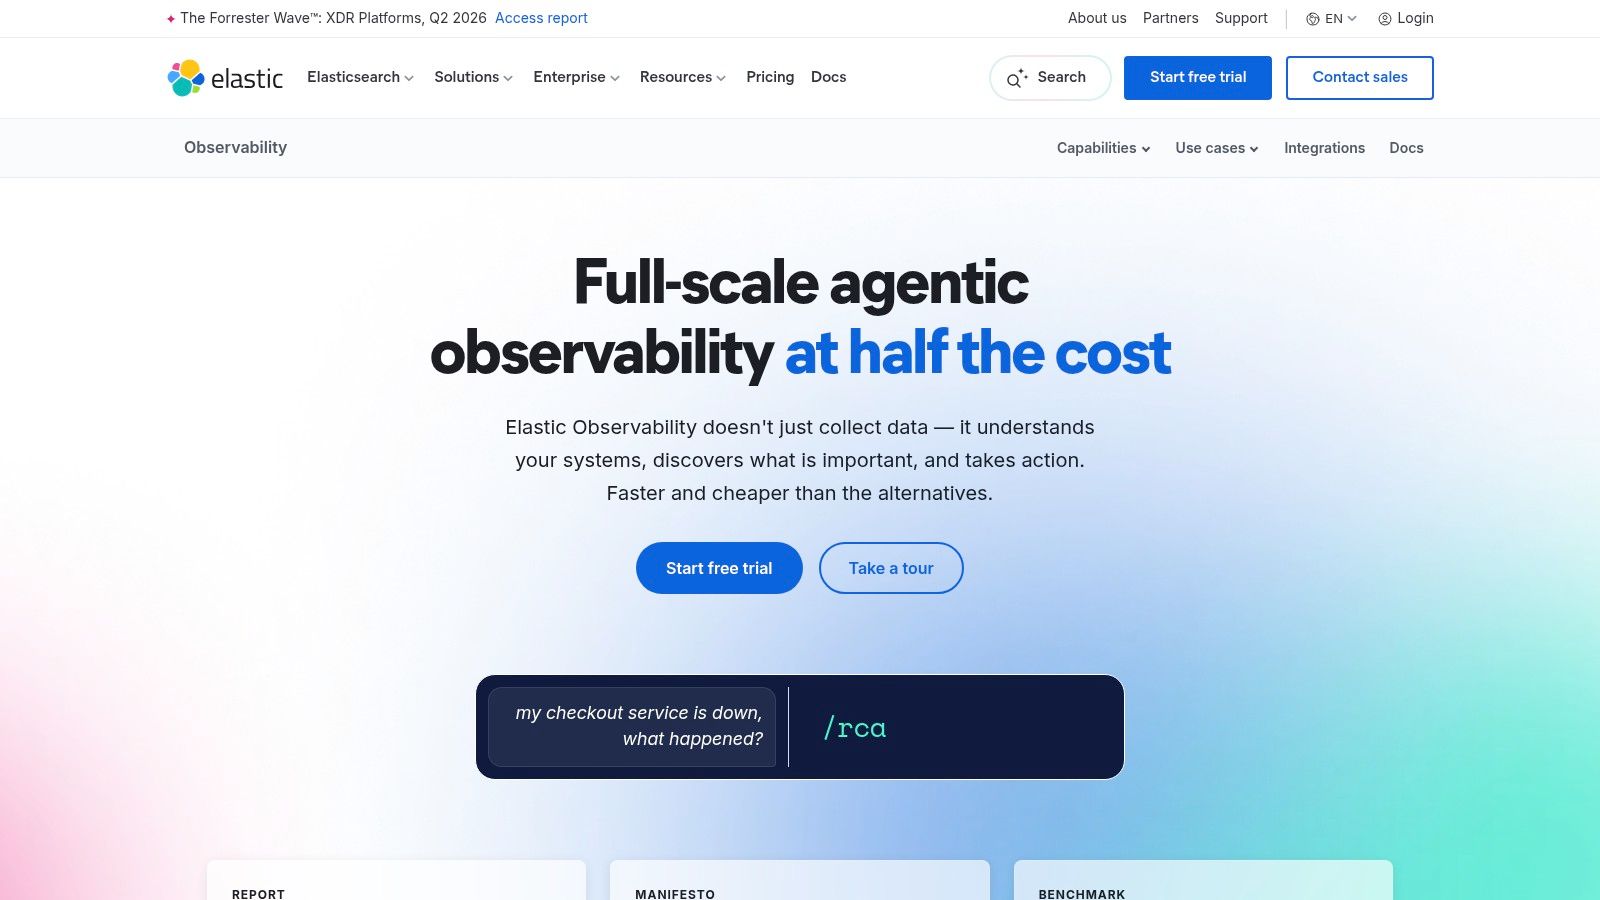
Elastic is the clearest choice when your team wants search-first investigation with control over deployment. Its observability stack brings logs, metrics, and traces together, and its query layers, including Lucene, KQL, and ES|QL, make it a natural fit for analysts who already think in search terms. The platform also gives you a real choice in operating model, since you can run it self-managed, use Elastic Cloud, or go serverless for observability.
Where Elastic solves the problem
Elastic is strongest when the operational problem is deep search across high-volume data. Rich dashboards and machine-learning powered anomaly detection support investigation, but the bigger architectural win is lifecycle control. Data tiering lets teams shape retention around cost and relevance, which matters when old logs are still useful but shouldn't sit on the hottest storage forever.
Practical rule: choose Elastic when your team can tolerate platform ownership in exchange for deployment flexibility and search depth.
The trade-off is operational burden. Self-managed clusters need tuning, capacity planning, and ongoing health management, so the platform rewards teams with platform engineers rather than teams looking for a turn-key SaaS. Elastic's own observability page is the right place to validate current product scope and packaging before you commit. Elastic Observability
The same architecture also explains why Elastic often appears in replacement conversations alongside other open or modular stacks. If your current Splunk usage is driven by investigation workflows more than strict SIEM packaging, Elastic is one of the few alternatives that can preserve that search-driven style without forcing a pure SaaS model. For teams exploring a broader data-observability layer alongside logs, the internal digna data observability page shows how in-database monitoring complements, rather than replaces, telemetry tooling.
2. Datadog Log Management and Observability
Datadog solves a different problem. It reduces context switching for teams that want logs, metrics, APM, RUM, synthetics, and security signals in a managed cloud service. The value proposition is less about raw search control and more about connecting operational signals quickly, so incident responders can move from log lines to service health without rebuilding a monitoring stack from scratch.
Why Datadog fits cloud-standardized teams
Datadog's adoption profile makes sense in light of broader market behavior. The log-management dataset cited earlier shows Datadog at 61.08% among observed installations, which is a strong indicator that many teams prefer SaaS observability when they're standardizing on cloud operations. That doesn't make it a universal Splunk replacement, but it does show why Datadog is often the default alternative in fast-moving organizations.
Its strength is integration density. Teams get mature alerting and collaborative triage workflows, plus flexible pipelines for processing, sampling, and rehydrating archives. The limitation is cost complexity. Once you spread usage across multiple modules and log indexing, forecasting becomes harder than the marketing material suggests, especially if your environment produces noisy logs or uses multiple squads with different retention habits. Review the platform's current packaging on the Datadog pricing page before you model an exit from Splunk.
Datadog works best when a central platform team wants one managed system to absorb operational correlation, not when the business wants a tightly bounded, self-hosted logging footprint.
For teams evaluating a data-quality layer alongside observability, the complementary pattern is important. An application observability suite can tell you what the service is doing, while a product like digna data observability tools focuses on whether the data inside the warehouse or pipeline is behaving correctly.
3. Sumo Logic
Sumo Logic is most compelling when the problem is cloud-native log analytics plus SIEM discipline under one SaaS roof. It's built for teams that want retention controls, security analytics, and ingestion management without taking on the burden of running a heavy log platform themselves. The presence of data tiering, including hot and cold storage, shows that the product is designed around cost control rather than unlimited data hoarding.
Cost control is the main reason to look here
Sumo Logic's pricing model is explicitly built around credits, and some plans advertise zero-dollar ingest options. That matters because it changes the conversation from “how much data can we shove in?” to “what data deserves expensive processing?” For organizations with variable cloud workloads, that framing can be healthier than a simple per-GB ingest model.
The trade-off is that the stronger SIEM capabilities tend to live higher in the pricing stack, so the platform can feel inexpensive during early evaluation and materially more expensive once security teams want deeper coverage. Sumo also remains primarily SaaS, so buyers looking for on-prem control should treat it as a cloud-first operational decision, not a universal replacement for Splunk Enterprise. The vendor's current packaging belongs on the Sumo Logic pricing page.
The broader observability point is architectural. Open-source and managed buyers often combine logging with other telemetry sources rather than centralizing everything into one proprietary system, and Sumo Logic sits comfortably in that mixed-stack world. If you need a separate layer for data reliability, the digna monitoring reporting page is closer to that job than any log analytics platform.
4. New Relic
New Relic is the right comparison point when your team wants one SaaS telemetry model instead of a collection of stitched tools. Logs are treated as first-class data, but they're strongest when paired with APM, infrastructure telemetry, errors, and traces. That reduces the operational overhead of correlating symptoms across separate systems, which is exactly where many Splunk deployments become cumbersome.
The pricing model changes the buying discussion
New Relic's pricing is easier to reason about than ingest-only logging when teams want predictable access across users and services. The product's public pricing model emphasizes transparency, and its broader platform message is about consolidating observability rather than optimizing one logging workload in isolation. That matters for teams that don't just want search, they want incident workflows and developer-friendly quickstarts.
The limitation is straightforward. If your current Splunk estate is tightly tied to SIEM, compliance reporting, or strict on-prem control, New Relic is not the same category of replacement. It's better thought of as a full-stack observability consolidation layer, especially for engineering-led organizations that care about feedback loops during incidents. Validate the current commercial structure on the New Relic pricing page.
The market data supports why this model keeps winning attention. The CNCF microsurvey found Prometheus used by 86% of respondents, OpenTelemetry by 49%, and Fluentd by 46%, which points to a modular telemetry culture rather than a single monolithic platform. New Relic's appeal is that it absorbs that modularity into one service experience instead of forcing teams to assemble every layer themselves.
5. Dynatrace
Dynatrace is built for teams that want automatic correlation more than manual query crafting. Its log management and analytics sit on Grail, which is designed for context-rich queries and automation, and the platform automatically correlates logs with topology, traces, and metrics. That makes it a strong fit for enterprises that care about root cause analysis and governance, not just storage and search.
Dynatrace shifts effort from triage to automation
The operational advantage is the amount of context the platform assembles for you. If your incident process spends too much time stitching together logs, service maps, and performance signals, Dynatrace reduces that overhead by making topology part of the analysis experience. Its DQL query layer and AI-assisted analytics also help analysts move faster once they're inside the platform.
The downside is cost and consolidation risk. Dynatrace sits in the premium end of the market, and once teams bring many observability functions into one place, leaving later becomes more painful. That doesn't make it a bad product, but it does mean procurement should treat consolidation benefits as part of the value equation. Check the vendor's current commercial framing on the Dynatrace pricing page.
Dynatrace is strongest where the organization wants the platform to infer relationships, not where engineers want to build those relationships by hand.
That distinction matters. Some teams want the observability system to be a diagnostic assistant. Others want a search engine and prefer to own the investigation logic themselves. Dynatrace clearly serves the first group. For data teams dealing with broken freshness, schema drift, or validation failures, a separate product such as digna is more relevant because it monitors data behavior in place rather than trying to be the whole telemetry stack.
6. Grafana Loki and Grafana Cloud Logs
Loki is the right answer when a team wants economical log aggregation and already lives in the Grafana ecosystem. Its label-indexed architecture stores raw log content in object storage and indexes labels rather than every line, which lowers infrastructure and storage overhead compared with full-text systems. That design is the reason Loki behaves differently from traditional log platforms, and why it can be such a strong fit for Prometheus-heavy environments.
Why label design matters more than people expect
Loki is not trying to win on free-form search depth. It expects good label strategy, and that means query quality depends heavily on how well your teams model services, environments, and dimensions up front. If the labels are sloppy, LogQL becomes harder to use and full-text search can feel slower than analysts want.
That's the trade-off for lower operating cost. Teams already using Grafana, Prometheus, and Tempo can keep their workflows aligned, and the managed Grafana Cloud Logs option removes much of the self-hosting pain while preserving the same general model. For teams that want the operational discipline of a modular stack, Loki is one of the cleanest alternatives to Splunk. See the current managed and self-managed options on the Grafana pricing page for logs.
The observability survey data reinforces why this approach resonates. Grafana's 2025 survey reported that roughly 76% of companies use open-source licensing for observability, more than two-thirds of teams use at least four observability technologies, and 46% had unified infrastructure and application observability in production in 2026. Those figures point to blended stacks, not all-in-one lock-in, which is exactly where Loki fits best.
Where digna fits beside Loki
Loki can tell you what the platform emitted. It can't tell you whether the underlying warehouse facts are late, malformed, or drifting. That's where digna observability best practices become relevant for teams that need a separate layer for data correctness and business reliability.
7. Graylog
Graylog is the pragmatic option for teams that want predictable licensing and on-prem control without entering a heavyweight enterprise SIEM negotiation. Its Open edition supports self-managed logging, search, dashboards, and alerts, while Enterprise and Cloud editions add archiving, reporting, correlation, and security features. That split gives buyers a clearer path than many vendors that hide serious functionality behind a sales process from day one.
Graylog rewards buyers who know their deployment boundary
Graylog is most attractive when infrastructure ownership is acceptable and budget predictability matters. Syslog, Beats, agents, pipelines, and extractors make ingestion flexible, which helps teams normalize data from mixed environments without needing a large integration project. For private environments, that's a practical advantage.
The limitation is equally clear. If you self-manage Graylog, your team owns the stack's health and scale. If you need advanced reporting or security features, you'll need the paid tiers. That makes Graylog less flashy than some alternatives, but often easier to justify when procurement wants a bounded operational commitment. Start with the vendor's current commercial structure on the Graylog pricing page.
Graylog makes sense when the question is, “How do we keep control of our logs without paying for an oversized platform?”
That framing fits a lot of regulated or private-cloud teams. It also explains why Graylog often stays in the shortlist even when larger observability vendors dominate mindshare. The value is not breadth, it's a controlled logging posture that can be expanded as needs evolve.
8. CrowdStrike Falcon LogScale
CrowdStrike Falcon LogScale is the strongest fit when the decision is driven by security operations speed. Formerly Humio, it uses an index-free architecture designed for fast ingest and search, and it slots into the broader Falcon platform for threat detection and XDR. That combination makes it much more than a generic log store, it's a security-data platform optimized for analyst workflows.
Security teams care about search latency and retention
The product's design choices are visible in the way it handles storage and querying. Efficient compression, long retention options, and flexible ingest through streams, agents, and APIs are all aimed at high-speed operational use. If your team spends time hunting across security data during incidents, those are the kinds of characteristics that matter more than marketing claims about “AI.”
The limitation is commercial and contextual. LogScale tends to deliver the most value when you already use CrowdStrike Falcon, and pricing often requires sales engagement. That means it can be a powerful fit inside a security-led ecosystem, but less appealing if you're shopping for a neutral log platform. Review the product positioning on the CrowdStrike Falcon LogScale page.
The log-management market data earlier also helps explain why products like LogScale keep traction. Alternatives are not niche, and buyers regularly compare cloud-native SIEM with open stacks and legacy platforms. If your main goal is threat hunting rather than general observability, LogScale belongs high on the list.
9. Microsoft Sentinel
Sentinel is the obvious alternative when your environment is already Azure- and Microsoft-heavy. It's cloud-native SIEM and SOAR, with analytics, hunting, playbooks, and deep integration across Defender, Entra, and Azure Monitor. The platform's strength is ecosystem alignment, which can simplify both governance and incident response if your identity and telemetry are already anchored in Microsoft services.
Azure alignment is the reason to choose it
The pricing conversation matters here because Sentinel ties costs to Log Analytics ingestion and retention. That means planning is not optional, especially when teams start routing more sources into the platform. Microsoft does provide public pricing guidance and calculators, which helps procurement, but usage discipline still matters if you want bills to stay aligned with expectations. See the current billing structure on Microsoft Sentinel billing.
Sentinel is especially useful for organizations that already rely on Defender and Azure Monitor, because the handoffs stay inside a familiar operational and identity model. That reduces friction during investigations, but it also makes the product less attractive for organizations trying to avoid cloud concentration.
If your SOC already lives in Microsoft tooling, Sentinel is a consolidation move. If not, it can turn into a platform migration in disguise.
That is the core buying tension. Sentinel is a security platform first, a general observability platform second. For teams whose biggest problem is data freshness or schema drift in analytics pipelines, a data observability product is the more precise answer. That's where digna real-time data monitoring fits, because it watches the data layer rather than the security event layer.
10. Devo Security Data Platform
Devo is built for teams that want predictable TB/day pricing and security-focused analytics at sustained scale. Its SIEM packaging includes SOAR, UEBA, case management, and hunting workflows, so the product is aimed squarely at analyst productivity. The query engine is designed for large, continuous log volumes, which is useful when the operational problem is long-running security telemetry rather than ad hoc app debugging.
Devo is a security platform, not a broad observability suite
That specialization is the point. If your organization cares most about speeding up Time-to-Detect, investigate, and respond in a security context, Devo's workflow structure is easier to map to that goal than a broad observability suite. Its schema-on-read model also makes ingestion more flexible when data sources vary.
The limitation is equally direct. Devo is primarily a security and SIEM platform, so it is not the first choice when you need wide application observability or deep developer experience. It is also SaaS-first, which can be a constraint for organizations that want private deployment control. The current product positioning belongs on the Devo Security Data Platform site.
Devo makes the most sense where security operations owns the buying decision and wants packaging clarity. If observability and SIEM need to converge, it can be a strong candidate. If the core issue is warehouse data quality, it should stay in a different lane from a purpose-built data observability layer such as digna.
Top 10 Splunk Alternatives: Feature Comparison
Platform | Core features ✨ | Quality / UX ★ | Pricing / Value 💰 | Ideal users 👥 | Top strength 🏆 |
|---|---|---|---|---|---|
Elastic Observability (Elastic Stack) | ✨ Logs, metrics, traces; ML anomaly detection; lifecycle mgmt | ★★★★☆ Mature, flexible UI; ops expertise needed | 💰 Volume-driven; data-tier controls | 👥 Enterprises wanting self-hosted control & search | 🏆 Powerful full-text search & scalability |
Datadog Log Management & Observability | ✨ SaaS logs + metrics + APM + RUM; flexible pipelines | ★★★★★ Polished UX; fast time‑to‑value | 💰 Module-based; can be complex at scale | 👥 Cloud-native teams wanting managed SaaS | 🏆 Huge integrations & collaborative triage |
Sumo Logic | ✨ Cloud-native log analytics & SIEM; data tiering | ★★★★ SaaS ease with ML-driven insights | 💰 Credit-based pricing; tiering for cost control | 👥 Security/ops teams needing cost controls | 🏆 Ingest control & ML pattern detection |
New Relic (Full-Stack) | ✨ Unified data model (logs, metrics, traces); pipelines | ★★★★ Developer-friendly, simple onboarding | 💰 User/compute pricing; public tiers & free option | 👥 Devs & platform teams wanting unified telemetry | 🏆 Integrated APM-to-logs correlation |
Dynatrace (Grail) | ✨ Auto-correlation, DQL, AI-assisted analytics | ★★★★ AI-driven RCA; enterprise automation | 💰 Premium pricing; commitment-based models | 👥 Large enterprises needing automation & governance | 🏆 Strong AI root-cause & topology mapping |
Grafana Loki / Grafana Cloud Logs | ✨ Label-indexed logs; native Grafana integration | ★★★ Lightweight UX; depends on label design | 💰 Lower infra/storage cost; self or managed | 👥 Teams using Prometheus/Grafana; cost-conscious | 🏆 Cost-efficient log storage + native dashboards |
Graylog (Open / Enterprise / Cloud) | ✨ Source-available logging; pipelines, alerts | ★★★ Familiar UI; self-managed operations | 💰 Predictable licensing; free open edition | 👥 On‑prem/private-cloud teams seeking control | 🏆 Source-available + enterprise support options |
CrowdStrike Falcon LogScale (Humio) | ✨ Index-free ingest; high compression; security integration | ★★★★ Extremely fast search & scale | 💰 Sales-based; best value with Falcon customers | 👥 Security teams / CrowdStrike customers | 🏆 Blazing search performance & compression |
Microsoft Sentinel | ✨ Azure-native SIEM/SOAR; ML analytics & playbooks | ★★★★ Integrated with Microsoft ecosystem | 💰 Pay-as-you-go or commitment; ingestion costs | 👥 Azure/M365-centric organizations | 🏆 Deep Microsoft integrations & SOAR |
Devo Security Data Platform | ✨ SIEM + SOAR + UEBA; high-speed queries & hot retention | ★★★★ Analyst-focused UX; fast analytics | 💰 Predictable TB/day pricing; hot-data model | 👥 Security ops with large sustained log volumes | 🏆 Predictable TB/day pricing & query speed |
Choose the Architecture That Fits the Problem
The cleanest way to choose among alternatives to Splunk is to start with the operational constraint, not the logo. Pick Elastic or Graylog when deployment control, data residency, or self-managed architecture matter more than convenience. Choose Grafana Loki when label-based, economical aggregation fits an existing Grafana and Prometheus environment. Go with Datadog, New Relic, or Dynatrace when managed full-stack observability and cross-signal correlation are the priority, and your team is willing to trade some deployment control for lower operational burden. Use Sumo Logic or Devo when cloud analytics, security workflows, and pricing structure are the dominant buying factors. Reach for CrowdStrike Falcon LogScale or Microsoft Sentinel when security operations and ecosystem alignment lead the decision.
The next step is to evaluate the platform the way your incident team will use it. Check ingestion volume, retention, query patterns, deployment constraints, ownership, pricing exposure, integrations, alert quality, migration effort, and exit strategy. Splunk migrations often fail when teams compare features in a demo but ignore the cost of moving saved searches, rebuilding dashboards, and reworking alert logic. A good shortlist should tell you not only how the product performs, but also what it will take to operate, extend, and eventually leave.
For teams whose central issue is unreliable warehouse or pipeline data rather than machine and application logs, digna belongs next to observability tooling, not in place of it. It runs inside the customer's own environment, monitors anomalies, timeliness, validation, schema changes, business metrics, and platform behavior, and keeps the data in place while the checks execute in-database. That makes it a practical complement when the observability problem is data reliability inside your analytics stack rather than telemetry outside it.
If your team is sorting out whether the real issue is logging, SIEM, or data reliability, digna is worth a direct look. It monitors anomalies, timeliness, validation, schema changes, business metrics, and platform behavior inside your own environment, so you can keep production data in place while you watch for drift and breakage. Visit digna to see how its in-database approach fits alongside the observability stack you already use.
Frequently asked questions
How should you approach replacing Splunk?
Not by looking for another log platform, which is usually the wrong starting point. The decision drivers are deployment model, pricing exposure and integration breadth, because the market is spread across cloud-native SIEM, open-source stacks and legacy platforms with many alternatives individually below 5% share.
When is Elastic the right choice?
When the operational problem is deep search across high-volume data and the team wants control over deployment. The trade-off is operational burden, so choose Elastic when your team can tolerate platform ownership in exchange for deployment flexibility and search depth.
When does Datadog fit better?
When a central platform team wants one managed system to absorb operational correlation, rather than a tightly bounded self-hosted logging footprint. Its strength is integration density, and one log-management dataset shows Datadog at 61.08% among observed installations, which signals how many teams prefer SaaS while standardizing on cloud.
What should you watch in Sumo Logic's pricing?
Where the SIEM capability sits. Sumo Logic's model is built around credits and some plans advertise zero-dollar ingest options, but stronger SIEM features tend to live higher in the pricing stack, so the platform can feel inexpensive during evaluation and materially more expensive once security teams want depth.
Does a log platform replace a data quality layer?
No, they solve different problems. Log and observability platforms explain how systems behaved; a data quality layer explains whether the data those systems produced is fit to use. The complementary pattern matters when teams evaluate the two budgets together.


