What Is Data Quality Management and Why It Matters
|
8
min read

You already know the feeling. The dashboard looks calm, leadership is using it in meetings, and nobody has complained. Then an upstream schema change slips through a payments pipeline, the revenue number drifts, and the mistake sits there long enough to shape decisions before anyone notices. That's the point where data quality management stops being a theory exercise and becomes a control system.
Data quality management is the continuous practice of making sure data is fit for the people and systems that consume it. In production, that means measuring, monitoring, and remediating data as it moves through pipelines, models, reports, and operational workflows. The old model of cleaning data once in a while never held up in real enterprises, especially once data started feeding analytics, automation, and regulated reporting.
Table of Contents
When Trusted Data Becomes a Liability
A CFO trusts the revenue dashboard. Finance has used it for months, the numbers tie out most days, and the report lands in the weekly operating review without controversy. Then a small upstream schema change lands in the payments pipeline, the transformation job still runs, no alert fires, and the dashboard stays wrong for three weeks until a customer complaint forces someone to look closer.
That kind of failure is exactly why data quality management exists as a discipline, not a housekeeping task. The historical arc matters here. MIT launched the Total Data Quality Management program in 1988, which helped establish a lifecycle-based approach to measuring, improving, and continuously monitoring data quality. Foundational research summarized by Harvard Business Review also reported that only 3% of companies' data met basic quality standards, based on 195 measurements across completeness, accuracy, consistency, and timeliness, and that 47% of newly created records contained at least one critical error (Integrate.io).
Those numbers explain the shift from cleanup to governance. The issue isn't that teams don't know bad data exists, it's that bad data often hides until it has already moved downstream. Modern data quality management has to operate at pipeline speed, because a stale record, a broken join, or a schema drift event can make a trusted dashboard lie without ever tripping a traditional batch audit.
Why the old model breaks
Periodic auditing works only when the business can tolerate delay. That's rarely true now. A broken feed can poison models, reporting layers, and controls long before a monthly review catches it.
Practical rule: if a dataset can influence money, risk, or patient care, quality checks belong in the pipeline, not in a spreadsheet review after the fact.
The practical line between “clean data” and managed data quality is simple. Cleanup is reactive, after the issue is visible. Management is continuous, measured, and tied to explicit consumer requirements. That's the difference between fixing a problem and preventing a silent failure.
The Six Dimensions of Data Quality
A lot of teams talk about data quality as if it's one thing. It isn't. A dataset can be acceptable for one use case and useless for another, which is why the discipline is built on multiple dimensions, not a single score. Technical guidance aligned with ISO and NPL material treats accuracy, completeness, consistency, timeliness, traceability, availability, and compliance as distinct dimensions that should be measured independently, because the same dataset may be fine for one workflow and unacceptable for another (NPL guidance).
For day-to-day engineering work, the six dimensions most teams operationalize are the ones below.
What each dimension catches
Accuracy is about whether the data reflects reality. If a join duplicates rows, a customer lifetime value calculation can look plausible while being wrong. Measure it with referential integrity checks, reconciliation, and controls that compare expected versus observed values.
Completeness is about missing information. Nulls in a segmentation field can exclude people from a campaign or leave a model blind to part of the population. Null-rate checks and required-field validation are the basic tools here.
Timeliness is whether data arrives when it's needed relative to the event it describes. A fraud model running on stale features can make a confident bad decision. Freshness SLAs, late-arrival detection, and age-based thresholds are the practical controls.
Consistency means the same entity doesn't contradict itself across systems. If CRM and billing disagree on a customer address, downstream workflows will argue with each other. Cross-source reconciliation and standardization rules catch this.
Validity checks whether values fit the expected domain, format, or rule set. After a source migration, a status field can start carrying values outside the approved enum. Domain checks and format validation handle that.
Uniqueness is about duplicate records. In healthcare, duplicate patient records fragment medical histories and make care coordination harder. Deduplication logic, unique-key checks, and identity matching are the usual defenses.
Data Quality Dimensions at a Glance | How It's Measured | Most Sensitive Use Cases |
|---|---|---|
Accuracy | Reconciliation, referential integrity, control totals | Finance, billing, executive reporting |
Completeness | Null rates, required-field checks | Segmentation, regulatory reporting, clinical workflows |
Timeliness | Freshness SLAs, arrival-age thresholds | Fraud, operations, real-time analytics |
Consistency | Cross-source comparison, standardization rules | Master data, customer operations, reporting |
Validity | Enum checks, range checks, format checks | Operational systems, compliance, automation |
Uniqueness | Duplicate detection, identity matching | Healthcare, CRM, identity resolution |
If you want a deeper breakdown of the dimension model, the practical framing on digna's dimensions of data quality is worth comparing against your own control design.
The mistake I see most often is teams building one aggregate score and calling it governance. That hides the failure mode that matters.
The right question isn't “Is the data good?” The right question is “Good for what, and measured how?”
How Data Quality Management Actually Works
Data quality management works as a lifecycle, not a gate. ISO 8000-61:2016 frames it as a Plan-Do-Check-Act loop, plan the strategy, implement the processes, monitor and measure performance against requirements, then take corrective action to keep improving (ISO 8000-61:2016). That structure matters because it turns quality into an operating rhythm instead of a one-off project.
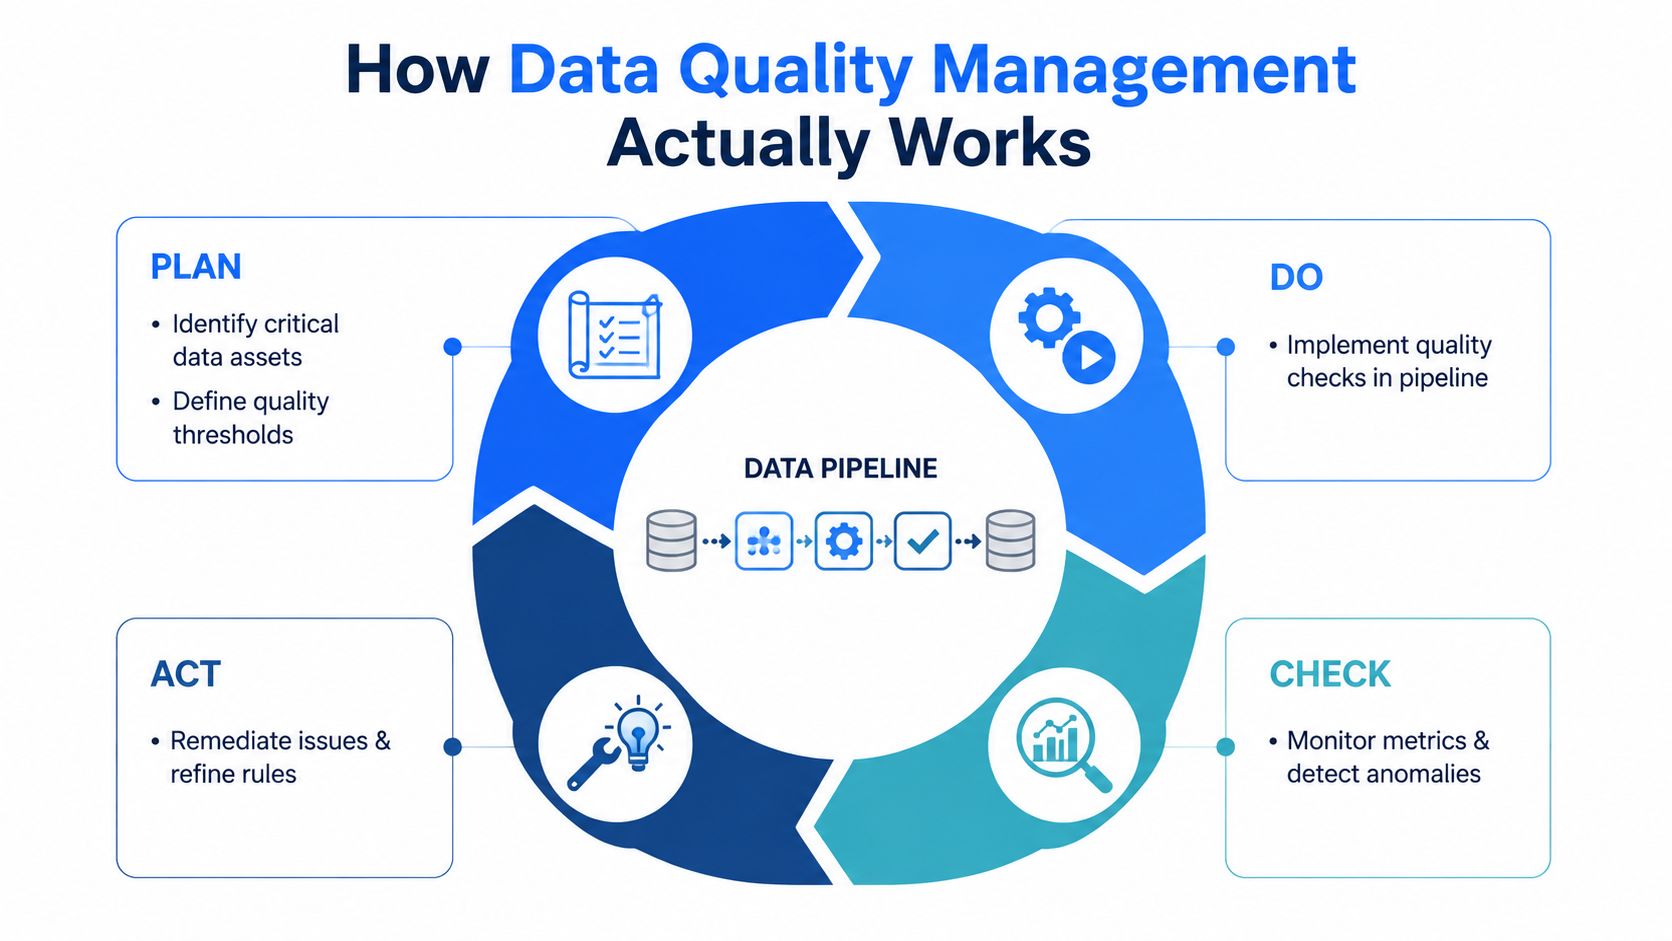
Plan, do, check, act in production
Plan starts with identifying critical assets, defining thresholds with business stakeholders, and assigning ownership. ISO 8000-150:2022 focuses on roles and responsibilities, which is the part many teams skip until an incident proves they can't afford to (ISO 8000-150:2022). Someone has to own the rule, the exception, and the correction.
Do is where validation lives. In well-run pipelines, that means schema contracts, range checks, domain checks, null checks, and transformation tests embedded directly in jobs, not bolted on afterward. A practical implementation can also follow data engineering best practices where orchestration, versioning, and testability are built into the workflow from the start.
Check is continuous monitoring. ISO guidance and implementation work both support measuring at intervals or continuously, which is critical because many defects show up as drift, delay, or structural change before they become obvious failures (ISO 8000-61:2016, MDPI implementation study). Alerts should classify severity, not just shout.
Act is remediation. Bad records can be quarantined, fixed when viable, or routed for manual review, but the key is that every exception needs a documented path and a feedback loop back into the rule set. That's how data stewards, engineers, and analysts stay aligned instead of arguing after the fact.
Operational rule: do not build a quality program that only blocks pipelines. Build one that tells the team what failed, how bad it is, and what to do next.
The platform choice matters, but the operating model matters more. A good control system catches the problem early, contains the blast radius, and leaves an audit trail.
From Static Rules to Continuous Observability
Traditional batch quality checks catch errors late. By the time a daily SQL assertion fails, downstream consumers may already have made decisions, trained models, or published dashboards on top of bad data. Recent coverage of the field points to a shift toward continuous validation, AI-augmented checks, and privacy-aware governance, because static cleanup doesn't fit live pipelines, models, and business metrics (DZone coverage).
That shift is visible in the tools teams use. Instead of hand-writing every threshold, modern observability layers learn baselines, watch for anomalies, and track schema changes automatically. They also monitor freshness so stale feeds surface as operational issues instead of business surprises.
What changes in practice
A practical observability stack usually covers three things. First, anomaly detection looks for statistical departures from baseline behavior. Second, schema tracking catches added columns, removed columns, and type changes before consumers break. Third, timeliness monitoring flags late or missing arrivals so the issue gets handled as an incident, not a mystery.
The point isn't just speed. It's context. A column can be technically present but semantically wrong, and a table can pass a generic validity check while still being too stale to trust. The observability layer gives you the signal that the old audit model never could, especially once data starts powering AI agents and automated decisions.
If you're mapping that to a product stack, the architecture write-up on digna's data observability approach is a useful reference point for how continuous checks fit into broader monitoring.
Continuous observability doesn't replace rules, it makes rules survivable at production pace.
An earlier detection win is happening. Instead of learning about a bad load after the business complains, the team sees the issue close to the moment it appears and can respond while the blast radius is still small.

Choosing the Right Architecture and Tools
A poor data quality management stack usually fails in one of two ways. Checks sit too far from the data and introduce latency, or they live so close to production systems that they create operational strain. In-database execution keeps validation near the warehouse or lakehouse, which reduces movement and fits security-sensitive environments, but it can increase compute usage. Cloud-native observability platforms centralize monitoring and managed detection, but they can raise residency and privacy concerns if the wrong data leaves the boundary.
Architecture choices and trade-offs
Data Quality Architecture Trade-Offs | Best For | Key Trade-Offs | Privacy Considerations |
|---|---|---|---|
In-database execution | Warehouses, lakehouses, regulated pipelines | Low movement, tighter integration, possible compute cost increase | Strong fit when data must stay inside customer-controlled systems |
Cloud-native observability | Teams that want managed monitoring and shared dashboards | Fast setup, centralized view, possible residency concerns | Needs careful review for PII, jurisdiction, and vendor access |
Custom frameworks | Highly specialized control requirements | Maximum flexibility, higher engineering maintenance | Can be designed for strict isolation, but ownership burden stays in-house |
Hybrid stacks | Mixed maturity environments | Balance between speed and control, more integration work | Useful when sensitive checks stay local while metadata centralizes |
The right architecture follows regulation, scale, and operating maturity. Finance, healthcare, telecom, and public sector teams usually need tighter control over where validation runs, who can see results, and how exceptions are documented. For teams that want that control inside their own environment, an overview of data system architecture trade-offs helps frame where validation, anomaly detection, timeliness monitoring, and schema tracking should execute.
A platform choice should be judged as a control layer, not just a tool purchase. If the team still has to export data to inspect it, some of the value is gone. If the platform does not integrate with orchestration, metadata, and incident workflows, it turns into another dashboard that people stop trusting. The practical test is simple, whether the checks fit the pipeline without forcing extra handoffs, extra copies, or extra manual review.
Prioritizing What Matters Most
Trying to monitor every table equally is how quality programs die. Alert fatigue starts, engineers mute notifications, and the team stops believing the system when it matters. The better pattern is to prioritize by business criticality, because the table feeding executive reporting, model inputs, or regulatory submissions deserves a different standard than a low-stakes staging dataset.
Survey evidence points to a related problem, teams often know quality matters, but they don't always know how to test data well. That makes prioritization even more important, because it forces decisions about which checks matter, where thresholds should sit, and what level of false positives is acceptable (Synq benchmark survey).
How to focus the program
Start by mapping lineage so you know the blast radius of each asset. A single broken source can affect a dashboard, a forecast, and a compliance feed, but the remediation urgency won't be identical across all three. The point is to classify the dataset by downstream impact before you decide what to monitor.
The internal planning view on critical data elements is a useful framing for that kind of triage.
Revenue and risk data: Put real-time or near-real-time checks on the fields that affect money movement, exposure, or regulatory evidence.
Model inputs: Watch freshness, schema drift, and missing values first, because stale or malformed inputs break model trust fast.
Operational datasets: Use thresholds that reflect business tolerance, not theoretical purity.
Low-impact analytics tables: Accept lighter monitoring if the downstream cost of failure is low.
If everything is critical, nothing is.
That's the practical ROI argument. A focused program spends engineering attention where the cost of failure is highest, and it leaves low-value tables on lighter surveillance without pretending that's a weakness. Governance gets stronger because it stops trying to be universal.
Building Your Data Quality Program
A program that survives contact with production needs phases. The first phase is asset inventory and baseline SLAs. The second is automated validation at ingestion and transformation boundaries. The third is anomaly detection, freshness monitoring, and cross-source reconciliation. The fourth is incident response, escalation, and continuous refinement.
The implementation guide on digna's data quality team fits that phased approach because the team model matters as much as the rules themselves. Without ownership, exceptions linger, and the same errors recur under new names.
A practical rollout path
Start with the assets that carry the highest business risk. Define what “good” means with the business, not just with engineering, and write the thresholds down. If the stakeholders can't agree on the SLA, the program doesn't have a quality problem, it has a requirement problem.
Then add controls where data enters or changes shape. Schema checks, null thresholds, and referential integrity tests are the first layer because they catch the most common pipeline breakages without making the system brittle. After that, introduce anomaly detection and timeliness checks so the program can catch drift, not just obvious rule violations.
The incident layer should be boring, and that's a compliment. Alerts need routing, owners need runbooks, and breaches need escalation paths. The purpose is not to create more tickets, it's to shorten the time between detection and correction.
Success should be visible in operations, not slogans. Track mean time to detection, mean time to resolution, the share of critical assets under active monitoring, and the reduction in downstream incidents. Those signals tell you whether the program is improving control or just generating noise.
Executive sponsors listen when you connect quality to fewer rework cycles, faster model training, and fewer compliance findings. They stop listening when the conversation stays abstract.
A good program makes quality measurable, owned, and repeatable. That's the difference between a platform feature and an enterprise discipline.
If you're standing up or replacing a data quality program, digna can help you monitor critical datasets inside your own environment with validation, anomaly detection, timeliness checks, and schema tracking in one operational layer. Visit digna to see how continuous controls can fit your pipelines, your governance model, and the business systems that depend on trusted data.
Frequently asked questions
What is data quality management?
The continuous practice of making sure data is fit for the people and systems that consume it. The word that matters is continuous, because the discipline exists precisely because periodic checking stopped being sufficient.
Where did the discipline come from?
MIT launched the Total Data Quality Management program in 1988, which helped establish a lifecycle-based approach to measuring, improving and continuously monitoring data quality. The lifecycle framing is what separates it from housekeeping.
Why does the periodic auditing model break?
Because it works only when the business can tolerate delay. Once decisions are made continuously from data that changes continuously, an audit that runs monthly is describing a state the business has already moved past.
Where do quality checks belong?
In the pipeline, not in a spreadsheet review after the fact, whenever a dataset can influence money, risk or patient care. That threshold is a useful filter, because it separates datasets that need controls from those that merely need attention.
What makes trusted data a liability?
Trust without verification. A CFO who trusts the revenue dashboard will act on it faster than anyone can check it, which turns a quiet defect into a decision before the quality process has had a chance to run.



