What Is Quality Metrics: A Practical Guide to Data Fitness
|
7
min read

Your leadership dashboard shows steady revenue growth. The numbers look reassuring, so nobody questions the customer data feeding the model behind it. Then an AI system starts making confident predictions from incomplete records, and the first visible sign of trouble appears in a decision, report, or customer interaction.
That's the practical reason to ask what is quality metrics. Quality metrics are measurable indicators that show whether data meets defined requirements and is fit for a particular purpose. They turn vague confidence into evidence, so teams can see what's missing, late, duplicated, invalid, or misleading before a downstream user pays the price.
Table of Contents
Why Quality Metrics Matter for Every Data Decision
A dashboard can be technically available and still be untrustworthy. If customer records arrive without required values, if status codes mean different things in different systems, or if yesterday's data appears after today's decision window, the visual polish of the dashboard doesn't repair the underlying problem.
Quality metrics make those defects visible. They connect the condition of a record or dataset to the report, model, regulatory submission, operational workflow, or AI system that consumes it. A completeness rate can show whether essential fields are populated. A timeliness measure can reveal that a scheduled delivery missed its reporting cutoff. A validity check can identify values that violate an approved format or business rule.
That connection matters because different users need different evidence. A data engineer may need to know whether a pipeline loaded every expected partition. An analyst may need to know whether customer counts are inflated by duplicates. A compliance team may need proof that required fields were present and valid when a report was produced. A decision-maker needs to know whether the resulting information is safe enough for the decision at hand.
Practical rule: A metric earns its place when someone knows what action to take after it changes.
Without that action, a quality score becomes another dashboard ornament. A useful program defines the population being measured, the calculation method, the acceptable threshold, how often the measure runs, and the business context behind it. Teams looking for the wider organizational rationale can also review why data quality is important to an organization.
The path forward is straightforward. First, define quality in plain language. Then separate the core dimensions, calculate them consistently, and translate them into decision-specific thresholds. Finally, connect breaches to owners, remediation, and business outcomes.
A Working Definition of Quality Metrics
A quality metric is a measurable indicator used to determine whether data conforms to defined requirements and is fit for a particular purpose. The definition has two parts. The first concerns whether the data follows rules. The second asks whether the data is useful for the job someone needs it to do.

ISO 8000-8:2015 established a framework for measuring information and data quality across three categories: syntactic, semantic, and pragmatic quality, separating structural correctness from meaning and usefulness.
Think of a letter sent through the post. Syntactic quality is the address format, postcode structure, and envelope details. The letter follows the rules needed for the postal system to process it. In a data table, that could mean a date uses an accepted format or a status value fits the expected data type.
Semantic quality asks whether the content means what it claims to mean. A correctly formatted customer-status code is still poor data if the code does not represent the documented customer status. The structure can be perfect while the meaning is wrong.
Pragmatic quality asks whether the information is suitable and worthwhile for its intended user. A customer dataset may be structurally correct and semantically meaningful, yet too late for a fraud decision or too coarse for a regulatory report.
A metric therefore needs more than a number. Define:
Population: Which records, fields, deliveries, or events are included?
Calculation: How will the result be produced?
Threshold: What result is acceptable for this use case?
Frequency: How often will the measure be evaluated?
Context: Which decision, workflow, or control depends on it?
A score without those details can mislead. A completeness result may look strong across an entire table while hiding missing values in a legally required field. A timeliness result may look acceptable for a weekly trend report but fail an operational process that needs data within the day.
The most useful mental model is simple: quality metrics are the bridge between a data requirement and a business decision. They tell you not only whether data looks correct, but whether a specific user can rely on it.
The Core Dimensions Every Quality Program Should Know
The UK Government Data Quality Framework identifies six core dimensions drawn from DAMA UK: completeness, uniqueness, accuracy, consistency, timeliness, and validity, treated as separate measures rather than one overall score. The framework's definitions provide a practical vocabulary for diagnosing defects.
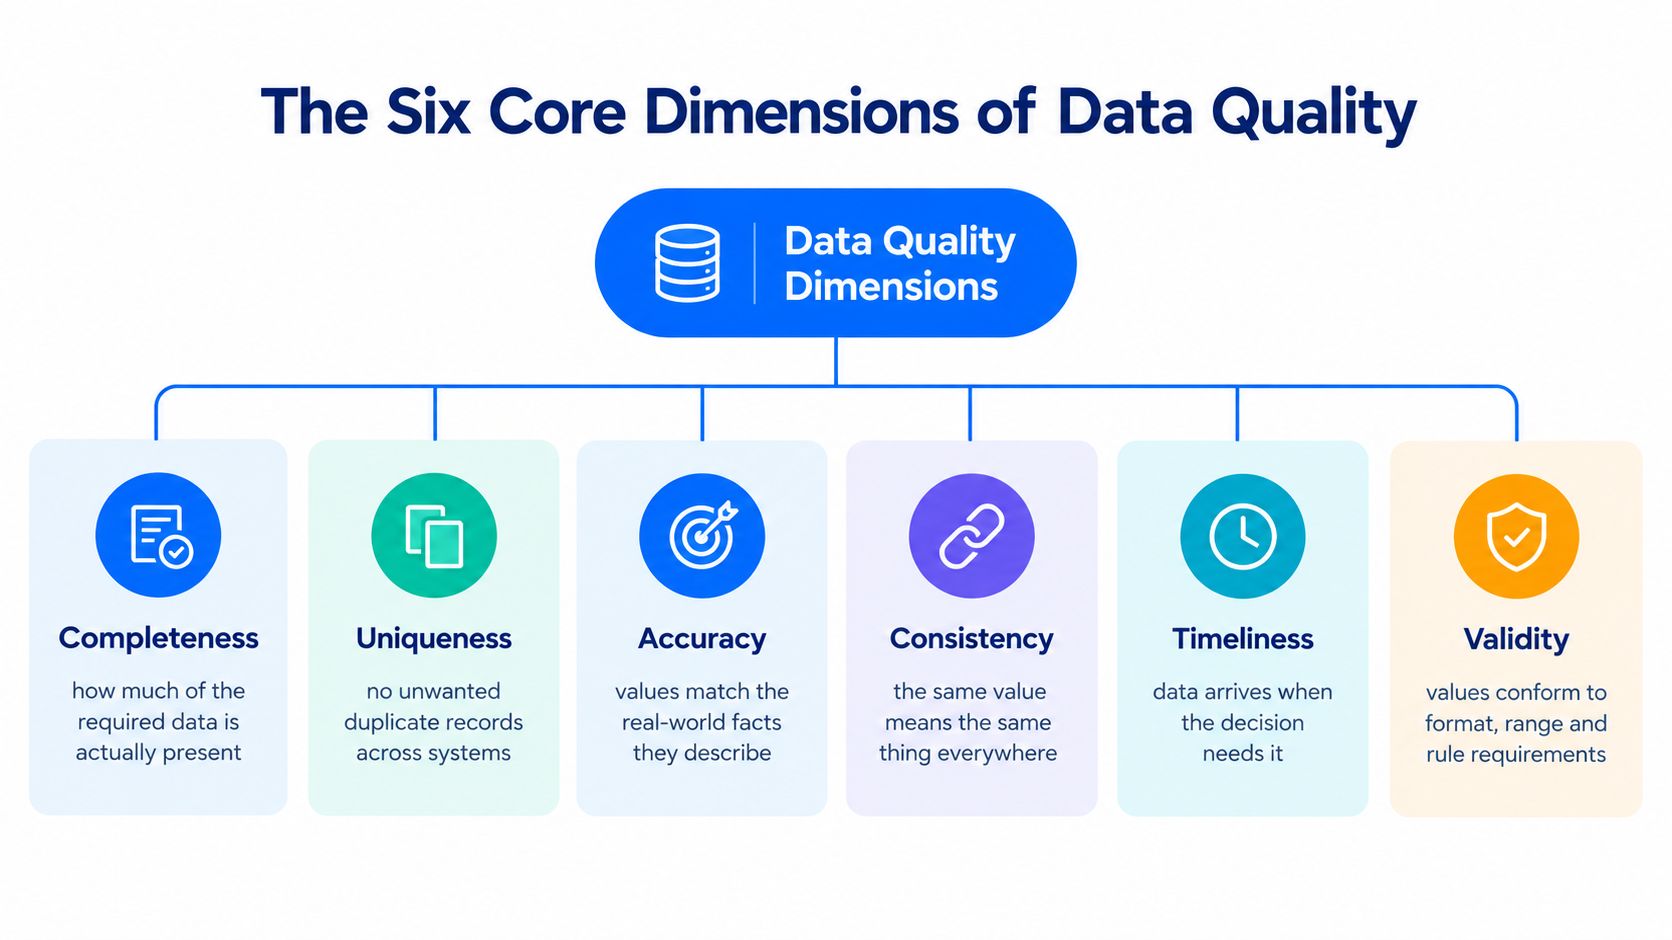
Here's how to tell the dimensions apart:
Completeness asks whether expected records and required values are present. A customer table may contain every expected account but still have missing phone numbers.
Uniqueness asks whether each real-world entity appears only once. Two records for one customer can inflate account counts and revenue summaries.
Accuracy asks whether values represent reality. An address can be populated and correctly formatted while still being wrong.
Consistency asks whether the same fact agrees wherever it appears. A customer's account status shouldn't conflict between the operational system and the warehouse.
Timeliness asks whether data arrives when a decision needs it. A sales dashboard may be accurate but unhelpful if the daily load arrives after leadership reviews the numbers.
Validity asks whether values conform to defined formats, ranges, lists, or business rules. A non-null date can still fail validity if it uses an impossible or unapproved format.
These dimensions describe different failure modes. A dataset can be complete but inaccurate, valid but inconsistent, or timely but duplicated. Combining them too early into one “quality percentage” makes it harder to identify the owner and intervention required.
For example, missing customer addresses may belong to the source-system team, while duplicate customer keys may require identity resolution. A cross-system status conflict may require a shared definition and data contract, not another cleansing script. For additional practical patterns, data quality metrics examples can help teams connect dimensions to concrete checks.
A useful dashboard preserves the mechanics of each measure. It should let a team see whether a breach comes from absent values, incorrect values, conflicting values, late delivery, or duplication. That diagnosis is more valuable than a single blended score because it points toward a specific fix.
You can find a broader explanation of these categories in digna's guide to the dimensions of data quality, but the operating principle remains the same: measure each dimension separately before deciding how to combine or prioritize them.
How to Calculate Completeness and Validity as Percentages
A dimension becomes operational when a team can calculate it the same way every time. Completeness and validity are useful starting points because both can be expressed as explicit percentages, while still revealing different problems.
The completeness formula is:
Completeness rate = populated required values ÷ expected required values × 100
Suppose a table contains 98,000 populated required fields out of 100,000 expected fields. The result is a 98% completeness rate, as described in this guide to measuring data quality metrics.
Validity uses a different denominator:
Validity rate = records passing predefined rule checks ÷ total records evaluated × 100
A validity rule might require a date to use an approved format, an amount to fall within an allowed range, or a status to belong to a permitted list. A field can be populated and still fail the rule, so validity shouldn't be treated as a substitute for completeness.
Metric | Formula | Example Input | Result | What It Reveals |
|---|---|---|---|---|
Completeness rate | Populated required values ÷ expected required values × 100 | 98,000 ÷ 100,000 × 100 | 98% | Whether required values are present |
Validity rate | Records passing rule checks ÷ records evaluated × 100 | Passing records ÷ evaluated records × 100 | Depends on rule results | Whether populated values conform to defined rules |
The distinction changes remediation. If required values are missing, the team may need to repair an upstream capture process or make a source field mandatory. If values are present but invalid, the owner may need to correct transformation logic, reference data, or validation rules.
Thresholds should also remain separate. A business may tolerate some missing optional attributes while rejecting any invalid regulatory identifier. The right threshold depends on the field's role and the decision it supports, not only on the table's overall average.
For a practical implementation, how to measure data completeness offers a useful way to connect the formula to monitoring routines. Record the population, rule version, evaluation time, result, and responsible owner. That history lets teams distinguish a one-time defect from a recurring source problem.
Timeliness, Accuracy, Consistency, and Uniqueness in Practice
A customer table can pass several checks and still produce a bad report. Consider a sales dataset where sampled addresses match a trusted reference, customer statuses agree across systems, and every daily file arrives before the analyst opens the dashboard. If the ingestion process creates duplicate customer records, revenue and customer counts can still be overstated.
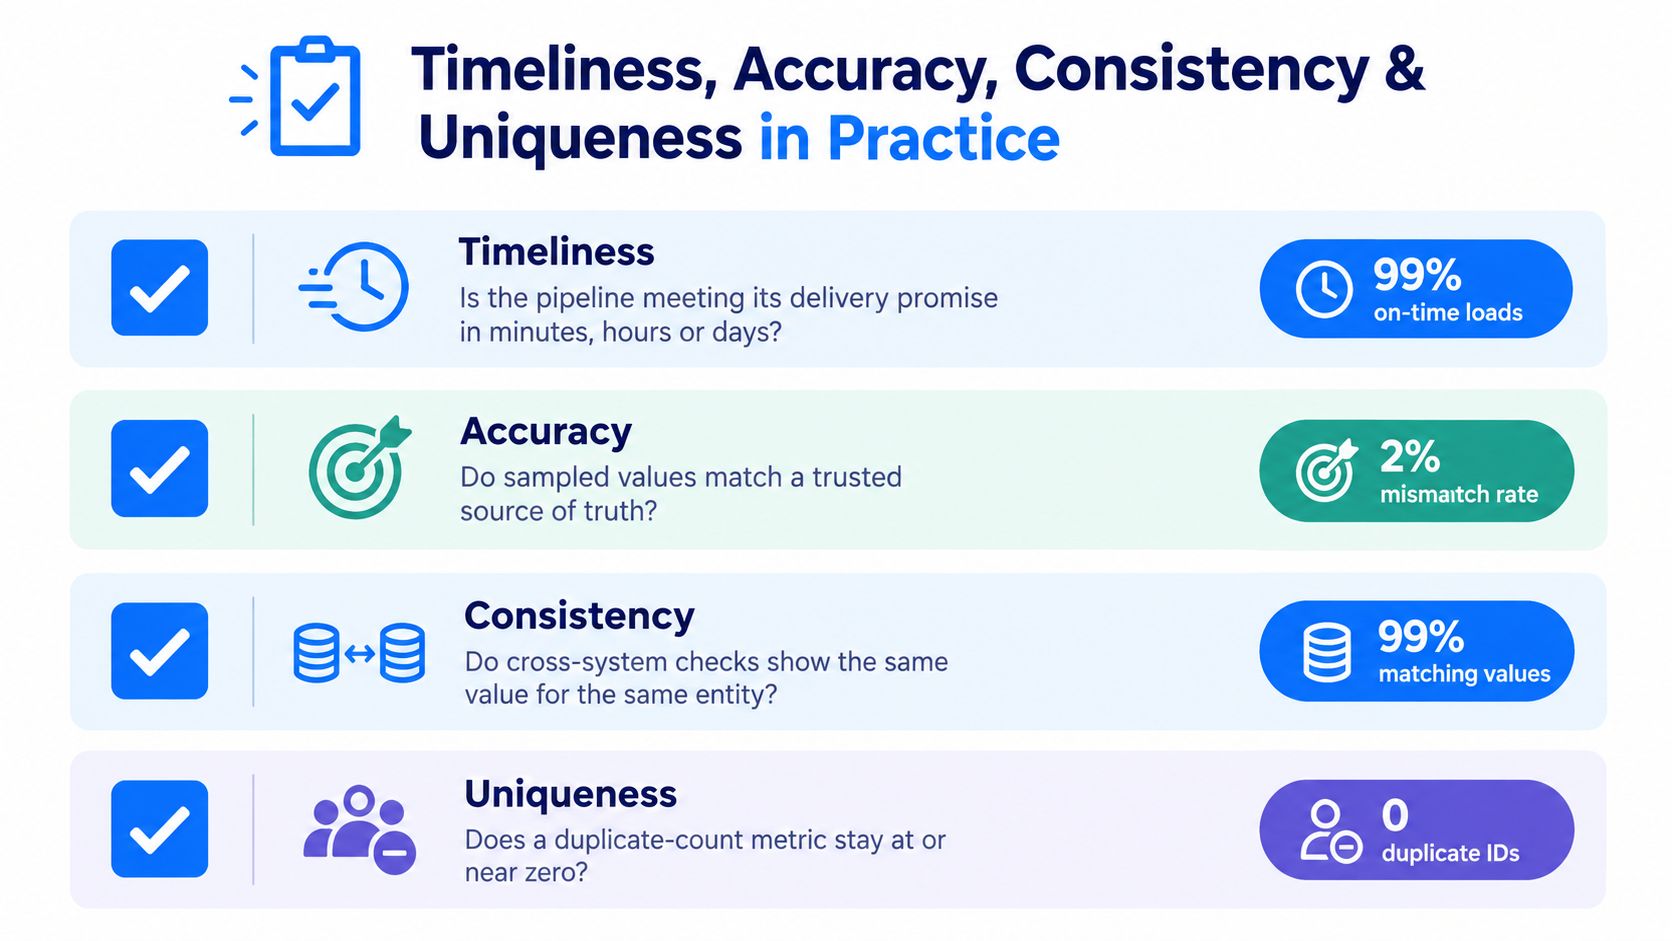
Each dimension answers a different operational question:
Timeliness: Did the delivery meet its expected schedule?
Accuracy: Do sampled values match a trusted source of truth?
Consistency: Does the same fact agree across systems?
Uniqueness: Does each real-world entity appear only once?
Timeliness is more than just checking the newest timestamp. It compares each delivery timestamp with an expected deadline or learned schedule, then reports measures such as median delay, maximum delay, percentage delivered by the deadline, and number of missed deliveries, as explained in this technical treatment of data timeliness.
Accuracy often requires sampling because reality sits outside the dataset. A team might compare selected customer records with a trusted reference source and estimate how often the stored values match. Consistency requires cross-system comparisons, such as checking whether an account status has the same value in the operational database and analytical table.
Uniqueness focuses on identity. A duplicate key or duplicate customer record can distort aggregates even when every individual row appears plausible. That makes uniqueness especially important for customer counts, transaction totals, and other measures that depend on one row representing one entity or event.
Freshness and timeliness aren't synonyms. Data can carry a recent timestamp and still arrive too late for the decision window.
Now change the use case. The same customer dataset might be sufficient for a broad trend analysis, where a small number of duplicates or late records won't alter the direction of the result. It may be unacceptable for a regulatory report, where a duplicate account, conflicting status, or missed delivery can invalidate a controlled submission.
That's why a quality review should ask what decision the data supports. The answer determines whether a defect is tolerable, requires an exception, or must block downstream use.
For teams defining delivery expectations, data timeliness metrics and monitoring provides a useful reference for turning arrival behavior into measurable controls.
From Dimensions to Decision Fitness
A quality metric becomes meaningful when it answers a decision question: Can this data be used safely for the job in front of us?
A generic checklist might report completeness, accuracy, validity, and timeliness for a customer dataset. A decision-fitness framework goes further by assigning each use case its own criticality, weighting, tolerance, and escalation path.
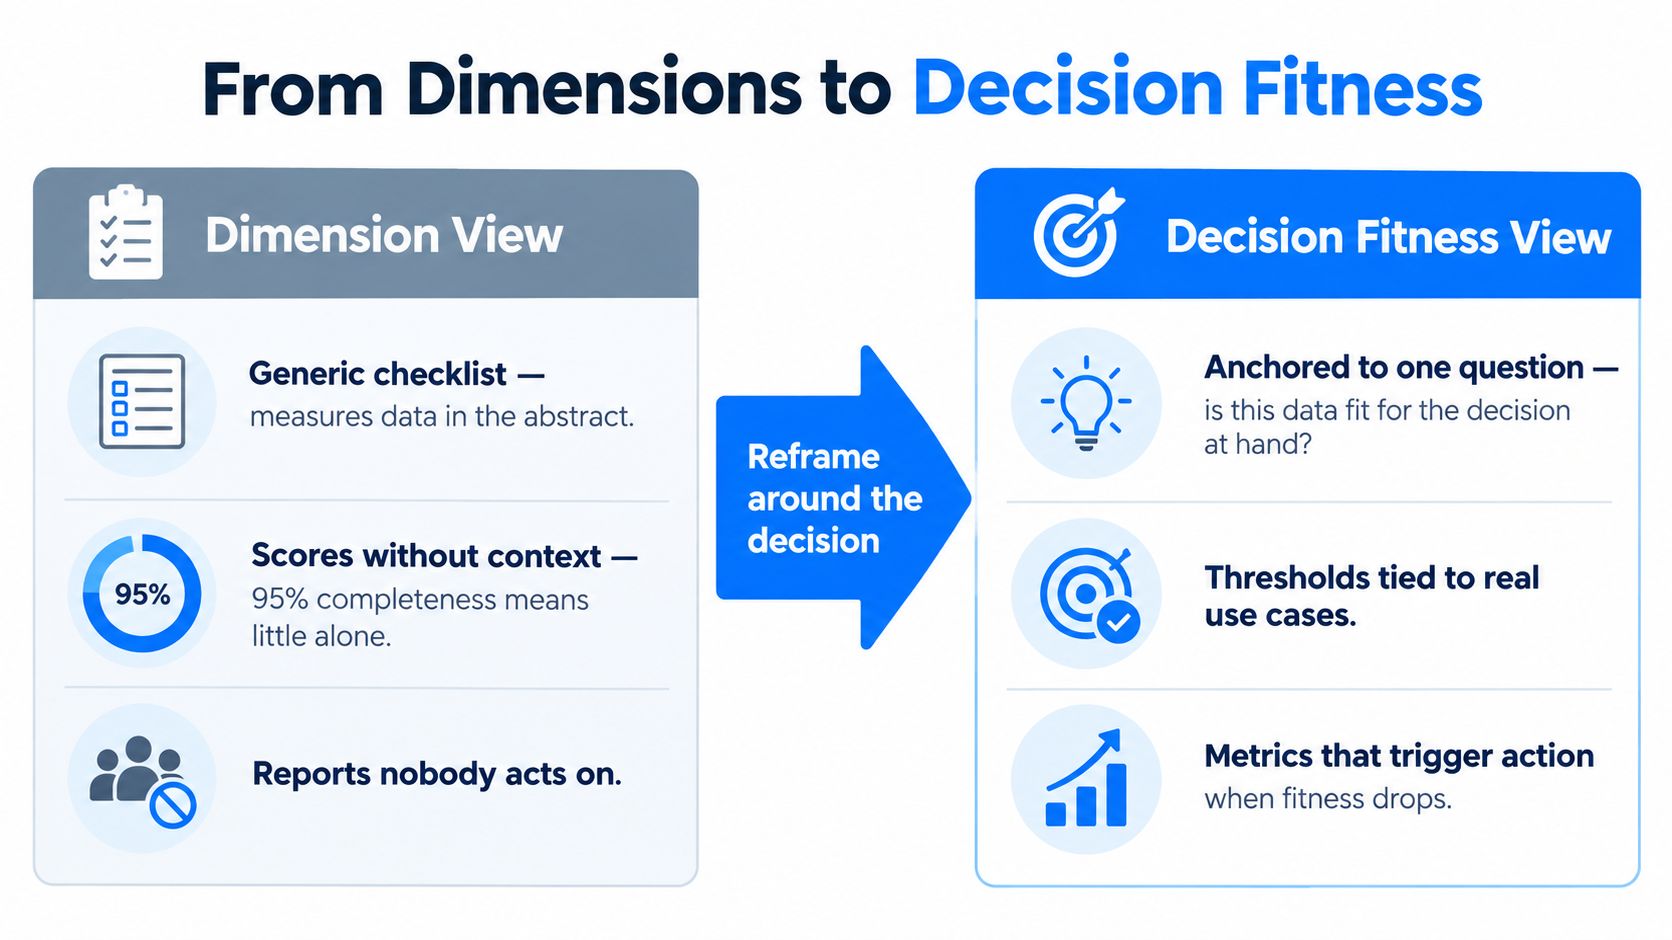
Take the completeness result from the earlier example. A 98% completeness score may be acceptable for a marketing audience analysis, but it may be unacceptable if the missing 2% contains legally required fields or high-risk customers. The overall percentage doesn't tell you which records are missing or what consequence follows.
A decision-fitness design should specify:
Criticality: Which fields or records can cause material harm if defective?
Weighting: Should a required identifier count more than an optional preference?
Tolerance: What imperfection can the business accept for this use?
Escalation: When does the issue trigger an alert, exception, quarantine, or release block?
Ownership: Who defines the rule and who fixes the source problem?
The same dataset may move through several quality contexts. Exploratory analysis can tolerate uncertainty that production AI cannot. A trend report may accept a delayed refresh that a regulated submission cannot. A credit decision may require stronger accuracy evidence than a broad segmentation exercise.
Data contracts help here. A contract can document the expected fields, meanings, delivery behavior, validation rules, responsible owner, and response when a threshold is breached. It turns “good enough” from an informal assumption into an agreed operating condition.
Research illustrates why a universal score is unrealistic. A 2025 systematic mapping of public-sector research identified approximately 70 different data-quality metrics, showing fragmented measurement practices rather than one accepted master score, according to the systematic mapping study.
A practical scorecard may still summarize status, but the underlying measures should remain visible. Every threshold should connect to a decision and an action. That is the difference between measuring data and governing its use.
The Business Case and the Case Against Perfection
Quality metrics also act as economic signals. IBM reported in 2025 that 43% of chief operations officers identified data-quality issues as their most significant data priority, while more than one-quarter of organizations estimated annual losses exceeding USD 5 million because of poor data quality, and 7% reported losses of USD 25 million or more. These figures are documented in IBM's analysis of the cost of poor data quality.
The numbers matter because they give leaders a reason to connect technical measures with operating outcomes. A quality incident can be tracked alongside:
Rework hours: How much time analysts and engineers spend correcting reports.
Pipeline failures: How often a broken load interrupts a dependent process.
Audit findings: Which defects create control or evidence gaps.
Decision errors: Whether inaccurate or incomplete data affects revenue, risk, or service outcomes.
Resolution performance: How quickly teams detect and remediate recurring issues.
You can find a business-oriented framing of this connection in digna's data quality business case, but the principle is broader than any one platform.
More quality isn't always better. Remediation can cost time and money, add processing latency, expose sensitive data during movement, or deliver little value when the dataset supports a low-risk exploratory question. A documented imperfection may be the rational choice when the business understands the limitation and accepts the consequence.
That doesn't mean teams should lower standards without saying so. It means the exception needs an owner, a reason, an expiry or review condition, and a visible impact measure. The cost of fixing the defect should be compared with the risk of leaving it unresolved.
The right goal is decision-appropriate quality, not an abstract pursuit of perfection. Measure aggressively, prioritize high-consequence failures, and make every exception visible enough for a responsible person to approve.
Getting Started and Frequently Asked Questions
Start with two or three datasets behind consequential decisions. Assign owners, define the dimensions that matter, set thresholds, and instrument detection before expanding coverage. Track time to detection and time to remediation alongside rework, audit findings, and financial loss.
Which metric comes first? Choose the dimension most likely to affect the decision, not the easiest percentage to calculate.
How often should teams measure? Match frequency to the decision window. Operational data may need frequent checks, while slower reporting cycles may support less frequent evaluation.
What if there's no trusted reference for accuracy? Use consistency, validity, provenance, and sampled business review until a reference source is established.
How does the program stay active? Give every breach an owner, response path, and outcome measure. Review thresholds as datasets move into new decisions.
digna helps teams monitor data behavior, validate records against business rules, track timeliness, detect schema changes, and analyze quality trends inside their own environment. If you're ready to connect quality metrics with decision fitness across warehouses, lakes, and pipelines, visit digna to explore the platform.
If you want to turn the thresholds, owners and escalation rules described above into an agreed operating condition between producers and consumers, see our guide to driving data quality with data contracts.
Frequently asked questions
What are quality metrics in data management?
Quality metrics are measurable indicators that show whether data meets defined requirements and is fit for a specific purpose. Each one needs a defined population, calculation, threshold, frequency and business context, otherwise a single score can hide problems such as missing values in a legally required field.
What are the six core dimensions of data quality?
The six core dimensions are completeness, uniqueness, accuracy, consistency, timeliness and validity, as set out in the UK Government Data Quality Framework drawing on DAMA UK. Each describes a different failure mode, so a dataset can be complete yet inaccurate, which is why they should be measured separately.
How do you calculate a data completeness rate?
Divide the number of populated required values by the number of expected required values and multiply by 100. For example, 98,000 populated fields out of 100,000 expected gives a 98% completeness rate. Validity works differently: records passing rule checks divided by records evaluated.
What is the difference between data freshness and timeliness?
Freshness describes how recent a timestamp is, while timeliness asks whether data arrived in time for the decision that needs it. A record can carry a recent timestamp and still miss the reporting cutoff, so timeliness is tracked with median delay, maximum delay and missed deliveries against a deadline.
Is a 98% data quality score good enough?
That depends entirely on the decision the data supports. A 98% completeness score may be fine for a marketing audience analysis but unacceptable if the missing 2% contains legally required fields or high-risk customers. Set thresholds per use case, with criticality, tolerance and a clear escalation path.