What Is Data Observability? a Guide for Modern Data Teams
|
7
min read

You're probably dealing with some version of the same problem most modern data teams face. A dashboard that looked fine yesterday is suddenly stale. A weekly KPI drops to zero because an upstream table stopped updating. A model starts producing questionable outputs, but no pipeline has technically “failed,” so nothing alerts until a stakeholder notices. The hard part isn't only fixing the issue. It's finding where it started, who owns it, and how many downstream assets are already affected.
That's why data observability has moved from a nice-to-have idea to an operational requirement. It gives teams a way to understand the health of data across ingestion, transformation, storage, and consumption, instead of relying on job-status checks and scattered data tests that miss silent failures.
Table of Contents
Beyond Broken Dashboards The Rise of Data Observability
Teams don't start searching for data observability because they love new categories. They start because their current stack leaves blind spots. Airflow says a job succeeded. dbt tests pass. The warehouse is up. Yet a dashboard is still wrong, a finance extract is late, or an AI workflow consumes shifted input data without any obvious error.
That gap matters because data systems now fail in quieter ways. A missing partition, a delayed source feed, a type change in one upstream column, or a gradual distribution shift can all damage downstream decisions without producing a dramatic red failure light.
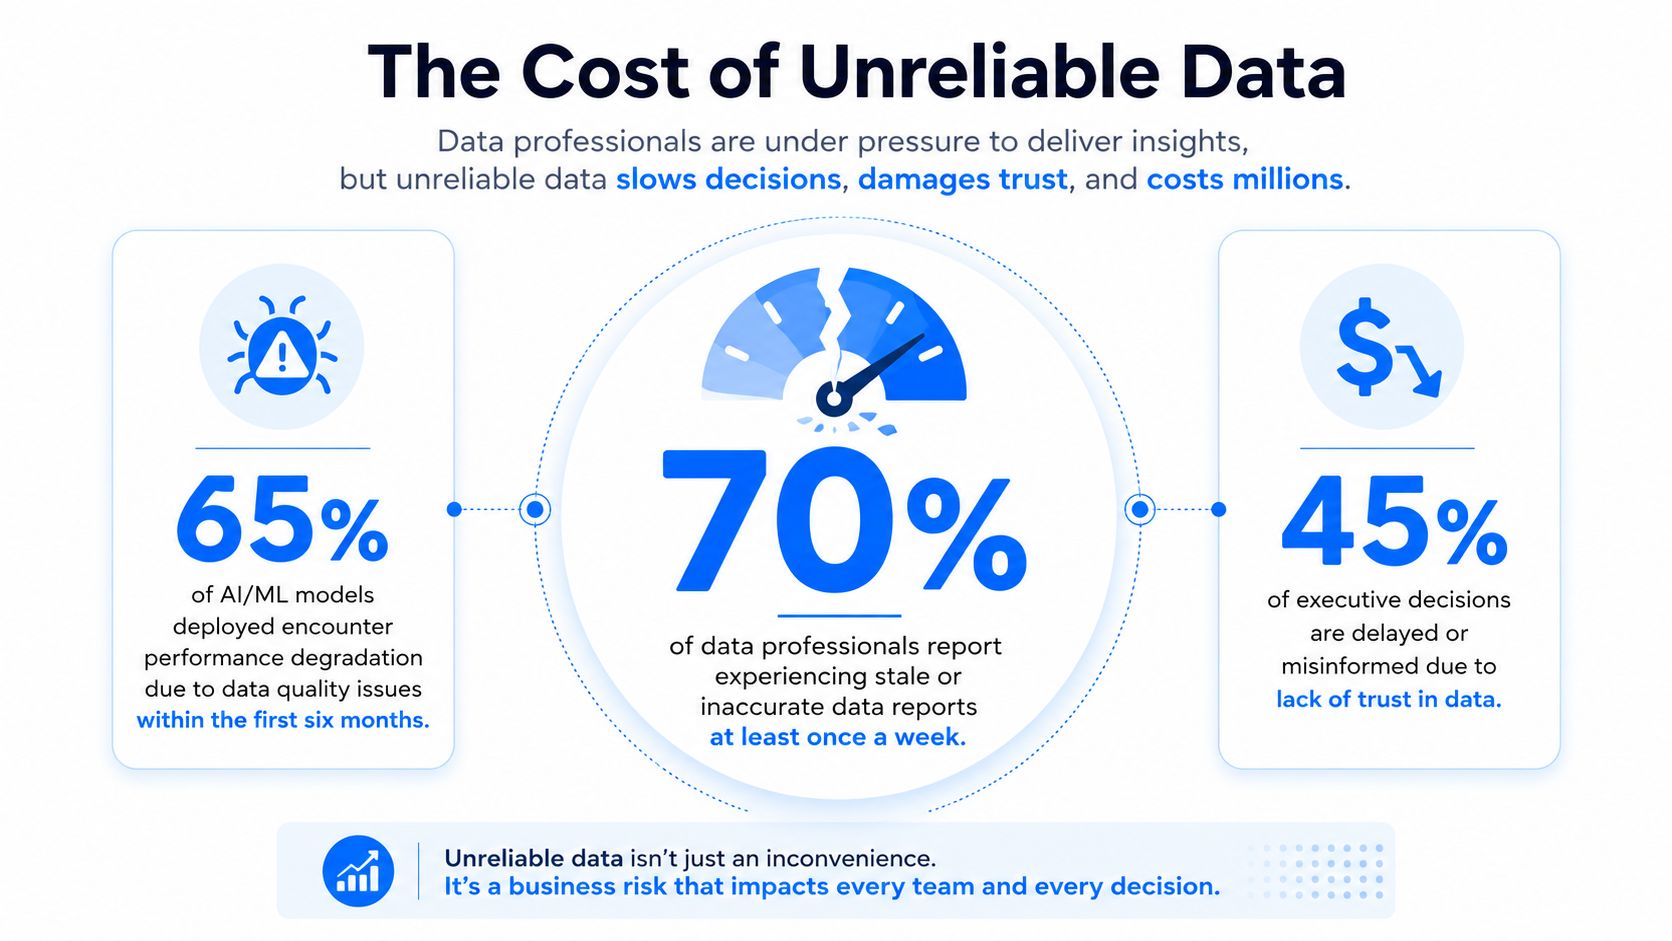
Why legacy monitoring no longer covers the real problem
Traditional monitoring answers operational questions such as “Did the job run?” or “Is the service up?” Data teams also need answers to a different class of questions:
Did the data arrive on time: Even if the pipeline completed, did the latest partition land when users expected it?
Did the content change unexpectedly: Are null rates, distributions, or key business fields drifting?
Did the shape change: Was a column renamed, removed, or recast upstream?
Who is affected: Which dashboards, models, and teams depend on this asset?
That's the territory of data observability. It's focused on the health of the data itself and the path it takes through the stack.
Broken dashboards are usually the final symptom, not the first failure.
Why this has become a strategic shift
The category is growing because enterprises have outgrown simple status checks. The Mordor Intelligence data observability market projection values the global market at USD 3.51 billion in 2026 and projects it to reach USD 6.03 billion by 2031, expanding at a CAGR of 11.42%. That growth reflects a broader move from basic monitoring toward end-to-end visibility.
In practice, the shift is easy to understand. Teams have more cloud services, more domains, more transformations, more consumers, and more pressure to support analytics and AI without data incidents becoming a daily firefight. If your stack spans ingestion tools, orchestration, warehouse transforms, semantic layers, and model pipelines, then health checks on isolated tools won't tell you whether the final data product is trustworthy.
Data observability is the operating model that closes that gap. It gives engineers and analysts shared visibility into freshness, content, structure, and dependencies, so issues surface before a stakeholder escalates them.
The Five Pillars of Data Observability
The easiest way to make data observability concrete is to break it into the signals teams monitor. Flexera's overview of the five pillars defines them as Freshness, Quality, Volume, Schema, and Lineage, which together help organizations detect silent data drift.
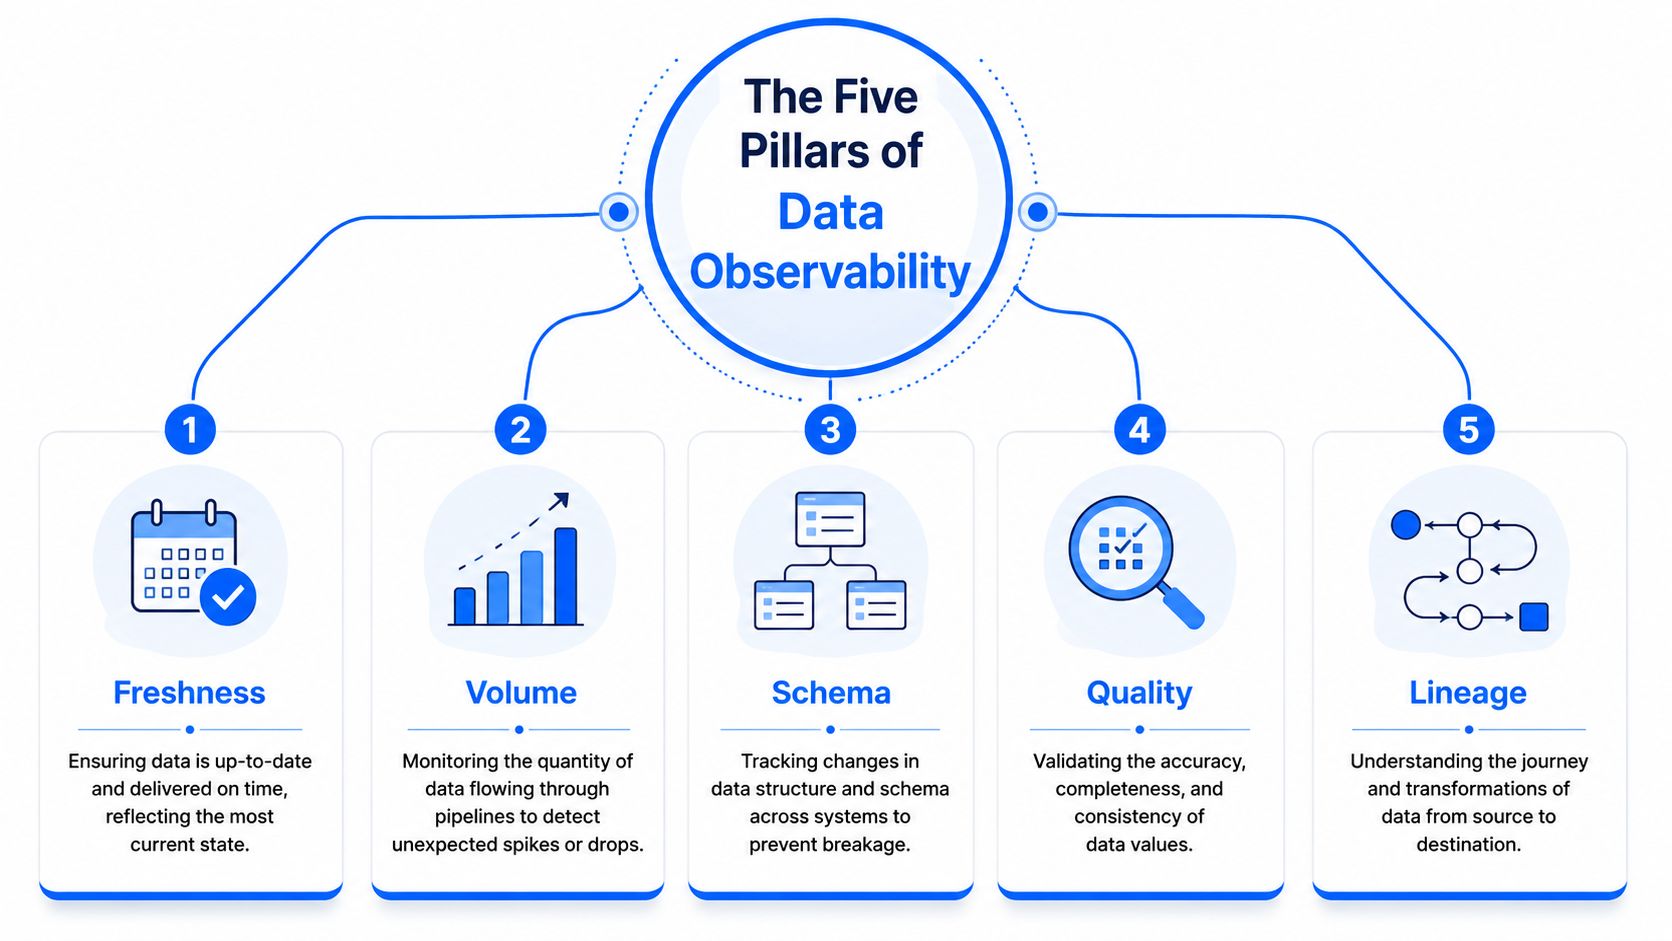
Freshness tells you whether data arrived when it should
Freshness is the timeliness pillar. It answers a basic operational question: Is this dataset current enough for its intended use?
A table can be perfectly valid and still be useless if it's late. Finance close reports, customer support dashboards, and fraud workflows all depend on expected arrival times. Good freshness monitoring doesn't just compare against a static timestamp. It learns normal delivery patterns, expected schedules, and the difference between “late but still acceptable” and “late enough to create business risk.”
A useful mental model is a train timetable. The train existing isn't enough. It has to arrive when passengers need it.
Quality checks whether the values are fit for use
Quality is about the content itself. Are values accurate, complete, and consistent enough to trust?
This pillar catches issues like unusual null spikes, broken enumerations, invalid codes, impossible values, or business fields that suddenly stop behaving as they normally do. It's also where teams often realize that passing transformation jobs don't guarantee usable outputs.
Practical rule: If a dataset can be technically available and still produce a bad business decision, you need quality signals, not just pipeline signals.
Volume highlights unexpected shifts in data flow
Volume asks whether the amount of data moving through a system still looks normal. Sometimes the clearest signal of a broken source is not a failed job. It's a table that receives far fewer rows than usual, or far more.
Volume checks are especially useful for ingestion pipelines, event streams, and recurring batch loads. A sudden drop may indicate missing source records. A spike may indicate duplication, replay, or an unintended change in extraction logic.
Schema tracks structural change before it breaks consumers
Schema observability monitors structural changes such as added columns, removed columns, renamed fields, or changed data types. Engineers often discover schema problems only after a BI model breaks or a downstream parser starts failing.
Think of schema as the contract surface between producers and consumers. If that contract changes unnoticed, breakage usually appears downstream and late.
A strong schema tracker should show not just that a structure changed, but where that change originated and which dependent assets are exposed.
Lineage shows blast radius and ownership
Lineage maps where data came from, what transformed it, and what depends on it. It's the difference between finding a broken wire in a wall and seeing the full wiring diagram.
When an incident happens, lineage answers the questions that matter under pressure:
Where did the issue start
Which tables, dashboards, or models are downstream
Who owns the affected assets
What changed immediately before the incident
Without lineage, teams waste time guessing. With lineage, root cause analysis becomes a directed investigation instead of a Slack scavenger hunt.
Observability vs Monitoring vs Quality A Clear Distinction
Teams often use these terms as if they mean the same thing. They don't. The overlap is real, but the job each discipline performs is different.
A side by side view
Dimension | Data Monitoring | Data Quality | Data Observability |
|---|---|---|---|
Primary focus | Pipeline and system activity | Correctness of data values and records | Overall health of data across pipelines, content, structure, and dependencies |
Typical posture | Reactive or threshold-based | Rules-based control and validation | Proactive detection and diagnosis |
Main question | Did the process run and emit expected signals? | Does the data meet defined standards? | Is the data reliable, and if not, what changed and what is affected? |
Common inputs | Job status, logs, runtimes, task failures | Validation rules, profiling, business constraints | Metadata, historical patterns, anomalies, lineage, schema, freshness, quality signals |
Best at catching | Failed jobs, missed schedules, infrastructure issues | Known violations of business logic | Silent drift, unusual patterns, hidden upstream changes, downstream impact |
Weakness | Misses many “green but wrong” scenarios | Depends on rules you already know to write | Needs broader instrumentation and metadata coverage |
Who relies on it | Data engineers and platform teams | Data quality, governance, analysts, auditors | Engineering, analytics, governance, and operational stakeholders together |
Why teams confuse them
Monitoring came first in most stacks, so many organizations try to stretch it beyond what it was built to do. An orchestration tool can tell you whether a task failed. It usually can't tell you that the task succeeded while loading incomplete customer records. A validation framework can enforce rules on known fields. It usually can't tell you that a previously stable distribution has shifted in a way no rule anticipated.
That's why observability should be treated as the broader capability. It incorporates signals from monitoring and complements data quality controls, but it isn't reducible to either one.
For teams building stronger record-level controls, this guide on streamlining data with validation is useful because it explains where explicit validation rules still matter. The key is not to stop there. Validation handles known requirements. Observability handles changing conditions and unknown failure modes.
A simple way to frame the relationship is this:
Monitoring watches system behavior.
Quality enforces data correctness.
Observability connects behavior, correctness, change, and impact.
That distinction matters most in regulated environments. Audit teams usually care about both runtime health and business-rule compliance. If those controls live in separate silos, incident response gets slower and evidence collection gets messy. A combined view is more practical. This is also where a deeper comparison of data observability vs data quality helps, especially when teams are deciding whether they need another testing tool or a broader operational layer.
Architecting for Observability In-Database vs Pipeline
Most implementation debates come down to one design choice. Do you observe data primarily in transit through the pipeline, or do you execute observability where the data already resides?
That architectural decision affects cost, privacy, latency, operational complexity, and how realistic the solution is for regulated environments.
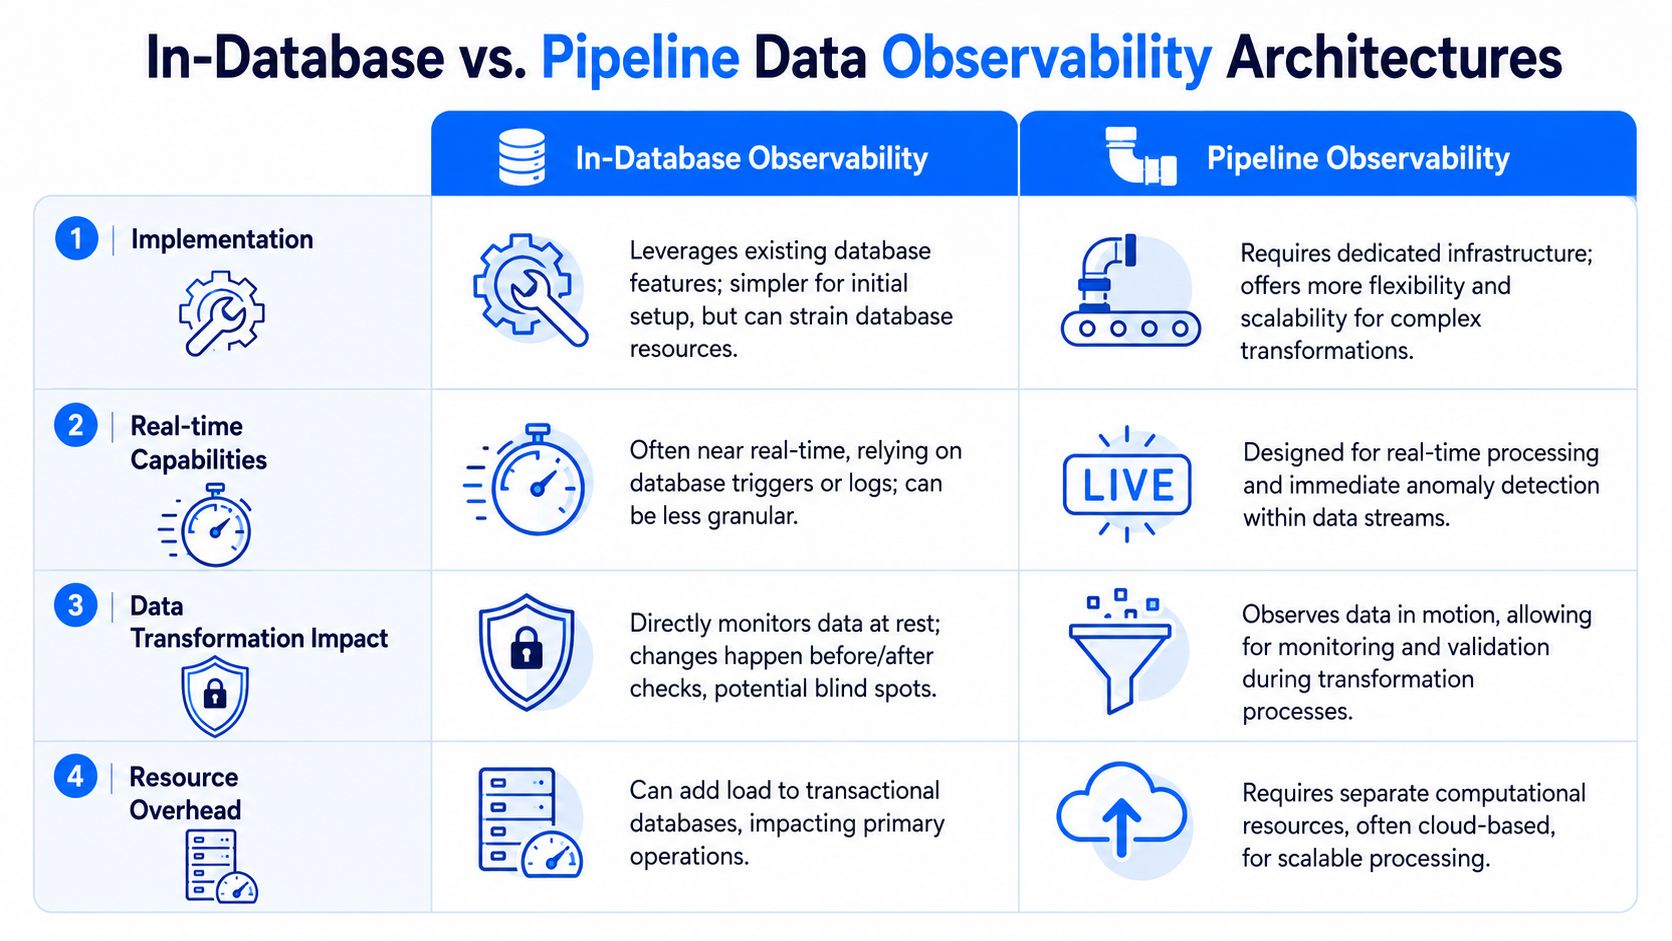
Pipeline instrumentation works but it fragments fast
Pipeline-first observability monitors data in motion. It can be useful when teams need visibility during transformation stages, stream processing, or orchestration handoffs. You can inspect behavior at multiple checkpoints and attach alerts close to execution events.
The trade-off is fragmentation. Once the stack spans ETL tools, streaming systems, warehouse transforms, notebooks, and BI refresh processes, monitoring logic gets distributed across too many surfaces. Ownership becomes blurry. Alert logic drifts. Engineers end up correlating evidence manually across logs, schedulers, and warehouse metadata.
Pipeline-heavy approaches also create pressure to move or duplicate metadata, and sometimes the data itself, into external systems for analysis. That may be acceptable in a cloud-native startup. It's often a non-starter in finance, healthcare, or the public sector.
In-database execution fits regulated environments better
For private cloud and on-prem environments, in-database observability is usually the cleaner design. The logic runs where the data already sits, which reduces movement and keeps sensitive datasets inside the customer-controlled environment.
That matters because one of the biggest gaps in the market is practical guidance for AI-driven observability without data exfiltration. In regulated settings, teams still need unsupervised pattern detection, baseline learning, and anomaly detection, but they can't just ship production data to a SaaS backend and hope legal signs off later.
Acceldata's discussion of enterprise-scale observability architectures emphasizes metadata-driven design and notes that minimizing data movement is a critical benchmark for high-volume warehouses. That principle becomes even more important on-prem, where egress, replication, and duplicated storage create both operational and compliance overhead.
A practical decision framework looks like this:
Choose pipeline-centric coverage when you need detailed visibility during streaming or transformation stages and you already operate a mature multi-tool platform team.
Choose in-database execution when privacy, data residency, warehouse scale, and low movement of sensitive data are hard requirements.
Use metadata as the control plane when you need breadth across domains without hand-configuring checks for every asset.
On-prem AI observability only works at scale if baseline learning and anomaly detection can happen inside the customer environment.
The other trade-off is resource placement. In-database approaches can add load if implemented carelessly, especially on transactional systems. The answer isn't to avoid the model. It's to scope execution to analytical stores, use metadata intelligently, and avoid expensive brute-force scans on every object all the time.
Among platforms built for this model, digna is one example that executes analyses inside customer databases and supports private cloud or on-prem deployments while combining anomaly detection, timeliness monitoring, schema tracking, and record-level validation. That architecture is often a better fit when security teams won't permit vendor access to production data.
Evaluating Data Observability Platforms A Checklist
Many tools claim to do observability because they have alerts, dashboards, or a handful of anomaly checks. That's not enough. A serious evaluation should test how the platform behaves under real operational conditions, especially if you run private infrastructure or face compliance pressure.
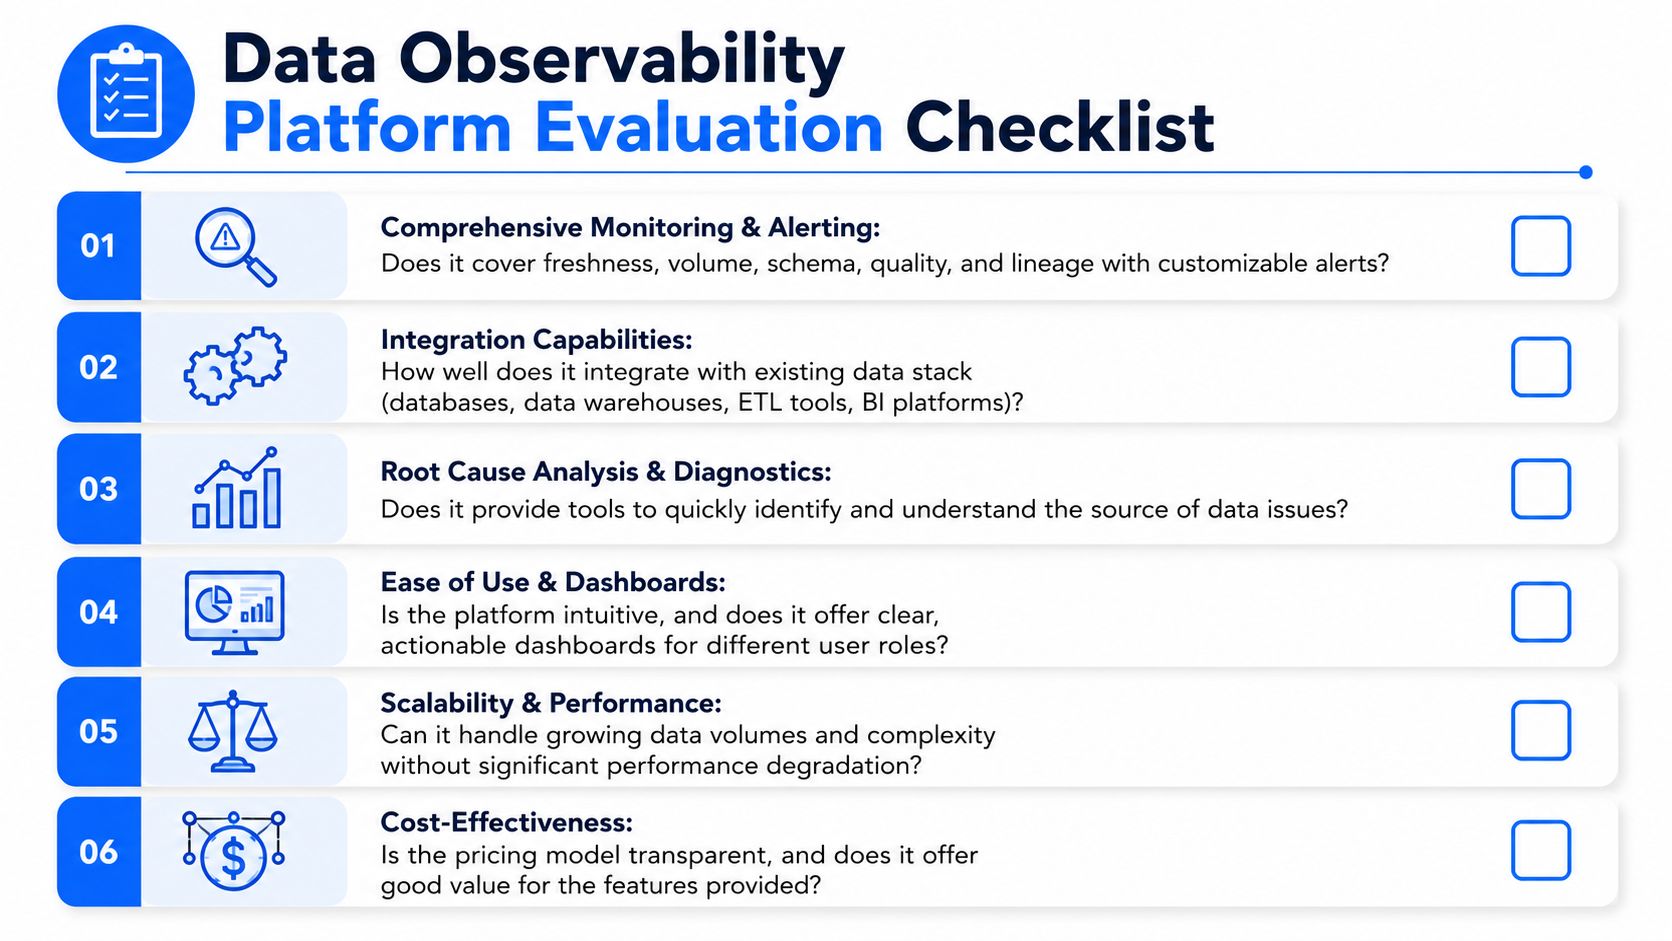
What to insist on before a proof of concept
First, look for coverage across the full operational surface, not just one signal. A platform should handle freshness, quality, volume, schema, and lineage in a way that feels unified, not bolted together.
Second, pay close attention to how anomaly detection works. Secoda's review of data observability trends notes that AI-powered anomaly detection is the most widely cited application of AI in the observability space, largely because it learns normal baselines without requiring manual rule maintenance. That distinction matters. If your team has to hand-tune thresholds for every dataset, you haven't solved the operational burden. You've relocated it.
Third, verify deployment reality, not marketing language. “Private” can mean many things. Ask whether the platform can run inside your environment, whether baseline learning happens there, and whether the vendor ever accesses production datasets or telemetry payloads that expose regulated content.
A useful shortlist should include:
Deployment flexibility: Cloud, private cloud, and on-prem options should be real, not roadmap promises.
In-environment learning: Baselines and anomaly detection should run where your governed data lives.
Unified observability and validation: You want statistical detection for unknown issues and rule-based validation for audit-critical logic.
Usable lineage and diagnostics: Root cause analysis should reduce investigation time, not add another dashboard.
Role-specific views: Engineers, analysts, and governance stakeholders need different interfaces and alerting paths.
Questions that expose weak platforms quickly
During evaluation, the most revealing questions are usually operational:
Question | Why it matters |
|---|---|
How much manual threshold configuration is required? | High setup effort usually turns into alert fatigue and abandoned monitors. |
Can it detect issues when no static rule is violated? | Silent drift and unusual patterns rarely announce themselves through predefined tests. |
What stays inside our environment? | This determines whether the tool is even deployable in regulated settings. |
Can it combine record-level rules with anomaly detection? | Audit-ready teams need both. Separate products add friction. |
How does it show blast radius? | Detection without impact analysis still leaves responders guessing. |
One more filter helps. Ask the vendor to walk through a scenario where a table arrives late, a downstream schema changes, and a business rule fails on a regulated field. If the story requires three products and a manual handoff, that's the architecture you'll inherit.
For teams comparing broader capabilities, this explainer on what an observability platform should include is a useful reference point while building an evaluation checklist.
Data Observability Use Cases and ROI
The value of data observability becomes obvious when you tie each signal to a business failure teams already recognize. The strongest use cases aren't abstract. They're the incidents people are tired of cleaning up.
Keeping executive reporting trustworthy
A common failure pattern is a report that refreshes on schedule but includes stale or partial data. The BI layer looks healthy. The underlying business view is not.
Freshness monitoring catches late arrivals before the dashboard consumer does. Volume checks add a second guardrail by spotting incomplete loads that still produce technically valid tables. The business outcome is straightforward: leaders stop making decisions from half-updated numbers, and analysts stop spending mornings proving whether a KPI can be trusted.
Protecting ML and AI inputs from silent drift
AI and ML systems often degrade because inputs changed subtly, not because a serving endpoint went down. A field distribution shifts. A categorical value disappears. A schema modification changes feature logic without an obvious failure.
Modern platforms use unsupervised machine learning to learn normal patterns across signals such as freshness, volume, schema, and value distributions, which lets them flag anomalies even when no static rule is violated, as described in Grid Dynamics' glossary entry on data observability platforms. That's exactly the kind of protection model and analytics teams need, because many damaging changes sit outside the set of rules anyone thought to write.
Reducing incident investigation time
The direct operational return often comes from faster triage. When an issue appears, responders need to know whether it started in ingestion, transformation, source extraction, or downstream modeling. They also need to know who owns the affected assets.
A good observability workflow cuts out three expensive habits:
Manual log hunting: Engineers stop stitching together clues across separate tools.
Broad stakeholder pinging: Teams stop asking five owners whether they touched the data.
Blind rollback decisions: Responders can isolate the change before reversing unrelated work.
The fastest incident to resolve is the one where ownership, lineage, and the first abnormal signal are visible in the same place.
Combining observability and validation for audit readiness
This is the use case most articles underplay. Regulated teams don't just need anomaly detection. They also need proof that audit-critical business logic is enforced consistently.
That means combining observability signals such as freshness, schema, and volume with record-level validation rules. For example, a healthcare or finance workflow may need both kinds of protection at once:
Observability layer: Detects that the daily load is late or that a schema changed upstream.
Validation layer: Enforces that required fields, code sets, or business constraints still pass at the record level.
Operational layer: Routes the incident with enough context for investigation and evidence capture.
The gap matters because many teams still run separate tools for anomaly detection and business validation, which complicates compliance operations. Datagaps' discussion of Gartner-aligned observability tooling highlights this gap around integrating data quality validation with observability for audit readiness. In practice, bringing both into one workflow reduces handoffs and gives auditors a clearer trail of what was detected, what rule was enforced, and how the issue was addressed.
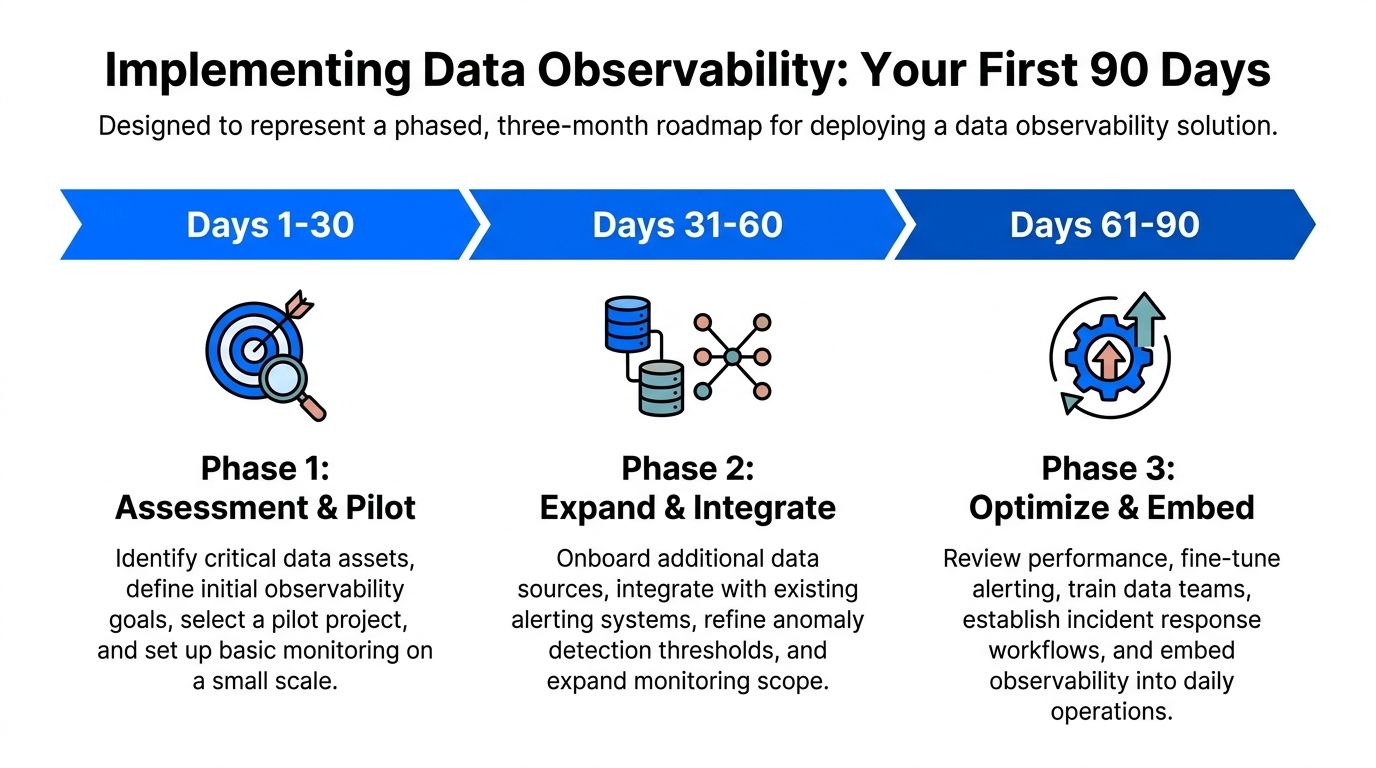
Implementing Data Observability Your First 90 Days
Failure in rollout often mirrors failure in monitoring. This occurs because the initial scope is too broad. The first ninety days should be about proving operational value on one critical slice of the data estate, then expanding with discipline.
Gartner's projected adoption trend, cited by Atlan, says 50% of enterprises with distributed data architectures will adopt data observability tools by 2026, up from roughly 20% in 2024. The takeaway isn't that every team should rush a purchase. It's that teams need an implementation strategy before complexity forces one on them.
Days 1 to 30 choose one critical flow
Pick a dataset or pipeline with three characteristics. It has visible business impact, recurring incidents, and identifiable owners. Good candidates include finance reporting feeds, customer metrics tables, core product event pipelines, or model input datasets.
During this phase:
Define business criticality: Write down who uses the data, when they use it, and what failure looks like.
Select initial signals: Start with freshness, schema, and one quality signal that reflects real risk.
Map dependencies: Establish enough lineage to identify the immediate upstream source and downstream consumers.
Agree on incident handling: Decide where alerts go and who triages first.
Don't start with every table in the warehouse. Start with one flow that everyone agrees matters.
Days 31 to 60 connect alerts to real operations
The second month is where many pilots stall. Detection exists, but nobody has integrated it into the daily operating model.
At this stage, focus on workflow:
Workstream | What good looks like |
|---|---|
Alert routing | Alerts arrive in the same channels teams already use for incidents |
Ownership | Each monitored asset has a clear primary responder |
Tuning | Obvious noise gets removed, but meaningful anomalies stay visible |
Validation | Audit-critical rules are added where business logic must be explicit |
Review cadence | Teams review incidents and false positives on a fixed rhythm |
This is also the point where staffing gaps become visible. If you're building out a data function and need to define the blend of analytics, ML, and platform skills required for long-term ownership, this startup data scientist hiring guide is a practical reference for shaping role expectations across early teams.
Days 61 to 90 prove value and standardize
By the third month, the goal is not “more dashboards.” It's evidence that the pilot changed team behavior.
Document a short set of outcomes:
Which incidents were caught earlier than before
Which alerts were noisy and how they were tuned
Which business assets gained clearer ownership
Which compliance-relevant rules now have operational visibility
Which additional domains should be onboarded next
Start with one painful pipeline, not the whole platform. Teams trust observability after the first prevented incident, not after the first architecture diagram.
From there, create a repeatable onboarding pattern. Define what metadata you require, how owners are assigned, which baseline signals are always enabled, and when custom validation rules are added. That's how data observability stops being a pilot and becomes part of normal engineering practice.
If your team needs data observability that works in private cloud or on-prem environments, digna is built for that model. It runs analyses inside customer-controlled databases, combines AI-based anomaly detection with timeliness checks, schema tracking, historical analytics, and record-level validation, and keeps production data resident in the customer environment.
For how freshness, volume, schema and quality signals come together when the analysis has to stay inside your own databases, see data platform observability with digna.
Frequently asked questions
What is data observability?
Data observability is the ability to understand the health of data across ingestion, transformation, storage and consumption, rather than relying on job-status checks. It answers whether data arrived on time, whether content or shape changed unexpectedly, and which dashboards, models and teams are affected when something goes wrong.
What are the five pillars of data observability?
Freshness, quality, volume, schema and lineage. Freshness checks timely arrival, quality checks whether values are fit for use, volume flags unexpected row-count shifts, schema tracks structural changes such as renamed columns, and lineage shows blast radius and ownership so root cause analysis becomes a directed investigation.
What is the difference between data observability and data monitoring?
Monitoring asks whether a process ran and emitted expected signals, using job status, logs and runtimes. Observability asks whether the data is reliable and, if not, what changed and what is affected. Monitoring misses many green-but-wrong scenarios, such as a task that succeeds while loading incomplete customer records.
Should data observability run in-database or in the pipeline?
It depends on your constraints. Pipeline instrumentation suits detailed visibility during streaming or transformation stages, but fragments quickly across tools. In-database execution fits better when privacy, data residency, warehouse scale and low movement of sensitive data are hard requirements, because baselines and anomaly detection run inside the customer environment.
How do you implement data observability in the first 90 days?
In days 1 to 30, pick one critical flow and start with freshness, schema and one quality signal. In days 31 to 60, route alerts to existing incident channels, assign owners and tune noise. In days 61 to 90, document incidents caught earlier and standardize a repeatable onboarding pattern.


