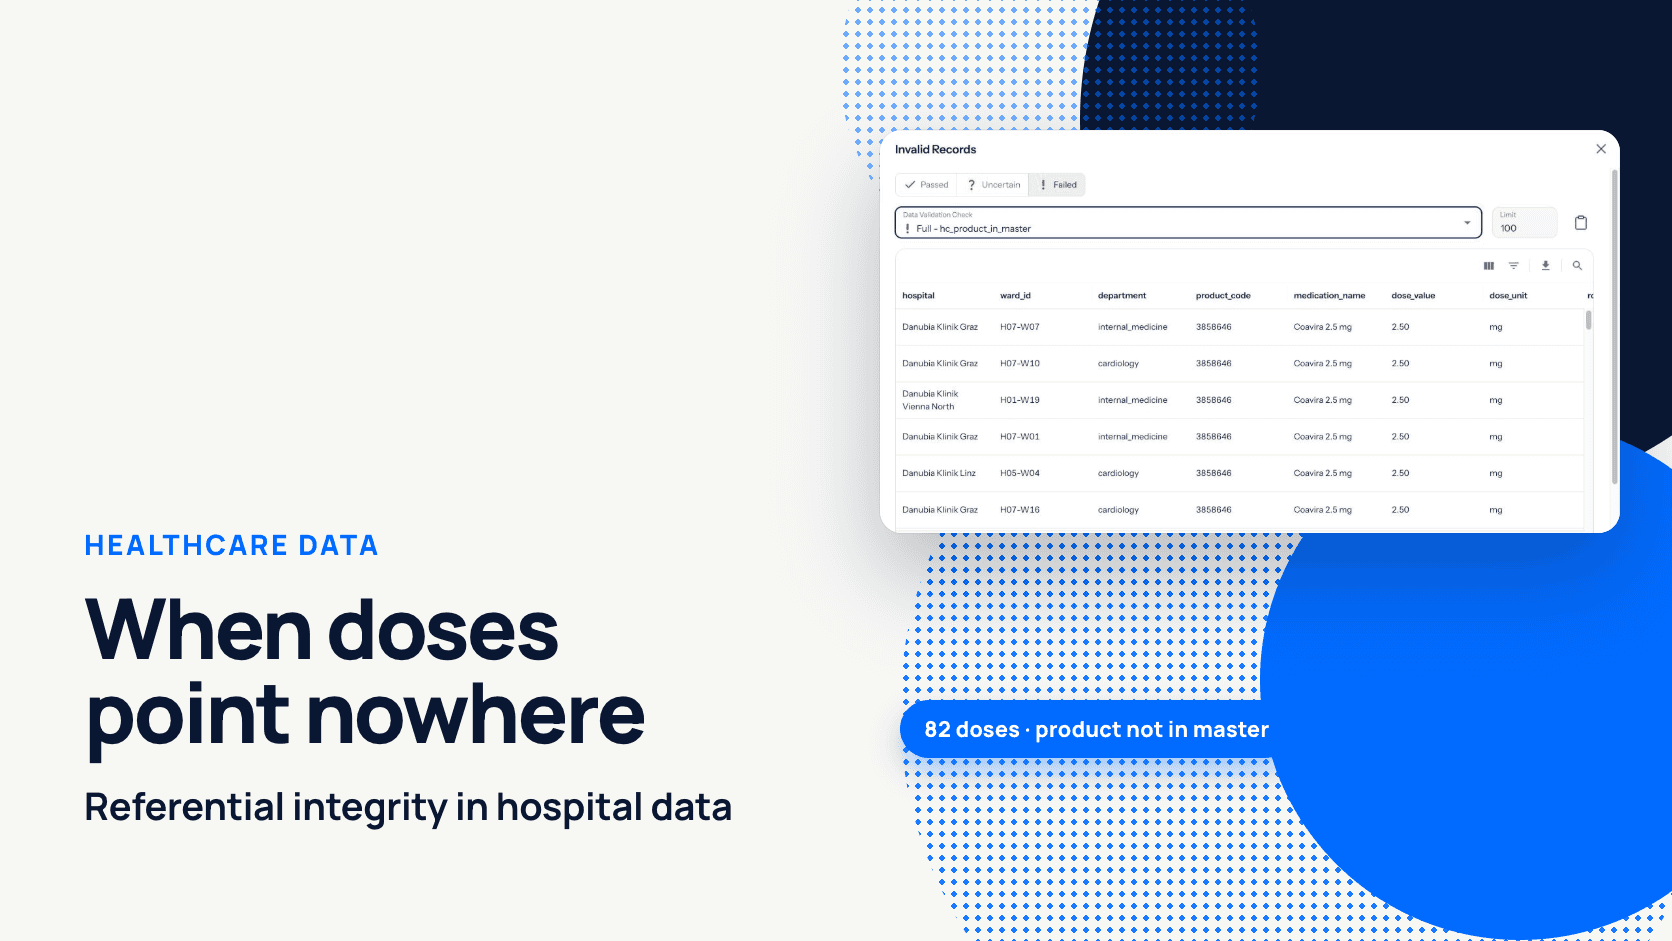
KPI Quality Control: A Practical Governance Guide
|
8
min read

A dashboard can load perfectly and still tell the wrong story. That's the uncomfortable weakness in most KPI quality control programs: teams validate whether data arrived, whether columns match a schema, and whether reports refreshed, then treat those technical passes as proof that the metric is safe to use.
They aren't. A KPI may be complete, fresh, and correctly typed while becoming strategically misleading after an acquisition, pricing change, currency movement, customer-mix shift, or denominator change. Reliable monitoring must test decision fit, not only pipeline health. That means asking whether the metric still means what leaders think it means, remains comparable with earlier periods, and supports the decision attached to it.
Table of Contents
Understanding KPI Quality Control in Modern Data Platforms
Most data teams start with operational questions: Did the job run? Did the table update? Did the dashboard query succeed? Those checks matter, but they describe the condition of the data platform rather than the reliability of the business conclusion.
A technically valid revenue-growth calculation can still mislead if an acquisition changes the population, if price increases account for the movement, or if the denominator excludes a newly relevant cohort. A customer-retention KPI can also look stable while the underlying customer definition has changed. Nothing necessarily breaks at the schema level. The failure occurs in the relationship between the metric and the decision it is meant to support.
Technical cleanliness is only the first gate
A useful KPI control system separates three questions:
Can the pipeline produce the value? Check delivery, schema, types, nulls, volume, and processing status.
Does the value mean what the definition says? Check filters, cohorts, joins, denominators, time windows, reference data, and source-of-record reconciliation.
Is the metric still useful for its intended decision? Check comparability, materiality, business context, and the assumptions leaders use when interpreting movement.
The third question is where many programs stop. Teams may alert on unusual values without deciding whether the movement reflects a defect or a legitimate operating event. That creates two opposite risks. A quiet but distorted KPI passes through, while a valid seasonal or strategic change generates noise that users learn to ignore.
A practical data observability approach should therefore connect technical signals to semantic ownership. Every critical KPI needs an approved definition, a named business owner, a source-of-record relationship, and an explanation of which decisions depend on it.
Practical rule: A passing pipeline is evidence that data moved. It isn't evidence that the business metric remained decision-fit.
Make comparability an explicit control
Start by documenting the metric's population, numerator, denominator, filters, grain, time window, currency treatment, and exclusions. Then record the events that can change interpretation, including product launches, acquisitions, pricing changes, territory redesigns, and policy updates.
The control should distinguish a calculation change from a business change. If the formula changed, the owner must assess historical comparability and version the definition. If the business changed, the owner may approve the anomaly while documenting why the KPI remains useful, or explain why a restated series, new cohort, or replacement metric is required.
This shifts KPI quality control from a collection of data tests into a decision-protection system. Engineers still monitor the machinery, but business owners validate the meaning.
The True Cost of Ignoring KPI Data Quality
Weak metric validation rarely produces a dramatic outage. More often, an incorrect value enters a planning deck, a performance review, a forecast, a compliance report, or an AI workflow. The organization then spends time debating the result, correcting downstream material, rerunning analysis, and repairing confidence in the reporting process.
Gartner reports that poor data quality costs organizations at least $12.9 million per year on average, based on 2020 research, while 59% of organizations don't measure data quality, as summarized by Docsumo's review of bad-data costs. The estimate came from a survey of 154 reference customers of 16 data-quality vendors, so it shouldn't be treated as a universal charge for every company. It does show why organizations need to connect defects to business consequences rather than treating quality as an abstract engineering score.
Build an evidence chain from defect to decision
A mature control program records more than an alert. It should preserve:
The defect, such as a missing load, invalid value, changed join, stale record, or definition mismatch.
The affected KPI, including its owner, consumers, reporting surfaces, and dependent models.
The business impact, such as a distorted forecast, delayed action, inaccurate report, or unnecessary investigation.
The remediation, including the technical change, business approval, validation evidence, and closure date.
The prevention step, such as a new rule, revised definition, lineage update, or threshold adjustment.
This chain gives finance and executive stakeholders a defensible reason to fund controls. It also helps engineering prioritize. A defect in a low-use exploratory table shouldn't receive the same response as a defect affecting regulatory reporting, revenue management, or an executive KPI.
The financial case extends beyond data teams. A 2025 IBM Institute for Business Value report found that 43% of chief operating officers identified data-quality issues as their most significant data priority, with more than one-quarter of organisations estimating annual losses above USD 5 million from poor data quality. The figures are reported in IBM's analysis of poor data quality, which frames the issue as an operational concern rather than a narrow platform problem.
Teams evaluating the commercial impact can also use fixing bad data for revenue as a practical reference for connecting unreliable data with revenue processes. The useful question isn't, “How many records failed?” It's, “Which decisions did those records influence, and what did the organization do because the KPI was wrong?”
Measure quality and consequence together
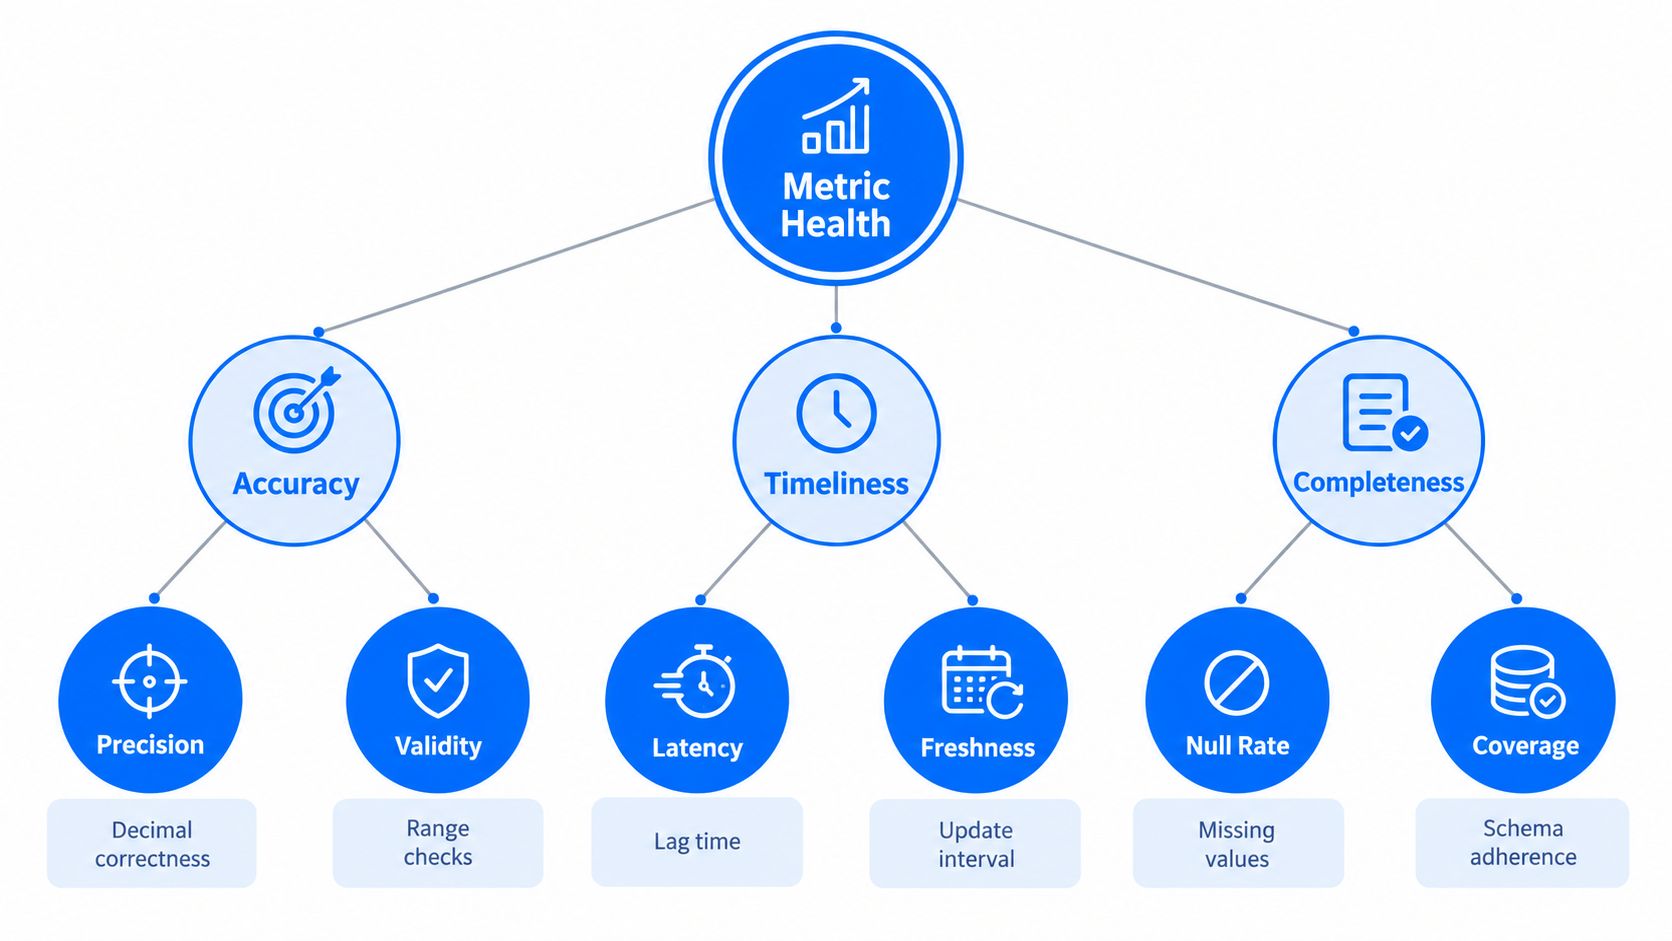
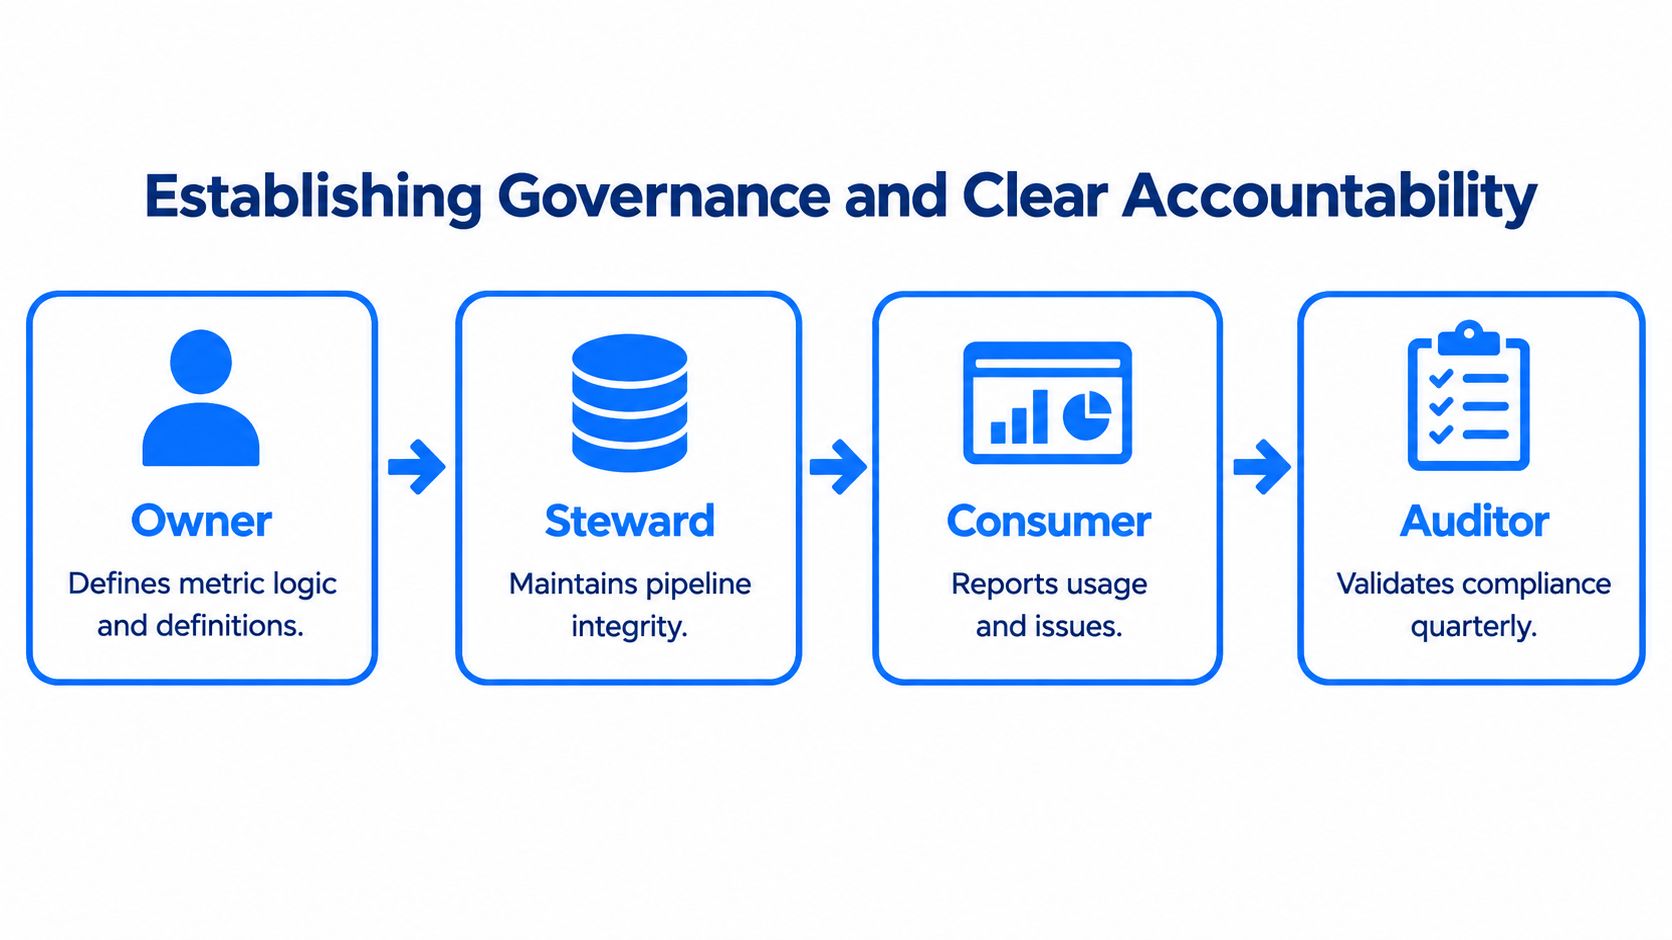
Track dimensions such as accuracy, completeness, consistency, validity, timeliness, uniqueness, and relevance. Then pair them with operational measures such as incident severity, affected reports, remediation latency, recurrence, and accepted-versus-defective anomaly decisions.
A single composite score hides trade-offs. High completeness can coexist with low accuracy. Excellent freshness can coexist with a broken business definition. Separate dimensions make the failure diagnosable and let owners choose controls according to materiality.
For executives who need a concise business case, digna's data quality business case guidance can support the conversation. The strongest argument is usually an auditable connection between a data defect, a distorted KPI, a delayed or incorrect decision, and a control that reduces the chance of recurrence.
Core Dimensions of Reliable Business Metrics
A KPI shouldn't receive one pass or fail label and then disappear into a dashboard. Quality is multidimensional, and each dimension requires a different test. A column can conform to its declared type while carrying the wrong business meaning. A complete dataset can still contain incorrect values.
Separate syntax, meaning, and usefulness
ISO 8000-1:2022 defines quality concepts that can be operationalized through controls: syntactic quality concerns conformity to an approved format, semantic quality concerns whether values represent their intended meaning, and pragmatic quality concerns whether data is fit for the intended users and decisions. The framework is summarized in the ISO 8000 overview.
Apply those concepts directly:
Quality layer | What it tests | Practical KPI control |
|---|---|---|
Syntactic | Whether data follows the approved structure | Schema, type, format, and permitted-value checks |
Semantic | Whether values represent the intended concept | Definition, join, cohort, denominator, and reference-data validation |
Pragmatic | Whether the KPI supports its intended decision | Owner acceptance, comparability review, materiality, and decision-use tests |
Syntactic checks are usually the easiest to automate. Validate that dates are dates, identifiers follow the expected pattern, numeric fields stay within acceptable formats, and required columns exist. These checks catch structural failures early, but they can't determine whether “active customer” still uses the approved business definition.
Semantic checks need stronger documentation. Reconcile KPI totals with the relevant source of record, test numerator and denominator populations independently, and compare results across approved cohorts and time windows. If a metric uses reference data, monitor changes to that reference data as carefully as changes to the fact table.
Pragmatic checks belong to the people who use the metric. The business owner should confirm whether the KPI remains fit for planning, pricing, risk, operations, or compliance decisions. This is also where legitimate anomalies receive context instead of being automatically suppressed.
Treat completeness and validity as different controls
The UK Government Data Quality Framework distinguishes completeness from validity. Completeness asks whether required records and essential fields are present. Validity asks whether values fit expected ranges and formats. The framework explicitly warns that complete data isn't necessarily accurate.
That distinction changes how teams design tests:
Coverage checks identify missing records, periods, entities, or source feeds.
Required-field checks identify absent values in fields needed for calculation.
Validity checks enforce formats, ranges, allowed values, and type expectations.
Accuracy checks reconcile values with a trusted source or business process.
Consistency checks compare the same concept across systems, products, and reporting layers.
Timeliness checks compare arrivals with expected delivery behavior, not only a fixed clock time.
Use digna's dimensions of data quality as a reference when translating these categories into a monitoring inventory. The important design choice is to keep the dimensions visible. A single “healthy” badge can conceal the exact weakness that invalidates a decision.
Establishing Governance and Clear Accountability
The hardest part of KPI quality control isn't writing a validation rule. It's deciding who acts when the rule fires, who can accept an anomaly as legitimate, and who must prove that the metric is safe to publish again.
Actian's 2025 survey of more than 600 enterprise data professionals found that 83% faced governance and compliance challenges, even though organizations rated their governance maturity 4.13 out of 5, with executives rating data maturity 12% higher than practitioners. These findings are reported in Actian's governance maturity survey. The gap points to a practical problem: leadership confidence can rise faster than operational clarity.
Put ownership into the metric contract
For every critical KPI, record:
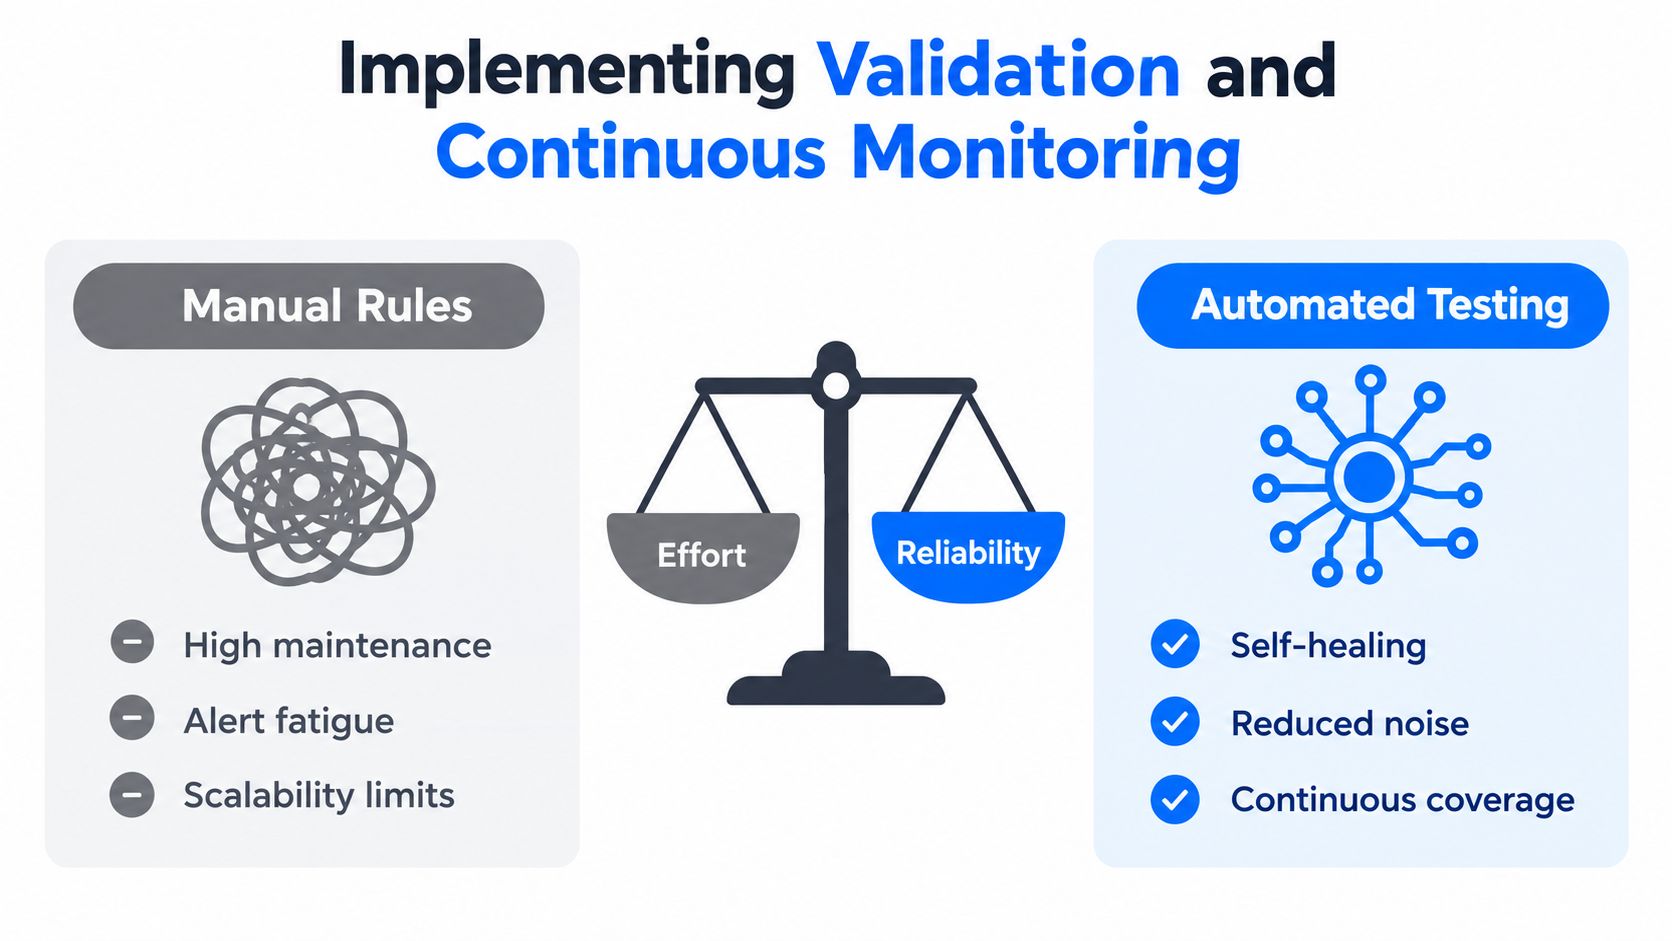
Business owner: Defines what the metric means, approves interpretation, and decides whether it remains fit for purpose.
Technical owner: Maintains pipelines, transformations, tests, and dependencies.
Data steward: Maintains definitions, reference data, lineage, and documentation.
Consumer: Reports unexpected behavior and explains how the KPI is used.
Auditor or control reviewer: Verifies evidence, approvals, and remediation history.
The owner must also approve a materiality threshold. A minor variation may require observation, while a sharp movement in a regulatory, financial, or operational KPI may require publication holds and executive escalation. Thresholds should reflect decision impact, not only statistical unusualness.
Design the incident record before the incident
A useful incident record captures the detected condition, affected period, current definition version, source changes, severity, owner, decision impact, disposition, remediation, and evidence of revalidation. It should distinguish three outcomes:
Technical defect, where the source or transformation is wrong.
Semantic defect, where the calculation no longer matches the approved meaning.
Legitimate event, where the business changed and the KPI correctly reflects that change.
Manual rules remain valuable for stable, high-consequence assertions. They become expensive when teams write separate thresholds for every table, cohort, and reporting context, then tune them after every normal business change. Automated baselines can reduce maintenance and surface unknown drift, but they don't replace business approval. An anomaly detector can say “unusual.” It can't decide whether a new pricing policy makes the movement correct.
Use digna's data quality governance resource when shaping the operating model. The essential outcome is measurable accountability, including time to triage, time to remediation, closure evidence, recurrence, and the proportion of alerts that owners classify as valid business events.
An effective governance program makes disagreement visible. If executives see maturity in a score while practitioners lack owners and escalation paths, the control environment isn't mature yet. It's documented but not operational.
Implementing Validation and Continuous Monitoring
Hand-crafted rules are precise, but they don't scale indefinitely. They work well for contractual conditions, regulatory requirements, and known business logic. They work poorly as the sole method for discovering unexpected behavior across a large, changing estate of pipelines.
Combine deterministic and behavioral controls
Deterministic validation asks whether a value or record satisfies an explicit condition. Examples include:
An order must reference an existing customer.
A transaction date must fall within an allowed reporting period.
A KPI denominator must not be zero.
A regulated field must use an approved code.
A required business event must arrive before the dependent aggregation runs.
These rules are explainable and auditable. They also demand maintenance. Business definitions change, source systems evolve, and exceptions multiply. Without ownership, rule collections become brittle and alert volumes rise until engineers stop trusting them.
Behavioral monitoring takes a different approach. It learns the normal pattern for a dataset, delivery schedule, volume profile, or business KPI, then highlights unusual movement. This is useful for unknown failures, gradual drift, unusual volatility, missing loads, and changes that nobody anticipated when the original rules were written.
The trade-off is interpretability. A fixed rule can explain exactly why a row failed. A behavioral alert may identify a meaningful departure without identifying its cause. That's why the strongest architecture combines both methods instead of treating them as competitors.
Keep sensitive data in place
For enterprise environments, monitoring architecture matters as much as detection logic. Executing metric computation and record-level checks inside the customer's own databases can reduce data movement and support security requirements. It also lets teams validate warehouse and lake data where it already lives, rather than building additional extraction paths for observability.
A practical implementation sequence looks like this:
Start with critical KPIs, their source tables, definitions, owners, and business decisions.
Add deterministic checks for known correctness, compliance, and reconciliation conditions.
Establish behavioral baselines for volume, freshness, distributions, and KPI movement.
Route alerts by ownership, not to a shared channel with no accountable responder.
Review alert outcomes, then tune thresholds, definitions, and severity based on actual decisions.
The data validation, rules, checks, and continuous quality guidance is useful for organizing this combination of record-level validation and continuous monitoring. The platform choice matters less than the operating discipline. Every alert needs a consumer, a decision path, and a record of what happened next.
Manage alert sensitivity as an operational budget
High sensitivity catches more potential failures, but it also creates more noise. Low sensitivity protects attention, but it can miss gradual or low-volume defects. Set severity according to business impact, then review false positives and missed incidents as part of the control program.
Don't automatically suppress unusual movement. First ask whether the event is real, whether the definition still applies, and whether the affected decision requires a restated metric. Statistical detection should trigger investigation, not overwrite accountability.
Designing Effective Remediation Workflows
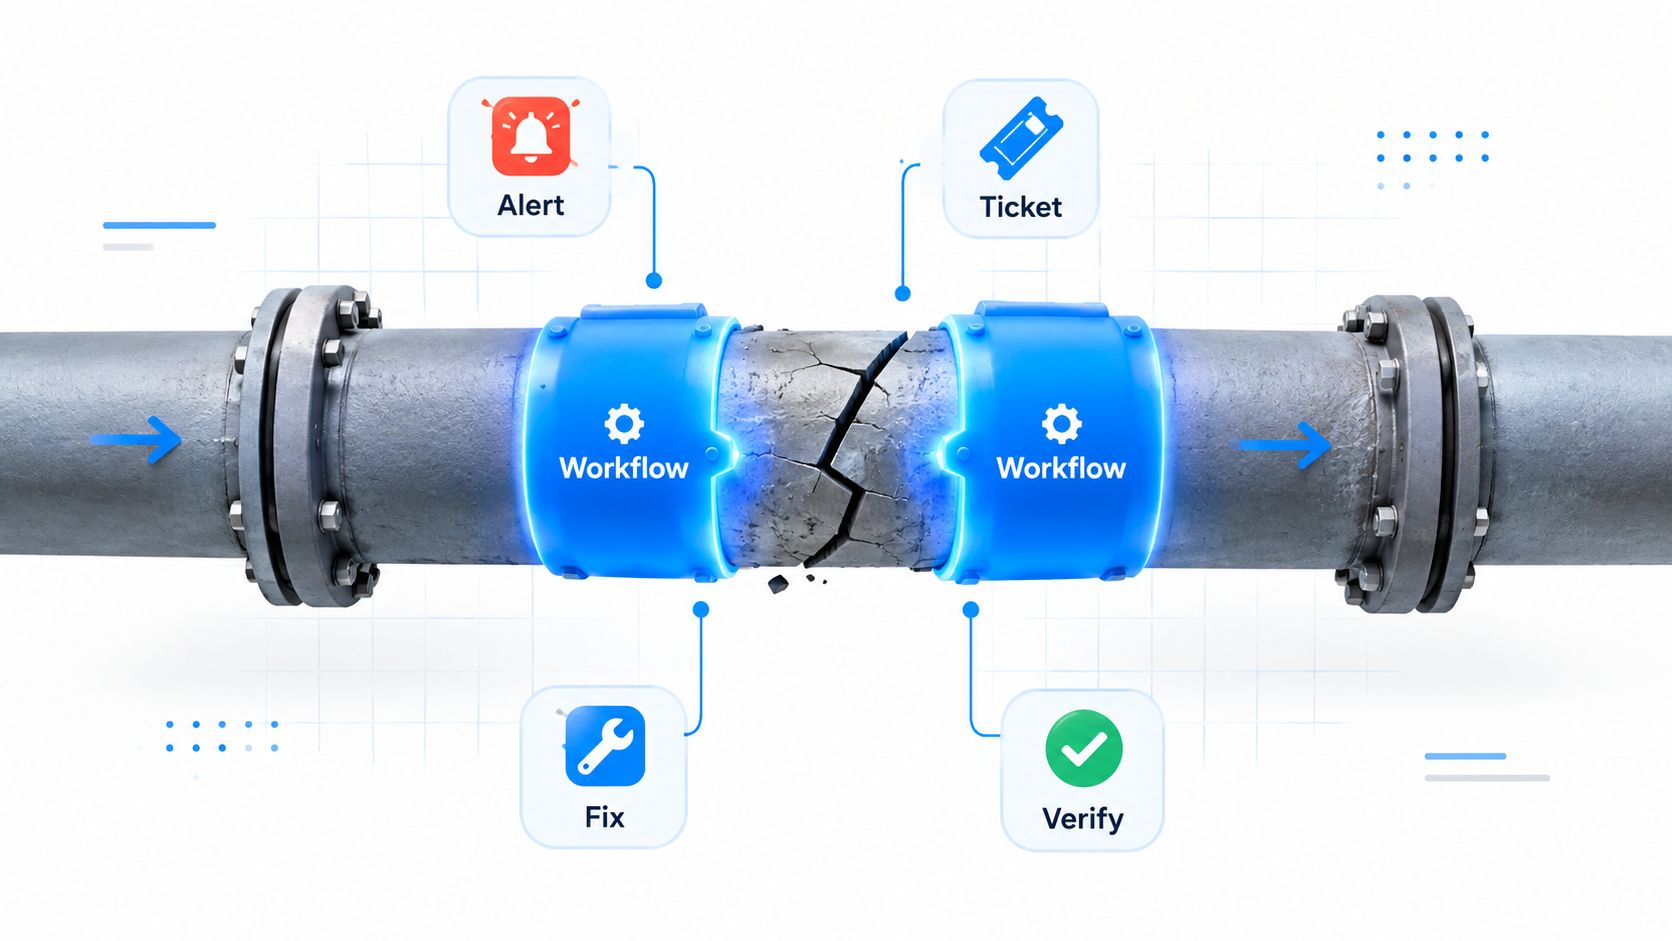
Detection without response is expensive telemetry. A useful workflow turns a failed check into an accountable decision, with enough evidence for another person to understand what happened without reconstructing the entire investigation.
Separate technical repair from semantic review
A broken pipeline and a changed business meaning need different responders. An engineer can repair a failed transformation, but a business owner must decide whether a new customer segment belongs in the KPI population. Routing both incidents to the same queue slows recovery and obscures accountability.
Use a common workflow with different decision branches:
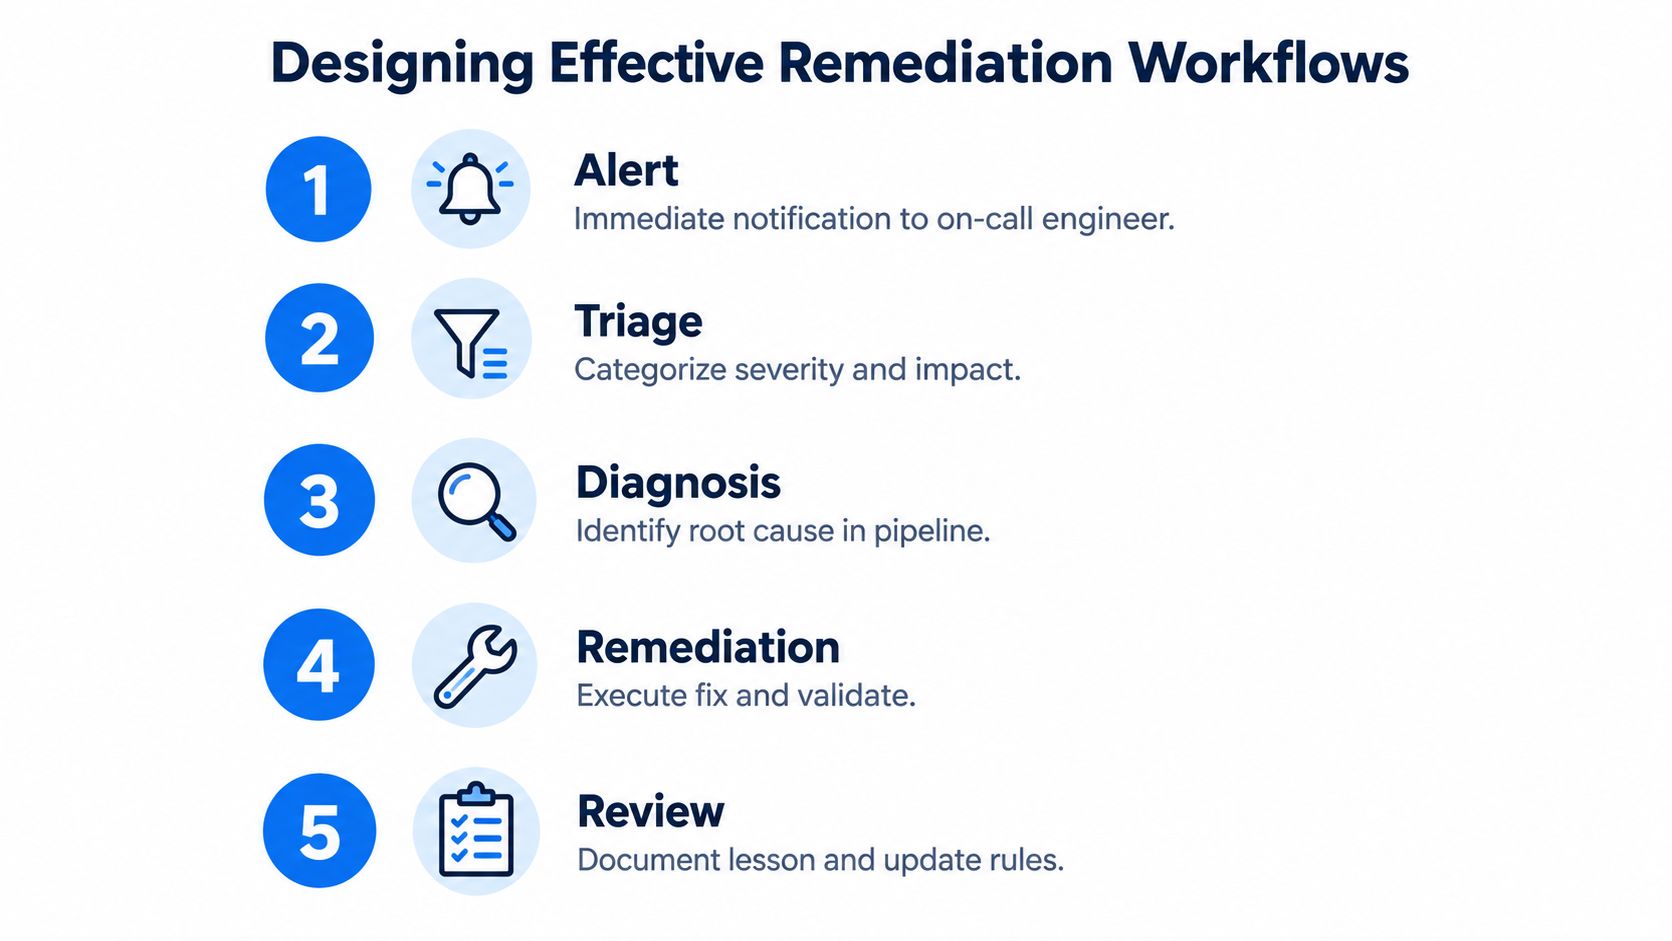
Alert: Capture the failed control, affected KPI, data interval, and detection context.
Triage: Classify severity, affected consumers, decision impact, and whether publication should pause.
Diagnosis: Trace the issue through source systems, transformations, reference data, definitions, and recent business changes.
Remediation: Correct the source or logic, restate the metric if required, and validate downstream outputs.
Review: Record the root cause, owner decision, evidence, recurrence prevention, and closure.
The owner should explicitly record when an anomaly is accepted as legitimate. That approval protects the organization from repeatedly reopening a known business event, while preserving the reasoning for auditors and future analysts.
Track correction obligations as service targets
Personal data introduces a concrete operational requirement. Under Article 5 of the GDPR, personal data must be accurate and, where necessary, kept up to date. Organizations must take reasonable steps to rectify or erase inaccurate data without delay, while also limiting data to what is necessary for the purpose and retaining it only as long as necessary. The regulation is available through the EUR-Lex GDPR text.
The European Commission's guidance on individual requests states that when an individual asks an organisation to correct inaccurate personal data, the organisation must act without undue delay, in principle within one month, or provide a written explanation for refusing the request. For KPI governance, that creates a measurable target for incidents involving personal data.
Track the full lifecycle:
Workflow field | Operational question |
|---|---|
Intake | When was the defect or correction request received? |
Ownership | Who is accountable for the decision and fix? |
Scope | Which records, KPIs, reports, and AI outputs are affected? |
Remediation | What changed, and was the source corrected or only the report? |
Verification | What evidence proves the correction worked? |
Closure | Was the incident resolved within the applicable expectation? |
A strong workflow doesn't promise that every incident is simple. It ensures that complexity doesn't erase ownership.
Building a Resilient KPI Quality Strategy
A resilient KPI quality strategy grows with the organization instead of attempting to model every possible failure on the first day. Begin with metrics that drive material decisions, then expand coverage as owners, definitions, and incident routines mature.
The platform should support multiple control types without forcing teams to rebuild their operating model for each one. Business monitoring, timeliness, schema tracking, record-level validation, anomaly detection, and historical analysis address different failure modes. They should still produce a common incident record and shared ownership model.
Scale in layers
A practical progression is:
Foundation: Define critical KPIs, owners, source systems, populations, denominators, and decision use.
Reliability: Monitor freshness, volume, completeness, validity, schema changes, and source reconciliation.
Meaning: Version definitions, test cohorts and filters, document business events, and require owner acceptance.
Response: Add severity, routing, remediation deadlines, evidence retention, and closure reporting.
Optimization: Analyze recurring incidents, alert precision, decision impact, and control coverage.
In-database execution can help teams monitor sensitive data without creating unnecessary movement. Modular deployment also lets an organization start with a focused capability, such as anomaly detection or timeliness, then extend into business rules and schema monitoring as the control program proves its value.
The right measure of maturity isn't the number of checks configured. It's whether teams can answer, quickly and with evidence, four questions: What changed? Does the KPI still mean what we think it means? Who decides what happens next? How do we know the issue is closed?
Treat KPI quality control as a standing business control, not a dashboard feature. Engineers protect the data path, business owners protect meaning, and governance teams make the evidence reusable across reporting, compliance, and AI. That division of responsibility is what keeps a clean-looking metric from becoming a costly wrong decision.
digna provides modular data observability for anomaly detection, timeliness, record-level validation, schema changes, and business KPI monitoring inside your own environment. Use digna to connect technical controls with decision-fit validation, accountable incident workflows, and evidence your data and business teams can act on.
If your critical KPIs need continuous oversight next to the data that feeds them, see how business monitoring with digna watches metric movement and routes unusual changes to accountable owners.
Frequently asked questions
What is KPI quality control?
KPI quality control is the practice of checking that a business metric is not only technically correct but still fit for the decision it supports. It combines pipeline checks such as schema, nulls and volume with semantic tests of definitions, denominators and cohorts, plus owner review of comparability.
Why can a KPI be misleading even when the data pipeline passes all checks?
Because a passing pipeline only proves that data moved. A revenue-growth KPI can be complete, fresh and correctly typed yet mislead after an acquisition changes the population, a price increase drives the movement, or the denominator quietly excludes a newly relevant cohort. Nothing breaks at the schema level.
Who should own the quality of a KPI?
Ownership is shared, but the business owner has the final say on meaning. The guide recommends recording five roles for every critical KPI: a business owner who approves interpretation, a technical owner for pipelines and tests, a data steward for definitions and lineage, consumers who report issues, and an auditor.
What is the difference between syntactic, semantic and pragmatic data quality?
ISO 8000-1:2022 separates the three. Syntactic quality checks conformity to an approved format, such as schema and permitted values. Semantic quality asks whether values represent the intended concept, tested through joins, cohorts and denominators. Pragmatic quality asks whether the KPI still supports its intended decision, confirmed by the business owner.
Should KPI anomalies be suppressed automatically?
No. An anomaly detector can flag movement as unusual, but it cannot decide whether a new pricing policy makes that movement correct. Investigate first: is the event real, does the definition still apply, and does the decision need a restated metric? Owners should then record accepted anomalies as legitimate business events.