Dimensions of Data Quality: The 9 Core Metrics Explained
|
10
min read

Data quality is defined by nine standard dimensions in the DAMA-DMBOK® 2.0 Revised Edition, not by one universal score. A dataset serves its intended purpose only when the relevant dimensions, such as accuracy, completeness, consistency, currency, integrity, timeliness, uniqueness, validity, and reasonableness, meet the needs of its users.
The counterintuitive part is that accurate data can still be unusable. A customer record may match reality but arrive after a campaign decision, or a complete table may contradict the source systems that business teams rely on. Data quality is the measure of how well data serves its intended purpose, evaluated across multiple distinct dimensions rather than a single score.
Table of Contents
Defining Data Quality in Modern Data Stacks
Data quality describes whether data is fit for a specific business, analytical, operational, or regulatory purpose. A finance team may require highly accurate and consistent transaction data for reporting, while an operations team may care more about whether events arrive on time and whether every required record is present. Neither team can define quality independently of the decision the data supports.
Treating quality as one number hides these differences. A warehouse table might pass an accuracy review while containing missing records, stale values, duplicated customers, or invalid formats. A single aggregate score can also let a serious failure disappear behind strong performance in unrelated areas.
Why one score fails
Data quality is a multidimensional construct. Reviews identify accuracy, completeness, consistency, timeliness, and relevance among the most frequently cited dimensions, while broader frameworks include validity, uniqueness, believability, interpretability, and security. The practical consequence is straightforward: map each control to the failure mode it is intended to prevent, rather than asking whether a dataset is “good” or “bad” (review of data quality dimensions).
For a data engineer, that means checking whether required loads arrived, whether values conform to types and ranges, and whether records agree across systems. For an analyst, it may mean confirming that a metric has a stable definition and a dependable refresh pattern. For a business owner, the central question is whether the data supports a decision without creating unacceptable risk.
Practical rule: Start with the decision, then define the dimensions that can make that decision fail.
Modern stacks make this context harder to manage because data moves through databases, APIs, ETL and ELT pipelines, warehouses, dashboards, and AI feature stores. Each handoff can introduce a different defect. A source system may enforce a field as mandatory while a downstream transformation turns it into a nullable column, or a late event may be technically valid but irrelevant to a time-sensitive dashboard.
Teams working across cloud warehouses and enterprise integrations may also benefit from understanding how implementation partners approach platform architecture. For example, Faberwork LLC's Snowflake partnership provides useful context for organizations designing data platforms where quality controls must operate across ingestion, transformation, and consumption layers.
The 9 Dimensions of Data Quality Framework
What are the 9 dimensions of Data Quality? The DAMA-DMBOK® 2.0 Revised Edition identifies nine standard dimensions with broad agreement: Accuracy, Completeness, Consistency, Currency, Integrity, Timeliness, Uniqueness, Validity, and Reasonableness. The revision adds Currency to the earlier eight-dimension set and uses Reasonableness instead of Reasonability (DAMA-DMBOK® 2.0 revision details).
Use the table as a working reference, not as a substitute for business context. Each dimension describes a different way data can fail.
Dimension | Definition | Enterprise Example |
|---|---|---|
Accuracy | Data correctly represents the real-world entity, event, or value it describes. | A customer's postal address matches the address held in a trusted operational source. |
Completeness | Required records, fields, and values are present for the intended use. | Every approved financial transaction includes an account identifier, amount, and posting date. |
Consistency | Data does not conflict across systems, tables, records, or defined business rules. | The warehouse and billing database classify the same account with the same customer status. |
Currency | Data reflects the current state of the real-world object or process. | An inventory record reflects the latest known stock position rather than an older state. |
Integrity | Relationships between data elements remain valid and logically coherent. | Every order line references an existing order and product record through valid relationships. |
Timeliness | Data becomes available within the period appropriate for its intended use. | A risk dashboard receives the required transaction feed before the business review begins. |
Uniqueness | Each real-world object appears only once where duplication would distort the use case. | A customer master contains one governed record for each customer entity. |
Validity | Values conform to their defined type, format, range, domain, or rule. | A transaction status belongs to the permitted status set and an amount uses the expected numeric type. |
Reasonableness | Values and relationships are plausible in context and do not violate expected business behavior. | A sales quantity is technically valid but is flagged because it is implausible for the product and order context. |
The distinctions matter during diagnosis. A missing customer identifier is a completeness problem, while an identifier with an invalid format is a validity problem. A duplicated customer is a uniqueness issue, while a customer linked to the wrong account may indicate an integrity or accuracy failure.
For implementation, pair each dimension with a metric and an action. A completeness check can count missing required values, a uniqueness check can identify unexpected duplicates, and a validity check can test data types, formats, classes, and ranges. Teams looking for additional practical measures can use these data quality metrics examples as a starting point for designing their own controls.
How Dimensions Interact and Create Trade-offs
Data quality dimensions do not operate independently. Improving one can make another harder to maintain, especially when pipelines have fixed delivery windows or uneven source quality.
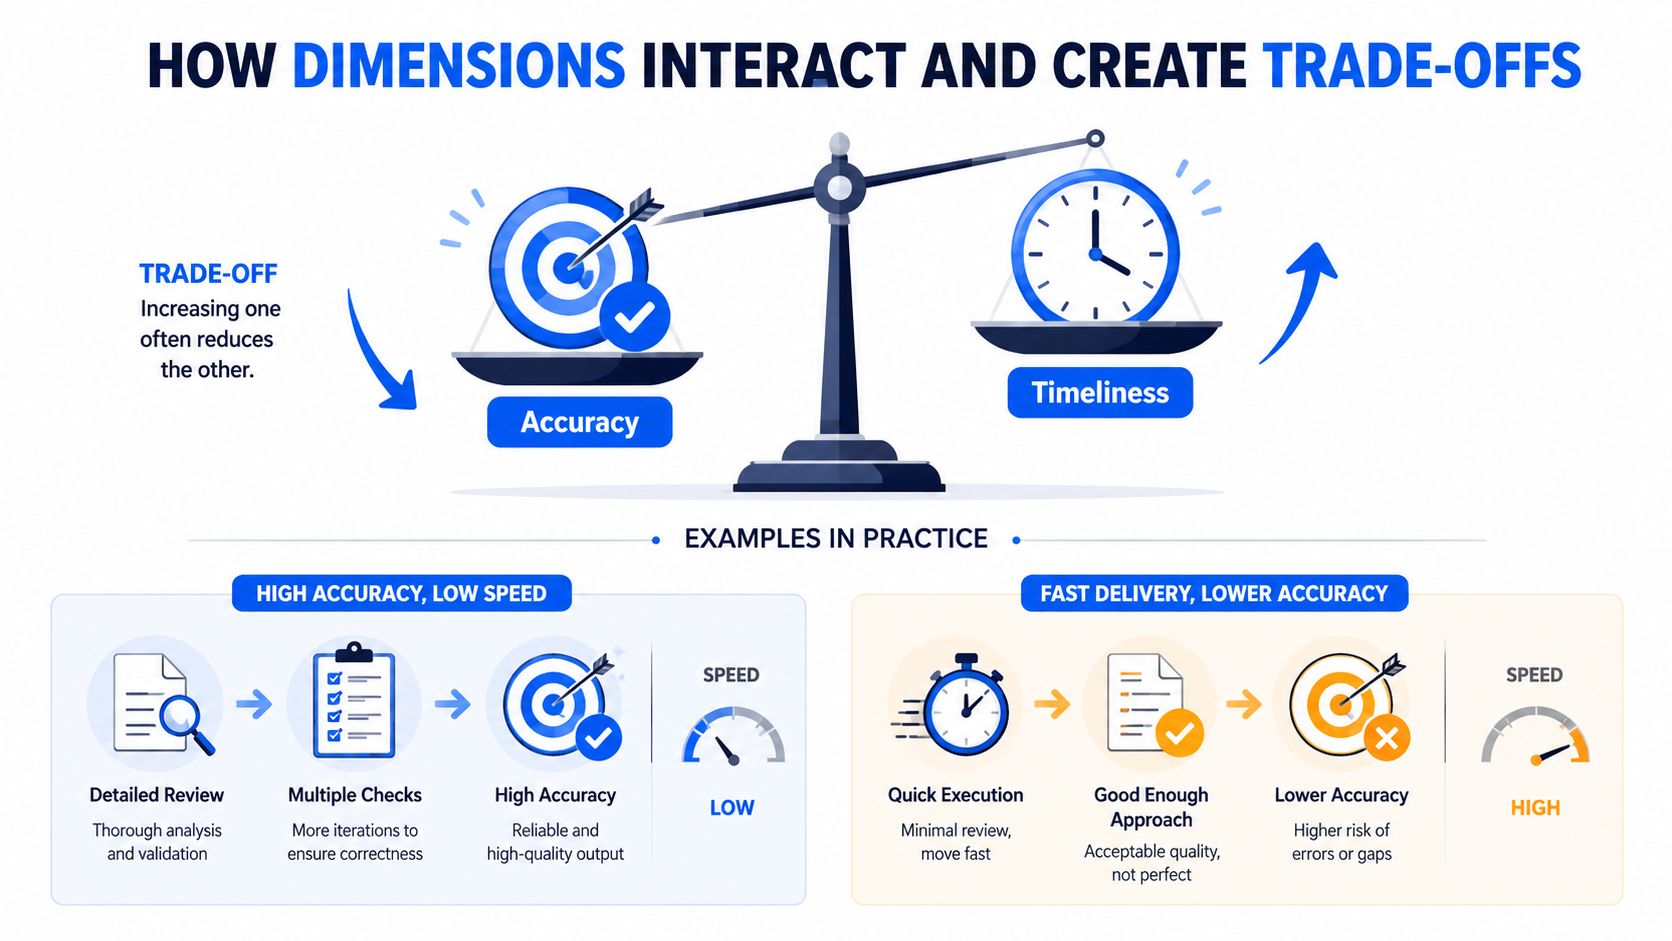
Consider a warehouse load receiving customer transactions throughout the day. An engineering team can delay publication until reconciliation resolves discrepancies, improving accuracy and consistency. The delay may cause a dashboard to miss its decision window, reducing timeliness and currency. Publishing immediately preserves freshness but can expose incomplete or conflicting records.
Common conflicts in production
Accuracy versus timeliness is the clearest trade-off. A regulatory report may justify holding data until reconciliation finishes, while a fraud-monitoring workflow may need an imperfect but immediate signal. Choose based on the consequences of waiting and of acting on provisional data.
Validity versus completeness can conflict during ingestion. A strict rule may reject malformed values and protect downstream consumers from invalid data. Rejection can leave the target table incomplete unless the pipeline quarantines records, reports the failure, and provides a correction path.
Consistency versus source autonomy creates another tension. Standardizing customer status across a CRM, billing platform, and warehouse improves consistency, but each system may use that field for a legitimate local purpose. A governed canonical definition, paired with documented system-specific attributes, can work better than forcing uniformity everywhere.
A financial-services pipeline will usually prioritize accuracy, consistency, completeness, and integrity for business-critical reporting. An e-commerce personalization feed may prioritize timeliness and currency, while allowing controlled late-arriving enrichment. Neither priority set applies to every use case.
Architecture also changes the trade-off. Batch pipelines can hold a full delivery for reconciliation, while streaming systems often publish provisional events and correct them later. Those corrections require consumers to understand updates, retractions, and record state.
A useful quality target is not “perfect data.” It is data reliable enough for a defined decision, with known exceptions and accountable owners.
Monitor dimensions separately. A dataset can be accurate but late, or complete but inconsistent across source systems. One aggregate score can hide the failure that matters most. Separate metrics show the trade-off instead of averaging it away.
From Static Rules to AI-Driven Observability
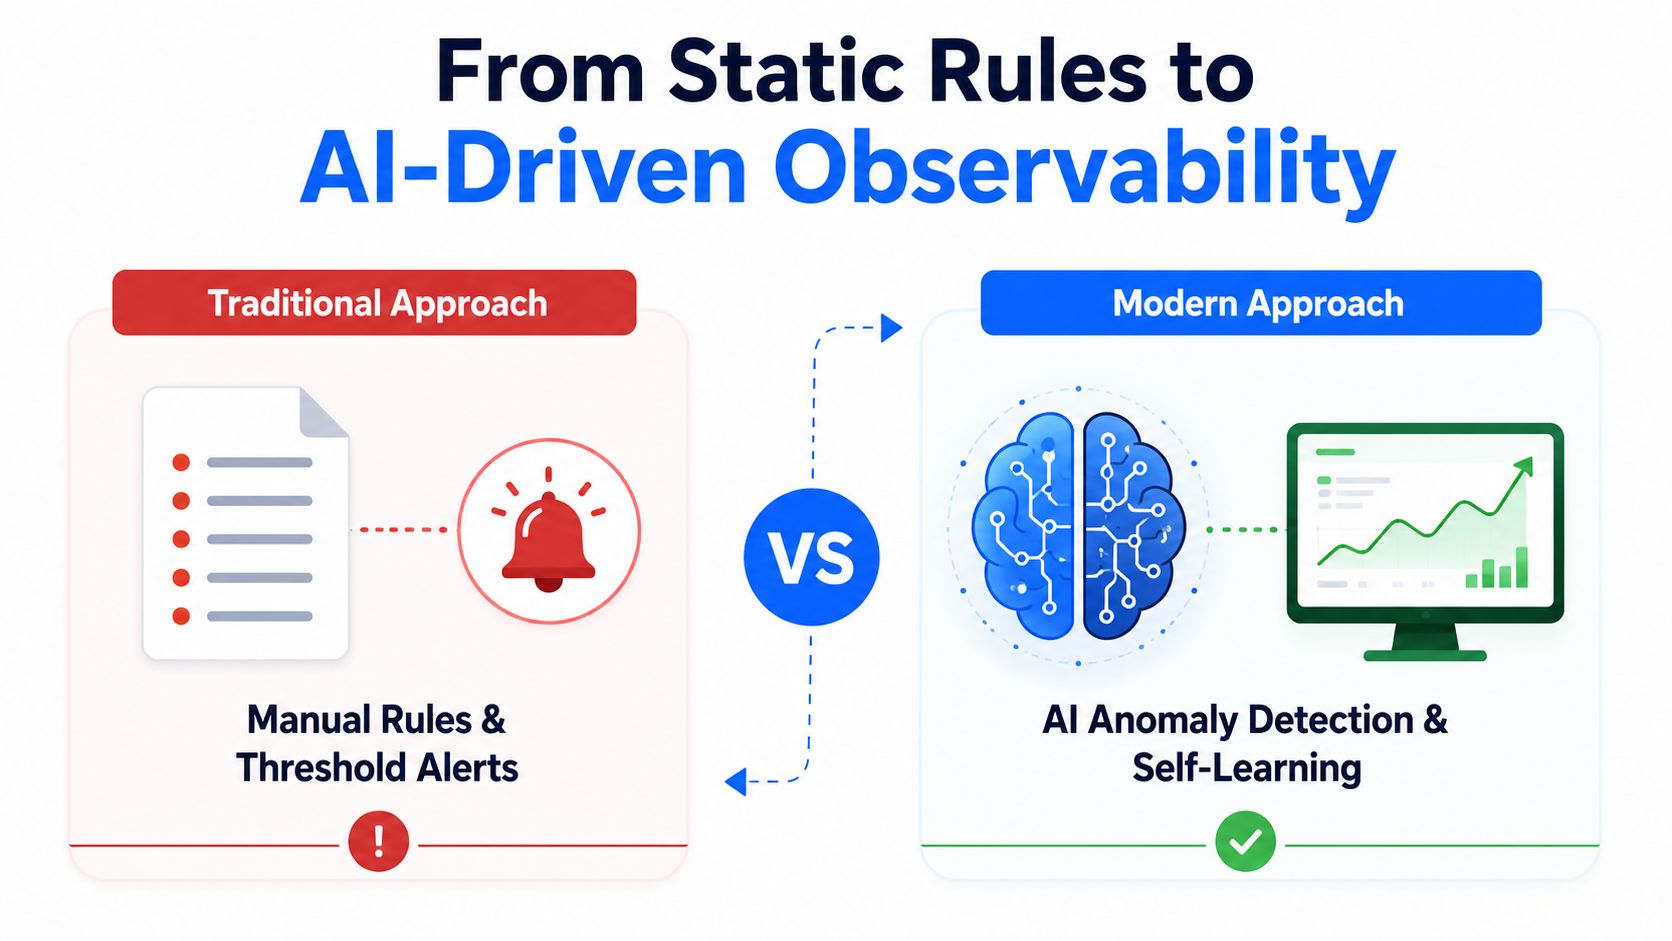
Traditional data quality monitoring depends on hand-written SQL tests, fixed thresholds, and alerts configured for known failure modes. These controls remain valuable. A rule that requires a non-null account identifier or rejects an invalid status is explicit, auditable, and easy to explain.
The weakness appears at scale. Engineers must maintain rules as schemas, sources, business processes, and acceptable ranges change. Fixed thresholds can also create alert fatigue when normal seasonal or operational variation repeatedly triggers warnings. Rule-based checks detect what teams anticipated, but they may miss unusual shifts in distributions, volumes, or relationships that nobody encoded.
What observability adds
Modern observability combines deterministic controls with historical baselines, anomaly detection, lineage context, and incident workflows. Instead of asking only whether a hard-coded threshold was crossed, the platform can assess whether current behavior differs from the dataset's established pattern.
That approach is especially useful for metrics such as row counts, value distributions, null behavior, and delivery timing. It doesn't eliminate business rules. It complements them by covering unexpected behavior that static validation may not anticipate. Teams exploring AI observability can also review Doczen's explanation of AI observability for context on monitoring AI-related systems and data behavior.
The market is also extending beyond structured warehouse tables. A 2025 industry study reported that 62% of organizations were exploring semi-structured data, 28% were actively using it, and 60% were evaluating unstructured documents (2025 data observability trends). The same source reported observability maturity of 88% in North America compared with 47% in Europe, showing that adoption is uneven across regions.
Logs, documents, event streams, and multimodal AI corpora require different interpretations of completeness and consistency. For a document collection, completeness may involve expected files, extractable fields, or usable text. For an event stream, timeliness may depend on arrival patterns rather than a daily table refresh.
Teams can use digna's data observability overview to understand how continuous monitoring fits alongside validation, anomaly detection, timeliness tracking, and schema monitoring. A strong design keeps explicit rules for known requirements and uses learned behavior to identify deviations that deserve investigation.
Selecting the Right Dimensions for Your Use Case
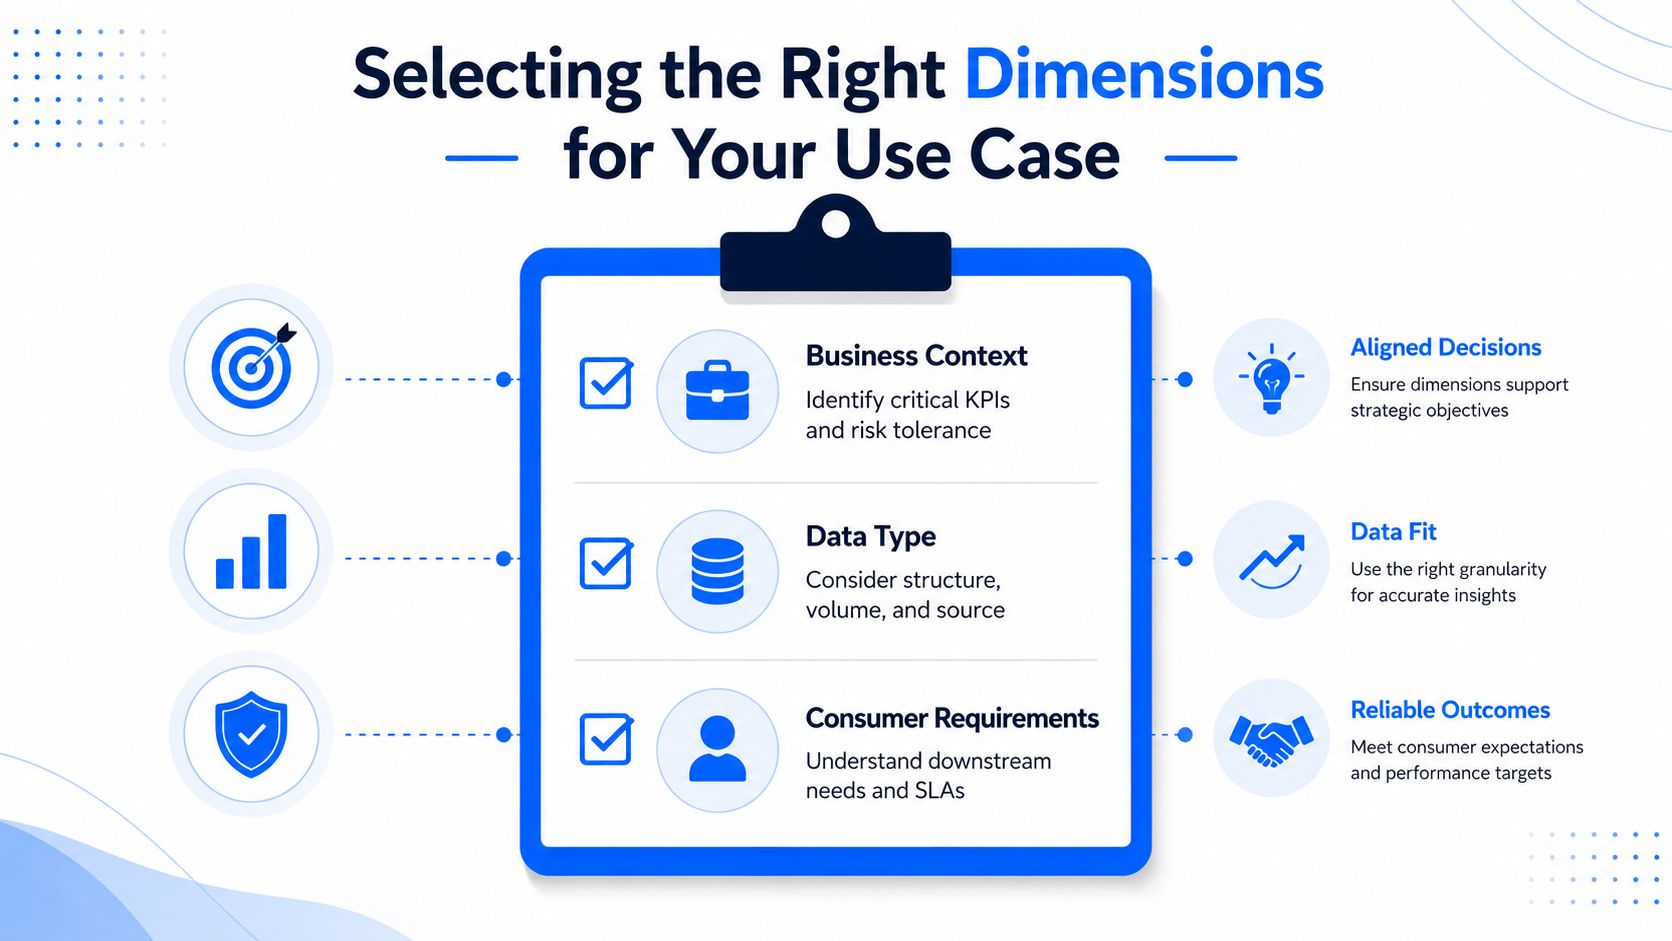
How should a team choose among the dimensions of data quality? Start with the business decision, identify the data elements that influence it, understand how the data moves through the architecture, and then prioritize the failure modes with the greatest operational, regulatory, or financial consequences.
A 2025 survey argues that the field is broader and more context-specific than a static checklist. It adds dimensions such as accessibility, compliance, reputation, portability, and currentness, while pointing out that practical guidance on trade-offs and priority-setting remains limited (survey of data quality dimensions).
A practical prioritization method
Regulatory reporting usually starts with accuracy, completeness, consistency, and integrity. The team should identify the source of record, reconcile key totals, validate permitted values, and preserve evidence of exceptions. Timeliness still matters, but the acceptable delivery window may be defined by the reporting process rather than real-time operations.
Real-time analytics puts more weight on timeliness and currency. A dashboard showing current operational conditions can become misleading when the feed is delayed, even if every delivered record is accurate. Completeness and consistency remain important, particularly when users compare live metrics with historical warehouse data.
AI and machine-learning feature stores need strong validity, uniqueness, timeliness, and integrity controls. Invalid feature values can break transformations or distort predictions, duplicates can overweight entities, and stale features can misrepresent current behavior. The appropriate checks should follow the model's feature definitions and serving expectations.
Critical Data Elements, or CDEs, deserve broader coverage than low-risk attributes. A CDE might support a regulatory report, customer identity process, financial calculation, or model feature. Monitor several relevant dimensions for it, assign an accountable owner, and define what happens when a check fails.
A useful first pass looks like this:
Map the consumer: Identify who uses the data and what decision depends on it.
Trace the path: Document the source database, ETL or ELT transformations, warehouse tables, and downstream products.
Name the failure: Choose dimensions based on realistic failure modes, not on a generic checklist.
Set the response: Decide whether to block, quarantine, warn, or record an exception.
Expand gradually: Begin with the highest-risk data elements, then extend monitoring as ownership and evidence improve.
For teams designing measurable controls, digna's data quality metrics offers a relevant reference point for connecting dimensions to operational measurements.
Implementing Continuous Data Quality Monitoring
Continuous monitoring means quality checks run as data moves and changes, rather than waiting for a periodic audit. The distinction matters because a late feed can affect a dashboard or feature store before the next scheduled review. Timeliness is a distinct technical dimension because data loses business value when it isn't available at the expected time. It is commonly evaluated against delivery schedules, latency thresholds, or freshness SLAs, and it concerns whether data is promptly processed, current, and suitable for the task (research on data timeliness).
A practical rollout can begin with one high-value warehouse or database domain. Profile its normal behavior, observe delivery patterns, and identify which columns and tables support business-critical workflows. From there, add controls that match the risks instead of attempting to monitor every object at once.
A modular operating model
A platform such as digna can serve as one example of a modular approach. Teams can begin with Data Anomalies for baseline learning, then add Timeliness monitoring for missing or delayed loads, Data Validation for record-level business rules, and Schema Tracker for added, removed, or modified fields.
The implementation should preserve the data where it already lives. In-database execution lets the platform compute metrics and run analysis within the customer's databases, reducing unnecessary movement and supporting environments with strict security requirements. Deployment can take place in a private cloud or on premises, depending on the organization's infrastructure and governance model.
Continuous monitoring also needs operational context. A shared dashboard should connect alerts to the affected table, pipeline, owner, and downstream consumer. Integrations with schedulers, catalogs, and collaboration workflows help teams move from detection to diagnosis without creating a separate manual process.
The most important design decision is the response policy. A failed validity rule might block a release, while an unusual metric may create an investigation alert. A missing delivery may page an on-call engineer for a critical feed but generate a lower-priority notification for a nonessential dataset. Monitoring works when it helps people act, not when it produces an unfiltered stream of warnings.
Use digna's data quality monitoring capabilities as a reference for how anomaly detection, validation, timeliness, and schema controls can be combined in an ongoing operating model.
Building Your Data Quality Strategy
Data quality management is the ongoing practice of defining, measuring, monitoring, and improving data quality across an organization. It combines technical controls with ownership, business definitions, incident response, and governance.
A practical roadmap is:
Audit the current state: Profile priority databases, warehouse tables, pipelines, and downstream reports.
Identify CDEs: Mark the data elements whose failure could affect compliance, revenue, operations, customers, or AI outputs.
Prioritize dimensions: Select the dimensions that match each CDE's use case and risk.
Implement monitoring: Combine explicit validation with anomaly, timeliness, and schema monitoring.
Review and improve: Use incidents and stakeholder feedback to refine rules, thresholds, ownership, and coverage.
The central lesson is simple: quality is multidimensional, prioritized, and continuous. Manual rules still have a place, but they need context, ownership, and monitoring that can detect both known violations and unexpected behavior.
digna provides an enterprise data quality and data observability platform for monitoring data behavior, validating records, tracking timeliness, detecting schema changes, and analyzing business and platform metrics inside the customer's own environment. Visit digna to explore a modular approach to continuous monitoring across warehouses, lakes, databases, and pipelines.
Frequently asked questions
What are the dimensions of data quality?
DAMA-DMBOK 2.0 sets out nine: accuracy, completeness, consistency, currency, integrity, timeliness, uniqueness, validity and reasonability. Each answers a different question about fitness for purpose, which is why a single composite quality score hides more than it reveals.
Why does a single data quality score fail?
Because the dimensions trade against each other. Waiting for late records improves completeness but damages timeliness; strict validation improves validity but can drop legitimate edge cases. One number averages those tensions away and tells you nothing about which to fix.
What is the difference between accuracy and validity?
Validity means a value conforms to its defined format and permitted range. Accuracy means it correctly describes the real-world thing. A date of birth of 1899-01-01 can be perfectly valid and completely inaccurate, which is why validity checks alone are never sufficient.
How do you choose which dimensions to measure?
Work backwards from the decision the data supports. Regulatory reporting weights completeness and integrity; operational alerting weights timeliness and currency; customer matching weights uniqueness. Measuring all nine everywhere produces noise rather than assurance.
How do dimensions relate to data observability?
Dimensions define what good means; observability detects when behaviour departs from it without a rule being written. Static rules cover the dimensions you anticipated, and observability covers the volume shifts, distribution drift and schema changes that no dimension check was authored for.


