Monitor in Management: A Practical Guide
|
6
min read

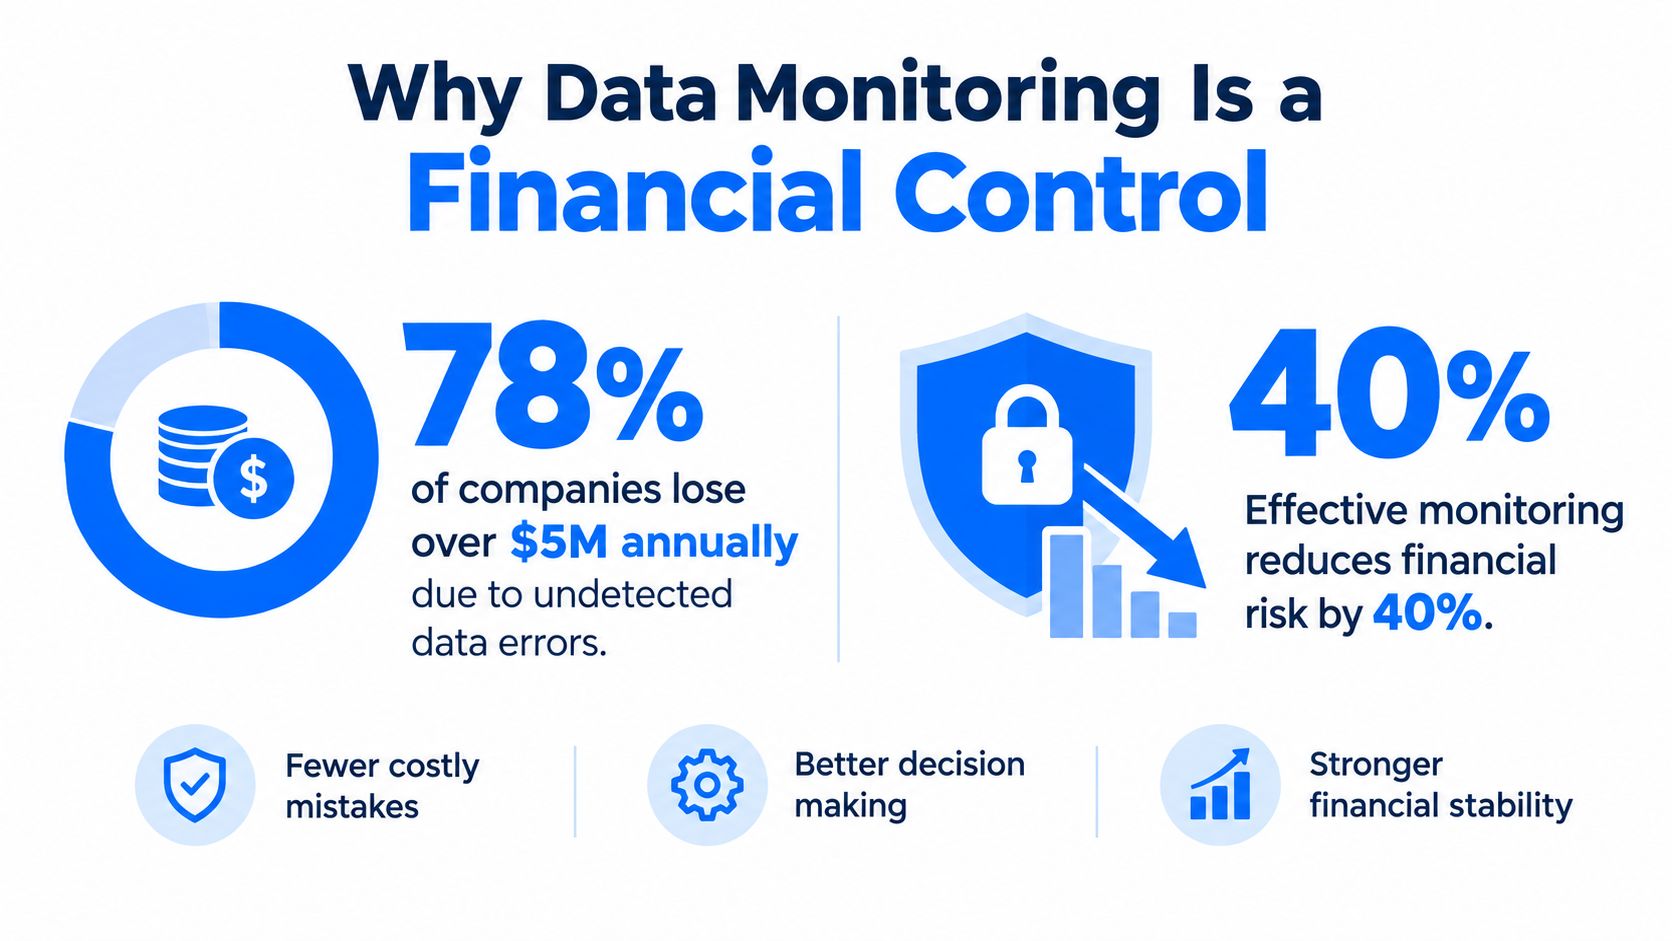
More than one-quarter of organizations estimate annual losses above USD 5 million from poor data quality, and 7% report losses of at least USD 25 million. Monitoring in management prevents that exposure by connecting data signals to accountable owners, business impact, and corrective action.
That distinction matters because a dashboard can display a failure without making anyone responsible for resolving it. Effective monitoring is a management control system: teams define expected conditions, observe actual behavior, compare the two, and act when the deviation matters.
Table of Contents
Why Data Monitoring Is a Financial Control
Poor data quality isn't merely an engineering inconvenience. It can distort forecasts, interrupt operations, undermine regulatory reporting, and push automated decisions in the wrong direction. IBM's analysis of the cost of poor data quality reports that more than one-quarter of organizations estimate annual losses above USD 5 million, while 7% report losses of at least USD 25 million.
Monitoring in management means more than displaying a current value. It means defining an expected range or condition, observing a data or business process, identifying a meaningful deviation, assigning responsibility, preserving evidence, and verifying that remediation worked. A dashboard supports that process, but it doesn't replace it.
Dashboard visibility versus management control
A dashboard answers, “What is happening?” A management control answers a fuller set of questions:
Expectation: What should be happening, and which standard defines it?
Materiality: What business, financial, operational, or regulatory consequence follows if conditions change?
Ownership: Which person or team must investigate?
Evidence: What records show when the deviation began and what changed?
Response: What action is required, and when can the issue be closed?
For a bank, a late risk dataset can affect reporting or decision workflows. Teams working on data management in banks need more than pipeline status. They need timeliness, validation, schema, and business-rule signals connected to the processes those datasets support.
The practical trade-off is straightforward. Broad monitoring creates visibility, but indiscriminate collection creates noise and expense. Focused monitoring of financially material tables, regulatory datasets, customer records, and decision-critical pipelines creates a smaller evidence set that management can actually use.
The Evolution of Management Control Theory
Modern observability can look like a break from traditional management, especially when machine learning detects unusual behavior without a manually authored rule. The underlying logic is older and more stable than the technology. Teams still compare actual conditions with expected conditions and decide whether a deviation requires action.
Henri Fayol articulated an early definition of management control in 1916, describing control as checking whether activities followed the adopted plan, issued orders, and established principles, as documented in this overview of management control theory. That definition made control a recurring managerial responsibility, not a one-time inspection.
Earlier scientific-management work reinforced the same pattern. Frederick Taylor treated control as a goal in experiments conducted in 1906, while Copley described control as the central idea of scientific management in 1923. Later summaries identify five principles proposed by Urwick in 1929: accountability, evidence, standardization, comparison, and utility.
The control cycle in a data platform
Those principles map cleanly to enterprise data operations:
Set a standard. Define acceptable freshness, valid records, expected schema, delivery behavior, or KPI movement.
Measure performance. Collect observations from tables, pipelines, workloads, and business processes.
Compare results. Evaluate current behavior against a baseline, rule, target, or historical pattern.
Assess significance. Separate harmless variation from a deviation that can affect decisions.
Take corrective action. Route the finding to an owner, record the response, and test whether conditions returned to an acceptable state.
AI-driven anomaly detection changes how teams establish baselines and identify deviations. It doesn't eliminate the control cycle. It automates parts of observation and comparison, while people still decide what the signal means and what response is acceptable.
A 2024 scholarly synthesis reviewed organizational-control research through a co-citation analysis of 1,148 articles published between 1938 and 2022. Its multidisciplinary meta-analysis covered 293 articles, 310 independent samples, and a combined 110,585 observations, according to the Cambridge overview of organizational control. The research tradition now extends beyond financial accounting into non-financial indicators, information systems, organizational behavior, and strategic performance.
That evolution explains why a platform such as digna can combine anomaly detection, timeliness tracking, validation, schema monitoring, and KPI observation. These are not disconnected features. They are modern implementations of a long-standing managerial discipline.
Defining the Core Types of Monitoring
Monitoring fails when teams treat every signal as the same kind of problem. A pipeline delay, an unexpected revenue movement, and a failed privacy validation may all produce alerts, but they require different standards, owners, response times, and evidence.

Operational monitoring
Operational monitoring focuses on whether the data environment is functioning as intended. It covers availability, workload behavior, performance, throughput, data freshness, correctness, quality, and coverage. A completed job isn't necessarily a successful job. The output may be late, incomplete, structurally changed, or unsuitable for downstream use.
Useful signals include:
Timeliness: Did the expected table or partition arrive within its agreed window?
Schema behavior: Were columns added, removed, or changed in a way that affects consumers?
Pipeline health: Did a process fail, retry unusually, or produce fewer records than expected?
Platform behavior: Did workload consumption or performance move outside its normal pattern?
KPI monitoring
KPI monitoring evaluates the business meaning carried by the data. It tracks revenue, sales, transactions, customer activity, operational volumes, or other measures against business expectations. The important design choice is to distinguish a legitimate business change from a data defect.
A KPI alert should therefore carry context. Which source tables feed the metric? Did a schema change occur first? Did record counts, distributions, or validation results shift? Can the business owner confirm that the movement reflects reality?
Risk-based monitoring
Risk-based monitoring determines how closely each control should be observed. NIST guidance on continuous monitoring recommends a strategy that varies frequency according to control volatility, system risk tolerance, threat and vulnerability conditions, impact level, known weaknesses, and the criticality of the monitored function. It also recommends combining leading indicators, such as schema changes, with lagging indicators, such as incident recurrence.
Monitoring type | Primary question | Typical response |
|---|---|---|
Operational | Is the data service behaving correctly? | Investigate delivery, infrastructure, or pipeline conditions |
KPI | Is business performance moving as expected? | Validate the metric and involve the business owner |
Risk-based | How much attention does this control require? | Adjust frequency, thresholds, escalation, or acceptance |
A monitoring program needs all three. Data quality observability can expose a failing record rule, but management still has to determine the consequence, assign the owner, and document the decision.
The Accountability Gap in Modern Monitoring
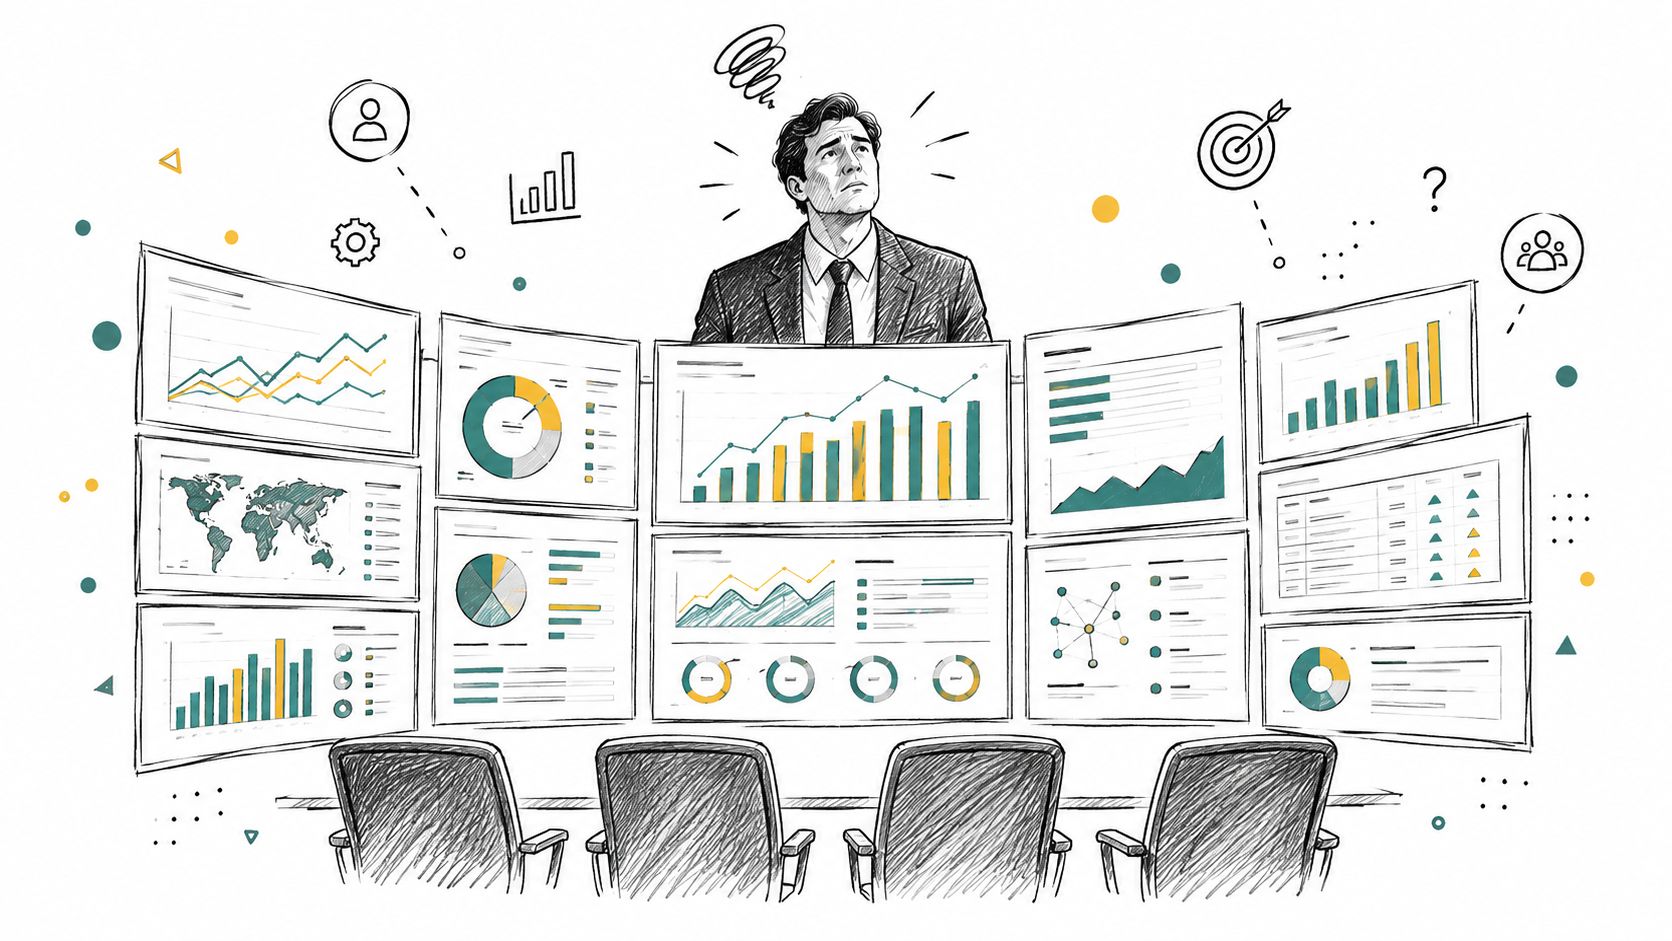
Many organizations have invested in dashboards faster than they've developed ownership models. The result is familiar: a team sees a red indicator, assumes another team is handling it, and discovers later that nobody preserved the evidence or tested the fix.
A 2025 governance survey ranked stewardship and ownership as top priorities, while independent reporting on the same governance research found that some organizations still lack model-observability programs and basic data-quality or access-governance capabilities, as documented in the 2025 State of Enterprise Data Governance report.
That finding exposes a common mismatch. Teams may discuss observability as a technical capability while governance leaders are asking a more operational question: who is accountable for the signal, its interpretation, and its closure?
Make every alert actionable
A useful monitoring record should connect five elements:
Named owner: The team or role responsible for investigation.
Business impact: The decision, process, customer, or obligation at risk.
Action threshold: The condition that changes the finding from observation to escalation.
Evidence trail: The metric history, failed records, schema event, or validation result supporting the finding.
Closure test: The evidence required to show that remediation worked.
Practical rule: An alert without an owner is telemetry, not control.
Adding alerts can increase notification volume without improving reliability. A smaller set of high-confidence signals, routed through data governance roles, often produces better management outcomes than a larger catalogue of technically interesting events.
The trade-off is between coverage and attention. Broad coverage helps teams discover unknown failure modes, but every alert consumes review capacity. Risk-based thresholds, clear escalation paths, and historical context let leaders protect attention for deviations that can change a business decision.
Implementing a Practical Monitoring Strategy
Start with the decisions your organization can't afford to make on bad data. That list usually includes regulatory reporting, financial controls, customer eligibility, operational capacity, and AI or analytical outputs that influence material choices. Map the datasets and pipelines behind those decisions before selecting metrics.
Choose indicators that reveal different failure modes
Use leading indicators to detect conditions before an incident becomes visible to users. Schema changes, late-arriving partitions, freshness deviation, null-rate shifts, unusual workload consumption, and distribution changes can reveal deterioration early.
Lagging indicators show whether the control system is working after a problem occurs. Incident recurrence, failed reconciliations, reporting restatements, and repeated control exceptions tell management where remediation or control design remains weak.
For timeliness, define a service-level objective rather than saying that data should be “near real time.” Google's SRE guidance on service-level objectives notes that data more than four to five minutes stale can significantly delay incident response in monitoring systems. The correct threshold depends on the process, but the principle is consistent: measure the proportion of data or pipeline runs meeting an agreed freshness condition over a defined window.
Set frequency according to risk
Don't check every table at the same cadence. A financially material dataset, identity-related table, or regulatory feed deserves tighter observation than a low-impact exploratory table. Adjust frequency when volatility, exposure, known weaknesses, or business criticality changes.
Also avoid averages that hide the tail of operational behavior. Google SRE material identifies percentile measurements such as the 50th, 95th, and 99th percentiles as useful because averages can conceal a small but consequential population of slow requests. The same reasoning applies to pipeline latency and workload performance.
Define the response path before enabling alerts
For each metric, record the baseline, owner, threshold, escalation route, evidence location, and recovery test. Monitoring should measure not only time from deviation to detection, but also time to acknowledgement and recovery.
A platform such as digna can support this operating model by monitoring data behavior, validating records, tracking timeliness, detecting schema changes, and observing business and platform metrics within the customer's environment. Teams should still validate deployment, ownership, and thresholds against their own architecture and risk policy. The monitoring and reporting capability belongs inside that broader management process, not beside it.
Real-World Applications in Regulated Industries
A financial-services team might monitor a risk table for unexpected schema changes before a reporting cycle. A removed column or altered data type can break downstream logic without warning, so the useful control isn't merely a failed job alert. It combines structural monitoring, dependency awareness, validation results, and an accountable owner who can assess whether the affected report remains reliable.
Healthcare teams face a different version of the same problem. A patient record may arrive on time and pass technical checks while still violating a business or legal rule. Record-level validation can identify the failed record, preserve the rule evaluated, route the issue for review, and retain evidence of the resolution.
Article 5 of the EU General Data Protection Regulation requires personal data to be accurate and kept up to date. It also requires appropriate security, including protection against unauthorized or unlawful processing and accidental loss, destruction, or damage. Continuous monitoring helps translate those obligations into operational evidence rather than relying on periodic manual review.
Applying controls by industry
Financial services: Validate transaction and regulatory data, monitor delivery timeliness, detect structural changes, and connect exceptions to reporting and risk owners.
Healthcare: Check clinical and operational records against business rules, identify inaccurate or inconsistent values, and preserve review evidence.
Telecommunications: Observe high-volume customer and network data, distinguish genuine usage changes from pipeline defects, and escalate failures before they distort operational reporting.
Public-sector environments: Maintain traceable evidence for critical datasets, including the rule evaluated, the records affected, the decision made, and the corrective action.
Organizations with complex financial controls may also evaluate resources on automated policy enforcement FinTech when they need to connect policy requirements with repeatable operational controls. The important design principle remains the same: monitoring should produce evidence that an accountable team can interpret and act on.
For healthcare organizations, healthcare data compliance requires the same discipline across quality, timeliness, validation, and structural change. Compliance isn't established by a score alone. It depends on whether teams can show what they checked, what failed, who responded, and whether the result was corrected.
The Future of Evidence-Based Governance
The next stage of monitoring isn't a larger wall of charts. It's a tighter relationship between observation, management judgment, and evidence. AI can learn dataset-specific behavior, correlate signals, prioritize anomalies, and reduce manual rule maintenance. It can't decide whether a business exception is acceptable without a defined policy and accountable authority.
The most durable operating loop has four parts:
Observe actual conditions across data, platforms, business metrics, and controls.
Compare conditions with expectations using rules, baselines, service objectives, or risk thresholds.
Assign and execute corrective action with a documented owner and escalation path.
Verify the result through subsequent measurements and retained evidence.
This approach also helps teams separate data problems from model problems. An unexpected model output may originate in a changed upstream schema, late data, a shifted distribution, a failed validation rule, or a legitimate business event. Following the causal chain prevents teams from treating model monitoring as an isolated solution to every AI reliability issue.
Monitoring earns its management value when the evidence changes a decision.
The practical shift is from passive visibility to evidence-based governance. Data engineers become responsible not only for pipeline uptime, but also for the integrity, timeliness, and traceability of the information used by analysts, executives, regulators, and AI systems. Business owners gain a clearer role because they define materiality and acceptable outcomes. Governance teams receive evidence generated through normal operations instead of reconstructed under pressure.
That is the useful meaning of monitor in management. Teams don't monitor to collect more telemetry. They monitor to detect meaningful change early, make responsibility explicit, and protect decisions from unreliable data.
digna provides an enterprise data quality and data observability platform that runs inside the customer's own environment, with modules for anomaly detection, timeliness, record-level validation, schema tracking, and business and platform monitoring. Visit digna to see how your team can connect monitoring signals to accountable remediation and reliable evidence.
If KPI monitoring is where your accountability gap is widest, see how business monitoring with digna separates genuine movements in revenue, transactions and volumes from data defects in the tables that feed them.
Frequently asked questions
What does monitoring in management mean?
Monitoring in management is a control process, not just a dashboard. Teams define an expected range or condition, observe a data or business process, spot meaningful deviations, assign an owner, preserve evidence and verify that remediation worked. A dashboard supports that cycle but never replaces it.
What is the difference between a dashboard and a management control?
A dashboard only answers what is happening right now. A management control also covers expectation, materiality, ownership, evidence and response: which standard applies, what the business consequence is, who must investigate, what records show the change, and when the issue can be closed.
What are the main types of monitoring in management?
The article distinguishes three types. Operational monitoring checks freshness, schema, pipeline health and platform behavior. KPI monitoring tracks revenue, transactions or volumes against business expectations. Risk-based monitoring decides how often and how closely each control is observed, based on impact, volatility and known weaknesses.
Why does every monitoring alert need an owner?
Without a named owner, an alert is telemetry rather than control. Teams see a red indicator, assume someone else is handling it, and later find nobody preserved evidence or tested the fix. A useful alert links an owner, business impact, action threshold, evidence trail and closure test.
How often should data be monitored?
Monitoring frequency should follow risk rather than a single cadence for every table. Financially material datasets, identity tables and regulatory feeds deserve tighter observation than exploratory tables. NIST guidance suggests adjusting frequency for control volatility, impact level, known weaknesses and the criticality of the monitored function.



