Data Quality Observability: A Practical Guide for Data Teams
|
8
min read

You already know the feeling. A dashboard looks healthy at 6:45 AM, then by 8:00 the numbers are off, the VP is asking why revenue changed overnight, and the data team is tracing pipeline logs while everyone else waits for an answer. That's data downtime, and it's one of the fastest ways to turn a trusted reporting layer into a liability.
Data quality observability changes that posture. Instead of waiting for broken dashboards, it watches the behavior of data as it moves, so teams can catch freshness delays, schema drift, volume shifts, and validation failures before they spread into decisions. The point isn't more alerts. It's earlier signal, cleaner triage, and less time spent explaining why the numbers can't be trusted.
Table of Contents
The Hidden Cost of Broken Data
A Monday morning incident rarely starts with drama. It starts with one stale table, one missing load, or one quiet schema change that nobody noticed in time. By the time the issue surfaces, the damage has already moved past the warehouse and into the business.
The scale of that problem is easy to underestimate. A 2023 Wakefield Research survey commissioned by Monte Carlo found that monthly data incidents increased from 59 in 2022 to 67 in 2023, a 1.89x rise in data downtime, and 68% of respondents needed four hours or more to detect incidents. The same survey reported an average resolution time of 15 hours per incident, and more than half of respondents said at least 25% of revenue was exposed to data quality issues, with the average impacted revenue share rising to 31% from 26% the year before, all reported in a market overview of the category in the data observability market report.
What that looks like in practice
A finance analyst refreshes a board deck and notices a number that doesn't match yesterday's export. A data engineer checks the orchestration logs and sees the pipeline completed, which is worse, not better, because the problem now hides in the content rather than the job status. The team starts comparing row counts, looking for schema changes, and messaging owners who may not even know they caused the break.
Practical rule: if the first sign of a problem is a business user asking a question, the monitoring layer is already too far downstream.
That's why observability matters. It doesn't replace root-cause analysis, and it doesn't magically make data correct. It gives you earlier warning, so the team can stop treating every incident like a surprise and start treating it like a controllable operational risk.

The strongest teams I've worked with stopped asking, “Why did this dashboard break?” and started asking, “What changed before the dashboard broke?” That shift is the whole game. Data quality observability gives you a way to answer that question before the business pays the price.
Understanding Data Quality Observability
A dashboard can look healthy while the pipeline behind it is drifting. A source table may still load on time, yet the schema changes underneath it, a transformation starts reshaping values, and downstream reports stay wrong until someone spots the mismatch. Data quality observability focuses on those system signals, not just the final row-level result.
The shift from rules to signals
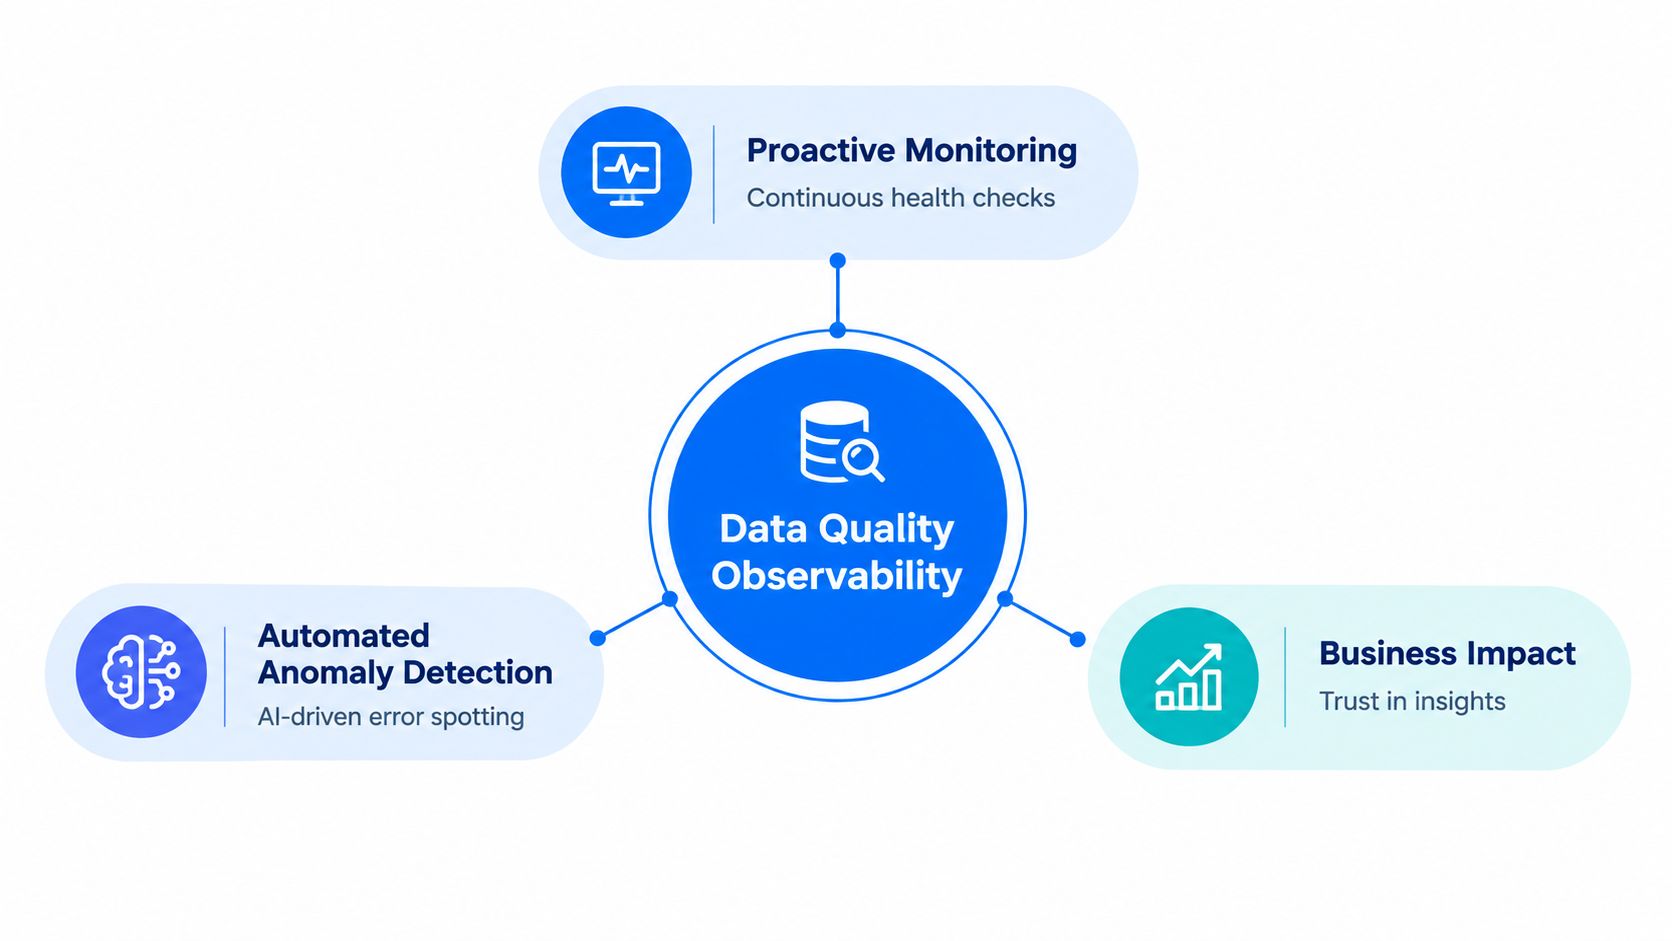
Rule-based checks still matter. They are precise, auditable, and useful when business logic must be enforced at the record level. They also miss a lot, because they only catch what you already expected to break. Observability looks at external signals such as freshness, volume, schema, distribution, and lineage, then uses those patterns to show whether the pipeline is behaving normally as defined in practical observability guidance.
That shift matters most when schema drift enters the picture. If a source adds, removes, renames, or type-changes a column, a brittle transformation can fail without warning or send malformed values into downstream analytics before anyone notices schema drift is a core observability signal. Observability catches the structural change itself, instead of waiting for the bad output to surface.
Alert fatigue is the trade-off on the other side. Static rules can produce a long stream of low-value alerts, especially when data changes are normal for the business. Behavioral monitoring reduces that noise by asking whether the pattern changed in a meaningful way, which is a better fit for modern pipelines and the way teams investigate incidents.
Observability is strongest when it watches how data behaves, not just whether a row passes a rule.
What to monitor first
Start with the signals that tell you whether the pipeline is alive and consistent.
Freshness: late data is often the first sign of a stalled or degraded pipeline.
Volume: sudden spikes or drops can point to ingestion issues, duplicates, or partial loads.
Schema: unexpected field changes are often the fastest path to broken transformations.
Distribution: shifts in value patterns can expose silent corruption that still looks valid at the table level.
Lineage: knowing where data came from and where it flows helps you trace impact instead of guessing.
The practical goal is simple. If data quality checks tell you whether a record is acceptable, observability tells you whether the whole flow is behaving in a way you can trust. For a fuller treatment of how behavioral signals replace static rules, see the data observability overview.
Key Signals for Monitoring Data Health
Monitoring works best when each signal maps to a failure mode and a business consequence. Traditional rule-based checks remain useful, but they often treat every deviation as equally urgent. AI-driven observability adds behavioral baselines, helping teams distinguish expected variation from a pattern that threatens data availability, downstream reporting, or operational decisions. The goal is fewer low-value alerts and faster attention to data downtime.
Freshness, volume, schema, and validation work together
Timeliness is often the earliest warning that a pipeline has stalled or degraded. Modern implementations learn a dataset's delivery cadence, calculate when the next load should arrive, and alert when it is late or missing, as described in operational monitoring guidance. Timeliness logic can also identify deliveries that arrive earlier than expected, which matters when a source departs from its normal rhythm, that cadence-based pattern is also covered in platform guidance.
Anomaly detection adds context to a simple threshold. A spike in a customer activity table might reflect a legitimate campaign, or it might indicate a duplicated feed replaying records. A behavioral model cannot determine the business explanation by itself, but it can flag a meaningful change before analysts rely on the affected data.
Schema tracking limits structural failures downstream. A finance feed may add a nullable field, or a healthcare extract may change a type definition without showing an obvious problem at the source. The break may surface later in a transformation, model, or dashboard, where diagnosis costs more time.
Validation connects observability with business rules. Row-level checks compare values with expected forms, lengths, and quality metrics. They support compliance work, audit evidence, and targeted review of high-risk records, row-level validation is described in the verification literature.
A data observability metrics guide can help map each metric to the failure mode it is intended to expose.
Signal | What it catches | What it doesn't catch |
|---|---|---|
Freshness | Late or missing loads | Incorrect business meaning |
Volume | Missing data, duplicates, replayed feeds | Fine-grained row errors |
Schema | Added, removed, renamed, or typed fields | Semantic mistakes in valid columns |
Validation | Rule violations at the record level | Unexpected behavior outside the rule set |
Scope matters more than coverage
The main cost is not choosing signals. It is applying them indiscriminately across large estates, multiple stacks, and many tables. Broader coverage increases compute, metadata, and alerting overhead, a practical warning highlighted by Databricks. Excess alerts also create operational fatigue. Once engineers stop trusting notifications, a genuine data outage can wait behind routine variance.
Prioritize pipelines whose failure would affect revenue, reporting, compliance, or customer operations. AI-driven detection can reduce repetitive threshold alerts, while explicit validation remains appropriate for known rules. Used together, these approaches produce a quieter alert stream with clearer ownership and faster incident response.
Architecture Patterns for Observability
Most observability failures come from architecture choices, not from the monitoring signal itself. Teams either move too much data into a separate tool, or they bolt on checks after the fact and hope the latency and security trade-offs won't matter. In practice, the architecture has to respect where the data already lives.
Keep the checks close to the data
The strongest pattern is in-database execution. Monitoring logic runs inside the warehouse or lake, so the data stays in place and the team avoids unnecessary movement across systems. That matters for both security and performance, especially when the platform is already handling sensitive datasets or heavy workloads.
This is also where modularity earns its keep. A monolithic observability stack can be hard to adopt because it forces teams into a broad rollout before they've proven value. A modular setup lets you begin with one problem, like schema drift or timeliness, then expand into validation or business monitoring once the first signal is working.
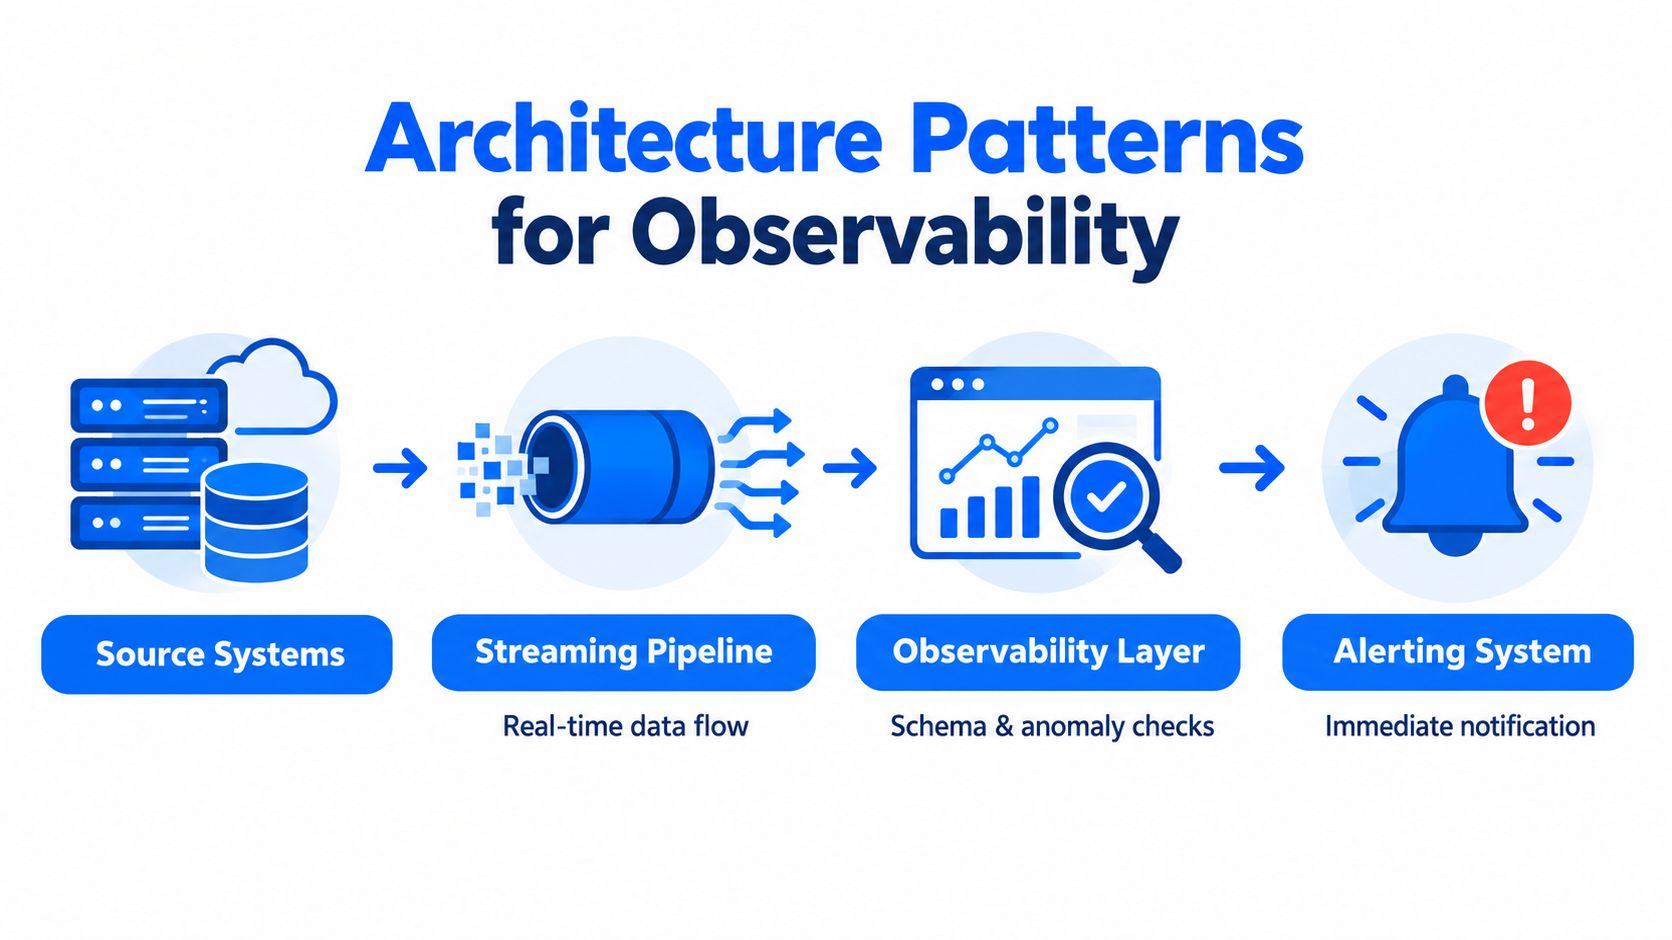
A clean architecture usually follows this sequence:
Source systems emit operational or analytical data.
Streaming or batch pipelines move the data into the governed environment.
An observability layer evaluates freshness, schema, and anomaly signals where the data already sits.
An alerting system routes only meaningful incidents to the right owner.
Why modular platforms are easier to operationalize
A modular platform keeps the blast radius small when you're introducing observability to a mature stack. You can point it at the most important tables first, then expand as the team trusts the signal quality. That also makes the rollout easier for data engineering teams, because the monitoring logic evolves alongside the pipelines instead of forcing a separate operational model.
The internal observability architecture guide at digna fits that modular pattern well, especially for teams that want to keep monitoring close to the warehouse or lake rather than building a detached layer that's expensive to maintain.
The point is not architecture for its own sake. It's reducing friction, reducing data movement, and making sure the monitoring layer doesn't become another source of operational noise.
The Role of Observability in Analytics and AI
Analytics and AI both fail fast when the input data drifts. A dashboard can be wrong because a feed is late. A model can become unreliable because feature values shift. In both cases, the problem is often invisible until the business sees the effect.
Why AI raises the bar
A 2025 source on the market and adoption gap noted that 48% of respondents said low data quality is the main barrier to AI readiness, while another survey found 74% of organizations consider monitoring critical business processes important and 54% say alert-detection quality most affects observability ROI as summarized in the market player analysis. Those are not abstract numbers. They show that teams are no longer treating observability as a niche engineering issue, they're treating it as a prerequisite for AI and executive reporting.
That matters because AI pipelines don't just depend on clean records. They depend on stable inputs, predictable feature behavior, and trustworthy downstream signals. If the data feeding the model changes shape, the model may still return a result, but that result can become less useful without any obvious failure flag.
Business metrics deserve the same discipline
Observability has also moved beyond classic pipeline monitoring toward business-process monitoring. That shift is important, because executives don't care whether a schema diff was interesting. They care whether customer churn, order volume, claims processing, or other business KPIs moved outside the expected range. Monitoring those metrics on the underlying data gives teams an earlier way to see operational drift, without waiting for the reporting layer to expose it.
The AI readiness guide at digna aligns with that broader view, because observability is no longer only about technical health. It's about proving that the data foundation can support analytics, automation, and AI without creating blind spots.
When teams get this right, they stop asking whether the dashboard is up. They start asking whether the signals behind the dashboard still deserve trust.
Modular Platforms and Real-World Examples
The advantage of modular observability is that it lets teams solve a specific reliability problem without buying a whole new operating model. That matters in enterprise environments, where finance, healthcare, telecom, and public-sector teams all face different failure patterns and different tolerance levels for noise.
Where modular observability fits
A financial services team usually cares about timing, transaction integrity, and downstream reporting. If a regulatory feed arrives late, the issue isn't just operational. It affects confidence in reporting and can cascade into missed deadlines. A modular platform can focus first on timeliness and anomaly detection for the critical feeds, then add schema tracking and validation where business rules matter most.
A healthcare team has different constraints. Clinical and operational datasets often need validation, structural stability, and traceability across source systems. Schema changes in an EHR pipeline can be just as disruptive as late delivery, because they can break downstream analytics or reporting workflows even when the source system seems fine.
Why one platform can still stay focused
digna is one option in this category, and its modular setup combines AI-driven anomaly detection, timeliness monitoring, schema tracking, and record-level validation inside the customer's own environment. That model is useful when teams want to keep data in place and add observability without pulling production data into a separate external service.
The use-case page at digna is a good fit for teams comparing how these modules map to different operational needs. The important part is not the brand, though. It's the design principle, start with the signals that match your highest-risk pipelines, then expand only where the monitoring improves trust more than it adds overhead.
If a platform can't explain why an alert matters to the business, it's not finished yet.
That principle holds across industries. The best observability rollout is usually the one that starts narrow, proves value, and then grows only where the team can keep the signal clean.
Challenging Common Misconceptions
The biggest misconception is that observability is just a nicer way to find bad records. It's not. Record quality still matters, but the harder problem is deciding what deserves attention, because every new monitored table adds cost, metadata, and alerting overhead.
More monitoring doesn't always mean more trust
A noisy alert stream can reduce confidence faster than no monitoring at all. When every minor deviation triggers a page, engineers start ignoring warnings, and the system loses credibility. That's why scope control matters so much, especially in large estates where monitoring everything equally is both expensive and distracting.
Another common mistake is assuming observability is only for large enterprises. Smaller teams benefit too, but only if they focus on the pipelines that matter most. If a three-person data team monitors every low-value table in the warehouse, they'll drown in work they don't need.
Use observability where the business feels the pain
The practical rule is simple. Watch the assets where delay, drift, or failure would affect reporting, customer experience, compliance, or model quality first. Once those are stable, expand into adjacent datasets with the same discipline.
Good observability reduces uncertainty. Bad observability just creates a more polished version of alert fatigue.
That's the core trade-off. More detection is only useful if the team can act on it, and act on it fast enough to matter. If not, the monitoring layer becomes another source of friction.
Building Your Data Observability Strategy
A workable strategy starts with the pipelines that would hurt most if they failed. That sounds obvious, but plenty of teams still start by instrumenting the easiest dataset instead of the most important one. The result is a clean dashboard on a low-risk table and no real protection where the business is actually exposed.
Start with critical paths, not broad coverage
Identify the tables, feeds, and downstream reports that drive finance, operations, customer experience, or AI workloads. Then define which signals matter most for each one. A late load might be the key issue in one pipeline, while schema changes or distribution shifts matter more in another.
From there, use observability to reduce manual rule creation. That doesn't mean abandoning validation. It means reserving deep record-level checks for the assets where business correctness matters most, while letting behavioral monitoring cover the rest of the estate. That balance keeps the system practical.
Build for action, not just detection
Alerting should lead to ownership, triage, and resolution. If the platform can't route an incident to the team that owns the data, the signal won't turn into a fix. If the alert doesn't show the likely downstream impact, engineers will spend too much time reconstructing the blast radius by hand.
You'll get better results if you make these three choices early:
Pick high-impact pipelines first: monitor the data whose failure would change business decisions.
Separate signal from noise: tune alerts so the team sees meaningful deviations, not every minor fluctuation.
Keep the operating model simple: use modular capabilities so observability grows with the stack instead of overwhelming it.
The long-term goal is trust, not tooling. When monitoring becomes part of how the team ships reliable data, analytics teams move faster, business users ask fewer defensive questions, and data engineering stops spending its week cleaning up preventable incidents.
If you're tightening your data quality observability strategy, digna gives teams modular anomaly detection, timeliness checks, schema tracking, and validation inside their own environment. Visit digna to see how that approach can support reliable analytics and AI without adding unnecessary data movement or operational noise.
If you want to see how this in-database, modular approach looks across a whole platform, from freshness and schema changes to anomalies and validation, our data platform observability page shows how digna monitors these signals without moving data out of your environment.
Frequently asked questions
What is data quality observability?
Data quality observability watches how data behaves as it moves through pipelines, using signals like freshness, volume, schema, distribution and lineage. Rather than waiting for a broken dashboard, it flags late loads, schema drift or volume shifts early, so teams ask what changed before the dashboard broke instead of why it broke.
How is data observability different from rule-based data quality checks?
Rule-based checks only catch problems you already expected, while observability learns normal behavior and flags meaningful changes. Rules stay valuable for precise, auditable record-level logic, but they miss unexpected breaks and can flood teams with low-value alerts. The post recommends keeping validation for known rules and letting behavioral monitoring cover the rest.
Which data observability signals should I monitor first?
Start with freshness, volume, schema, distribution and lineage, because they show whether a pipeline is alive and consistent. Each maps to a failure mode: freshness catches late or missing loads, volume catches duplicates and replayed feeds, and schema catches added, removed, renamed or retyped fields, though none of them catches semantic mistakes on its own.
How long does it take to detect a data incident?
Often longer than teams expect: in a 2023 Wakefield Research survey, 68% of respondents needed four hours or more to detect data incidents. Resolution averaged 15 hours per incident, and monthly incidents rose from 59 to 67 year over year, which is why earlier signal matters more than faster firefighting.
Should observability checks run inside the data warehouse?
Yes, in-database execution is the strongest architecture pattern, because the monitoring logic runs where the data already lives instead of copying it into a separate tool. That improves security and performance for sensitive or heavy workloads, and a modular setup lets teams begin with one problem, such as schema drift, before expanding.



