Data Quality Business Case: Get Approval in 2026
|
8
min read
The meeting starts with a familiar problem. Sales is staring at a dashboard that looks off, finance can't reconcile a number that should be routine, and operations is already asking who broke the pipeline this time. By the time the data team is pulled in, the damage isn't technical anymore. It's a business fire drill.
That's why a data quality business case can't read like an IT ticket. Leaders don't fund cleanup because records are messy. They fund it when the cost of bad data shows up in delayed decisions, manual rework, audit pressure, and missed value. Gartner's cited estimate that 40% of the anticipated value of business initiatives is never achieved because of poor data quality makes that problem hard to ignore, because it ties data quality to unrealized value, not just cleanup cost (Gartner on creating a business case for data quality improvement).
Table of Contents
Why Your Data Quality Initiative Needs a Business Case
A bad report rarely stays a data issue for long. A sales leader sees the wrong customer segment, the campaign underperforms, and the question quickly becomes why the data team did not catch it sooner. Without a formal case for improving data quality, that conversation turns into a budget fight, and budget fights are usually where data projects lose.
A business case changes the framing. It shifts the request from “please help us fix data” to “this initiative will protect revenue, reduce waste, and lower operating risk.” That distinction matters because data quality work is easy to dismiss as maintenance unless the financial consequence is explicit. The strongest cases make the cost of inaction visible, then show how better data creates measurable business value.
Pressure is primarily organizational, not technical. Competing priorities push data quality work behind revenue launches, reporting fixes, and urgent requests from operations. If you do not show how poor data creates rework, delays, and avoidable manual correction, the initiative becomes an abstract cleanup effort that loses attention as soon as another fire starts.
That is why the business case has to speak in operational terms. If analysts are spending time reconciling records in the warehouse, if finance is rechecking numbers before close, or if operations is rerunning reports because source data changed without notice, those are direct costs. In-database observability helps make that visible by showing where bad data creates repeated failures, longer refresh cycles, and extra handoffs that drain team time.
Practical rule: If the proposal cannot answer “what gets better, by how much, and what happens if we do nothing,” it is not ready for executives.
If you want a clean definition of the problem before you price it, use this overview of what data quality means as a baseline, then translate that definition into operational and financial terms. The business does not need a lecture on completeness or consistency. It needs to know where bad data slows revenue, adds labor, or exposes the company to avoidable risk.
From Technical Glitches to Business Pain Points
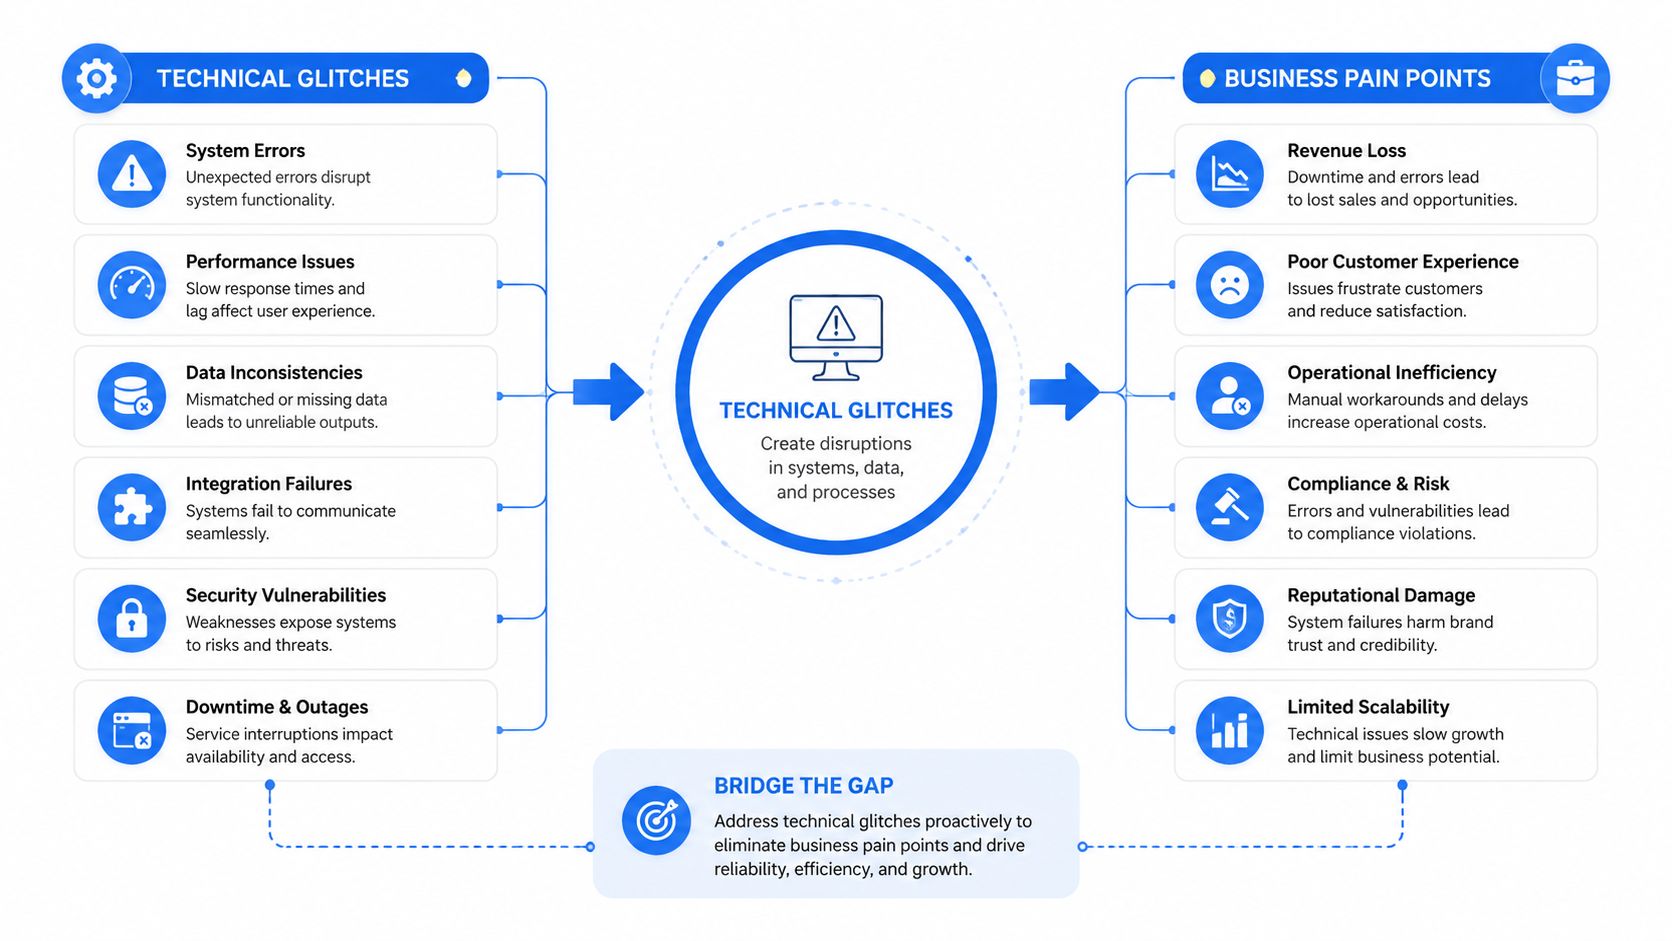
The fastest way to lose an executive sponsor is to lead with technical language. “Null values,” “schema drift,” and “validation failures” may be accurate, but they don't tell a finance director why the month-end close is slipping or a marketing manager why a campaign missed the right audience. The business case gets stronger when those defects are translated into business pain points.
Start with the workflow, not the table. Trace one data issue through sales, finance, or operations and write down the consequence at each step. A duplicate customer record, for example, isn't just a cleanup task. It can distort segmentation, trigger duplicate outreach, and create manual correction work for teams that assumed the source system was reliable.
Follow the information chain
The most persuasive cases connect poor data to a specific business process and show how the issue compounds over time. That's the gap many public guides miss, since they stop at broad ROI framing instead of showing how operational delay and incident recurrence build up across the value chain (Data Quality Pro on creating a data quality business case). A one-off defect is annoying. A repeated defect that keeps landing in the same report, campaign, or approval queue becomes a cost pattern.
A good interview with stakeholders should surface three things:
Where the defect shows up first: Ask sales, finance, and operations what they see before anyone opens a ticket.
Who pays the price: Identify the team that rechecks the data, the team that waits for it, and the team that has to explain the error upward.
What decision gets delayed: Tie the defect to a forecast, approval, reconciliation, or customer action that can't move forward.
A failed marketing campaign is often the clearest example. If customer addresses are wrong, contactability drops. If segment logic is stale, the wrong audience gets targeted. If the team then reruns the campaign by hand, the hidden cost is not the rule failure itself, it's the rework, the delay, and the lost opportunity while the team repairs what should have been reliable the first time.
Calculating the True Cost of Bad Data
This is the point where the business case stops being philosophical. The cost of poor data quality has to be expressed as a repeatable estimate, not a guess. A practical approach is to calculate incident cost as the sum of engineering hours, analytics hours, business-stakeholder hours, and downstream rework costs, then multiply by annual incident frequency (digna CFO template for business-case data quality).
That formula works because it captures the hidden factory around bad data. Engineers stop building and start firefighting. Analysts lose time reconciling numbers. Business stakeholders sit in meetings that produce no decision. Then somebody repeats the same work again because the issue wasn't fixed at the source.
Build the estimate from real incidents
Use the last six incidents as your sample set, as recommended in the cited framework, because that gives you a verifiable internal base instead of a hand-wavy percentage. For each incident, capture the work that had to happen and the impact downstream. If compliance had to review an exception, include it. If a report had to be rebuilt, include it. If a launch slipped because the data wasn't ready, note that too.
The cleanest way to present the math is in a simple table.
Cost Category | Metric | Example Calculation Per Incident | Annualized Cost |
|---|---|---|---|
Engineering rework | Hours spent fixing pipelines or logic | Hours x internal labor rate | Per incident total x annual frequency |
Analytics rework | Hours spent reconciling, validating, or rebuilding reports | Hours x internal labor rate | Per incident total x annual frequency |
Business-stakeholder time | Hours spent in review, escalation, and sign-off loops | Hours x internal labor rate | Per incident total x annual frequency |
Downstream rework | Extra campaign, reporting, or operational work caused by the defect | Internal labor plus avoidable process cost | Per incident total x annual frequency |
Use this data downtime cost calculator concept as the organizing lens for the estimate, then replace generic assumptions with your own incident history. The strongest version of the model doesn't depend on a vague industry average. It shows the cost of delay, the cost of rework, and the cost of letting the same defect happen again.
Bad data gets expensive twice. First in the correction, then in the repeat.
Defining Success With Actionable KPIs
A data quality business case gets approved when the outcome is measurable. “Improve data quality” is too broad to fund. “Reduce the time it takes to close the books” or “cut manual validation work” is specific enough to manage, budget for, and prove. The trick is to connect a business outcome to the observability signals that predict it.
That's where in-database metrics matter. If the data team can monitor freshness, anomaly rates, validation pass rates, and schema changes where the data already lives, they can show progress before the business feels the pain. A platform such as digna can support that style of monitoring because it runs inside the customer's environment and computes checks in-database, which keeps the observability layer closer to the data and the control plane closer to governance needs.
Pick KPIs that executives can feel
Don't build success criteria around data quality language that only the data team understands. Build around business outcomes first, then back into the leading indicators. The result should be a chain that sounds like this, business goal, operational metric, observability metric, owner.
For example:
Close the books faster: Track the business close cycle, then watch timeliness and validation pass rates on the feeds that support reporting.
Reduce manual validation work: Measure analyst time spent checking records, then monitor record validation pass rates and exception volume.
Improve campaign readiness: Watch customer data completeness and freshness before launch, then connect that to audience usability.
A useful external benchmark set from D&B includes reducing data latency by 5 to 10 days, reducing duplication by 10% to 20%, and shortening the sales cycle by 10 to 12 days (D&B quality data research). Those ranges are helpful because they translate data quality into process outcomes executives already understand. Use them as framing references, not as promises, unless your internal baseline supports the same direction of change.
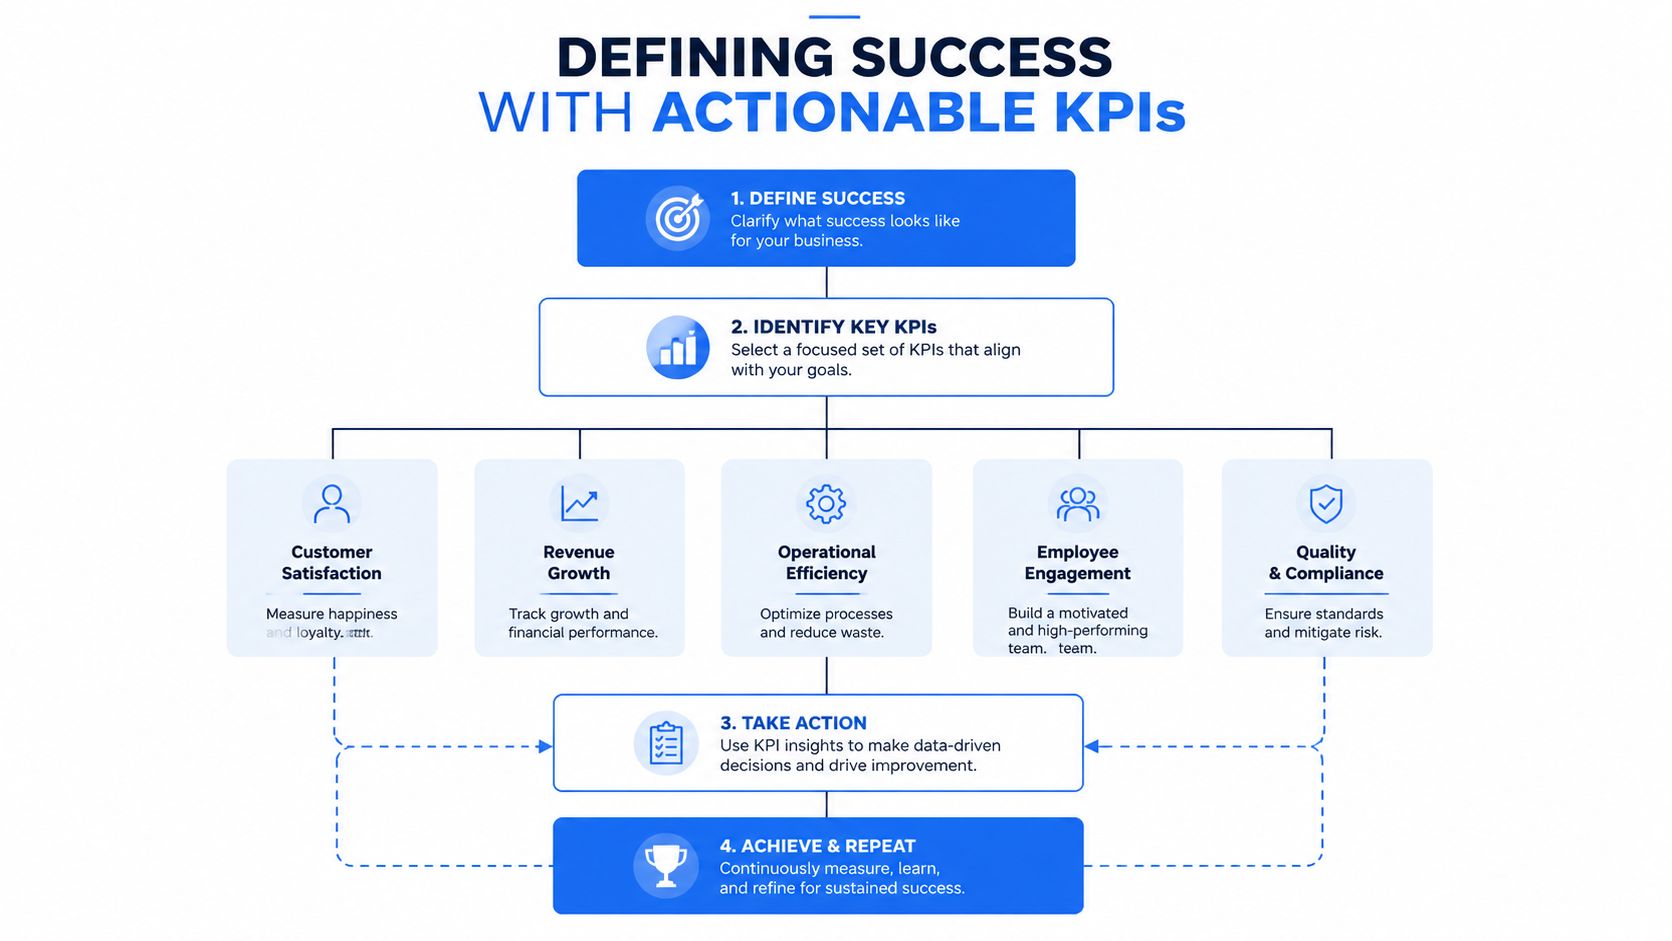
See the metrics that matter for a data quality business case, then map them to business owners who can verify whether the improvement is real. That ownership matters as much as the metric itself, because a KPI without an accountable stakeholder becomes another dashboard nobody trusts.
Modeling Your Investment and Projecting ROI
A CFO won't approve a solution on savings potential alone. The investment needs to be modeled with the same discipline as the problem. That means separating software cost, implementation effort, and ongoing operating cost, then comparing that against the cost of inaction you already quantified.
The architecture matters here. Many buyers overlook how deployment model changes the economics of a data quality platform. Guidance on data quality budgeting points out that in-database execution, no data movement, and avoiding per-scan pricing can materially change total cost of ownership, especially in regulated environments where security and deployment controls slow procurement (Qualytics on budget and business case considerations).
Model TCO before you model payback
A defensible ROI model should show three buckets.
Initial investment: Licensing, implementation time, and setup effort.
Operating cost: Ongoing monitoring, maintenance, and support.
Avoided loss: Rework, delay, and business disruption that no longer repeat at the same level.
If you want the formula in plain language, use (Gain from Investment minus Cost of Investment) divided by Cost of Investment. The gain should come from the annualized cost of poor data, not a hypothetical future benefit. That keeps the model grounded in actual waste instead of optimistic projections.
Keep the procurement story simple
Deployment choice affects budget approval. If the platform stays inside the customer's environment, the security review is usually easier to explain. If it computes checks where the data already sits, the team doesn't have to justify moving sensitive data around just to monitor it. If pricing is stable and transparent, finance doesn't have to worry that usage spikes will create surprise charges later.
The cheapest platform on paper can become the most expensive one after security review, data movement, and operational friction get added back in.
The point isn't to chase a theoretical lowest price. It's to show that the business is paying for control, visibility, and reduced waste, not just another tool. That's the kind of investment story a CFO can compare against the cost of doing nothing.
Designing a Pilot to Secure Stakeholder Buy-In
A pilot gives stakeholders something they can inspect before they approve a broader rollout. Start with one business area, bring in management and finance early, define a small set of leading indicators, and capture a baseline before any rule changes or monitoring go live. That sequence keeps the conversation on evidence, not enthusiasm.
A pilot also works best when it is tied to operational waste that people already feel. If the current process forces analysts to recheck records, delays a finance close, or creates manual follow-up between teams, those are measurable costs of inaction. In-database observability helps here because it shows where bad records are created, how often the same issues reappear, and how much rework the team absorbs before anyone calls it a data quality problem.
Choose one dataset that matters
Customer master data, product data, and reporting feeds are common pilot candidates because the impact is visible in day-to-day work. Pick the dataset that already creates friction in a process the business cares about, then identify the people who absorb the cost most directly. If the pilot reduces rework for finance, operations, or a shared service team, support usually follows faster.
A solid pilot plan usually includes:
One business area. Keep the scope narrow enough to measure cleanly.
Two to six leading indicators. More than that, and the team loses focus.
A baseline. Capture the current state before the pilot starts.
A comparison point. Show the gap between current waste and improved performance.
Those indicators should come from actual workflow behavior, not a generic score. Track repeated validation failures, manual corrections, records that require exception handling, or the time spent clearing the same issue across multiple runs. A CFO can work with those metrics because they connect directly to labor, delay, and avoidable operational churn.
Make the pilot hard to dismiss
The pilot should prove one of two things, either the process gets faster, or the rework gets smaller. Better yet, prove both. If the team can show that validation catches problems earlier, incidents resolve faster, or manual checks fall away, the business case becomes much easier to defend.
The strongest pilot narrative is simple. Here's the pain today. Here's how often the same records fail, how much manual cleanup they create, and where that work shows up in the process. Here's the change we will test. Here's how we will know whether the cost of doing nothing is shrinking. That structure helps skeptical stakeholders see the initiative as a controlled experiment rather than a permanent commitment.
If you are building the first version of this business case, start with the cost of inaction, not the wishlist. Then choose one critical data set, one business owner, and a small number of metrics you can track accurately inside your own environment. If you want a platform that monitors behavior in-database and helps tie observability to business impact, visit digna and see how it can support the case you are taking to finance.
Frequently asked questions
Why can't a data quality business case read like an IT ticket?
Because the decision it asks for is a budget decision. A bad report rarely stays a data issue for long, so the case has to be framed in the operational terms the approver already uses rather than in defect counts.
What is the strongest single figure to anchor the case?
Gartner's cited estimate that 40% of the anticipated value of business initiatives is never achieved because of poor data quality. It ties quality to unrealized value rather than to cleanup cost, which is a different and larger argument.
Is the obstacle technical or organizational?
Primarily organizational. The pressure that stalls these initiatives is rarely a missing capability, which is why a case built entirely on tooling tends to lose to a case built on who currently absorbs the cost of failure.
How should the case frame the problem?
As unrealized value with an owner. Naming which initiative lost value, and who is accountable for that initiative, converts an abstract quality argument into a claim the approver can verify against their own numbers.
What does a business case change?
The framing. Quality stops being a request for cleanup capacity and becomes a proposal to recover value that the organization has already budgeted for and not received.


