How to Measure Data Completeness: 8 Practical Methods
|
8
min read
Data Completeness is measured by comparing required data present with expected data. The basic formula is Completeness Rate = (Records with Data / Total Records) × 100, so 9,800 populated phone numbers out of 10,000 expected values produces a 98% completeness rate (Data Quality Sense explains the standard calculation).
A transaction pipeline can report a successful load while still leaving the business with incomplete data. The record count may fall sharply, required customer fields may contain more NULL values than usual, or an entire reporting file may never arrive. The pipeline ran, but the dataset may not be complete enough for the decision waiting downstream.
Data Completeness is the degree to which all data required for an intended use is present. That includes missing field values, missing records, missing transactions, missing datasets, missing historical periods, and missing required attributes. A customer record with a valid name and address but no customer ID is incomplete for any process that depends on that identifier.
Reliable monitoring therefore needs to move beyond a single percentage. It should examine populated fields, complete records, record volumes, expected datasets, delivery timing, and unusual historical changes. The eight practical methods below build that view step by step, then connect each measurement to validation, anomaly detection, timeliness, and historical analysis in digna.
Table of Contents
6. Anomaly Detection and Historical Trend Analysis for Completeness
7. Data Completeness Versus Accuracy and Validity Assessment
1. Field Completeness Rate
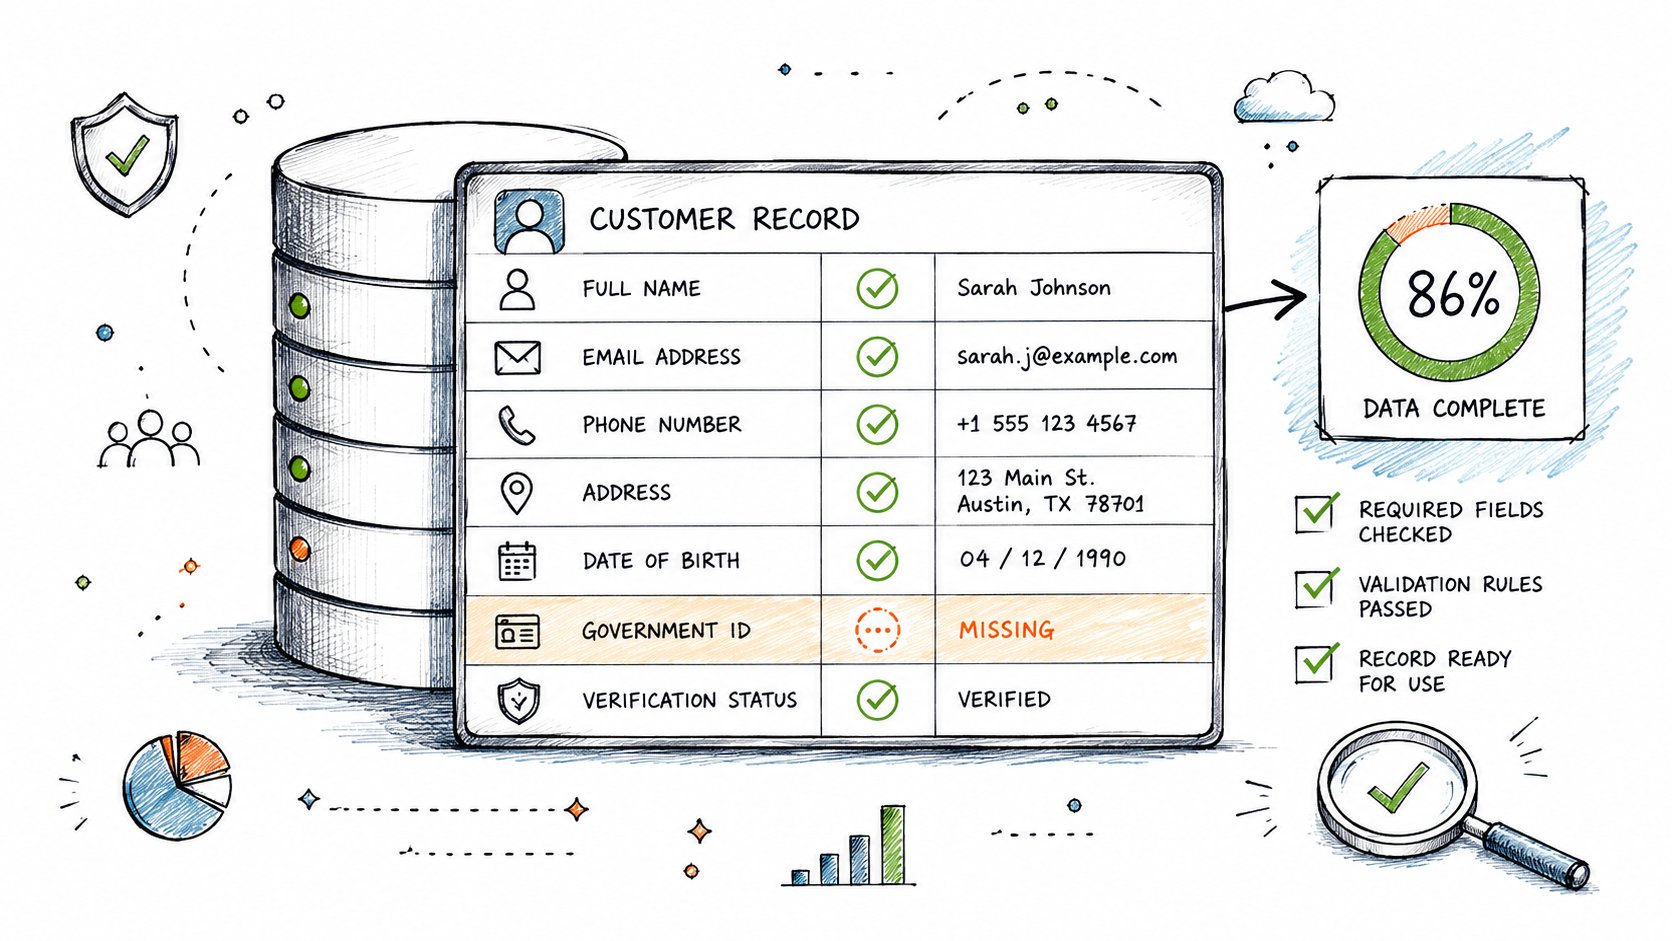
A customer profile may contain a name and address yet remain unusable if its required customer ID is blank. Field completeness rate measures this first layer of completeness: how many values expected in one column are populated. NULLs, empty strings, and other defined missing-value markers belong in the check.
Use the following calculation:
Completeness rate = populated values / expected values × 100
For example, if an account table contains 4,500 expected email addresses and 4,365 are populated, the field completeness rate is 97%. This percentage-based method follows Data Quality Sense's completeness guidance.
The denominator must match the business rule. A customer ID may be required for every transaction, so all transaction rows belong in the denominator. A field that applies only to eligible customers should be measured against that eligible population. Counting inapplicable rows as missing would make the score look worse than the process really is.
Set thresholds by business use
100% is the ideal reference point for many governed fields. Required-field service levels may be set above 95%, depending on business risk and the consequences of missing values, as SailPoint describes these target-setting practices. A transaction identifier may require full coverage, while a lower-risk descriptive attribute may allow limited missingness if downstream users know the constraint.
Set a threshold for each important field instead of relying on one dataset average. An average can hide a serious gap in an identifier column. Data Quality Sense recommends treating null rate as a core completeness signal, so pair the rate with explicit NULL and empty-value checks.
In digna, Data Validation can run these checks for customer IDs, transaction amounts, timestamps, account numbers, and other mandatory attributes. Save results by field and source system. That history supports validation at ingestion, anomaly detection after a change, and later comparison of completeness across periods.
Practical rule: Document which fields each business process requires before setting thresholds. A percentage has meaning only when its expected population and intended use are clear.
2. Record Count Monitoring
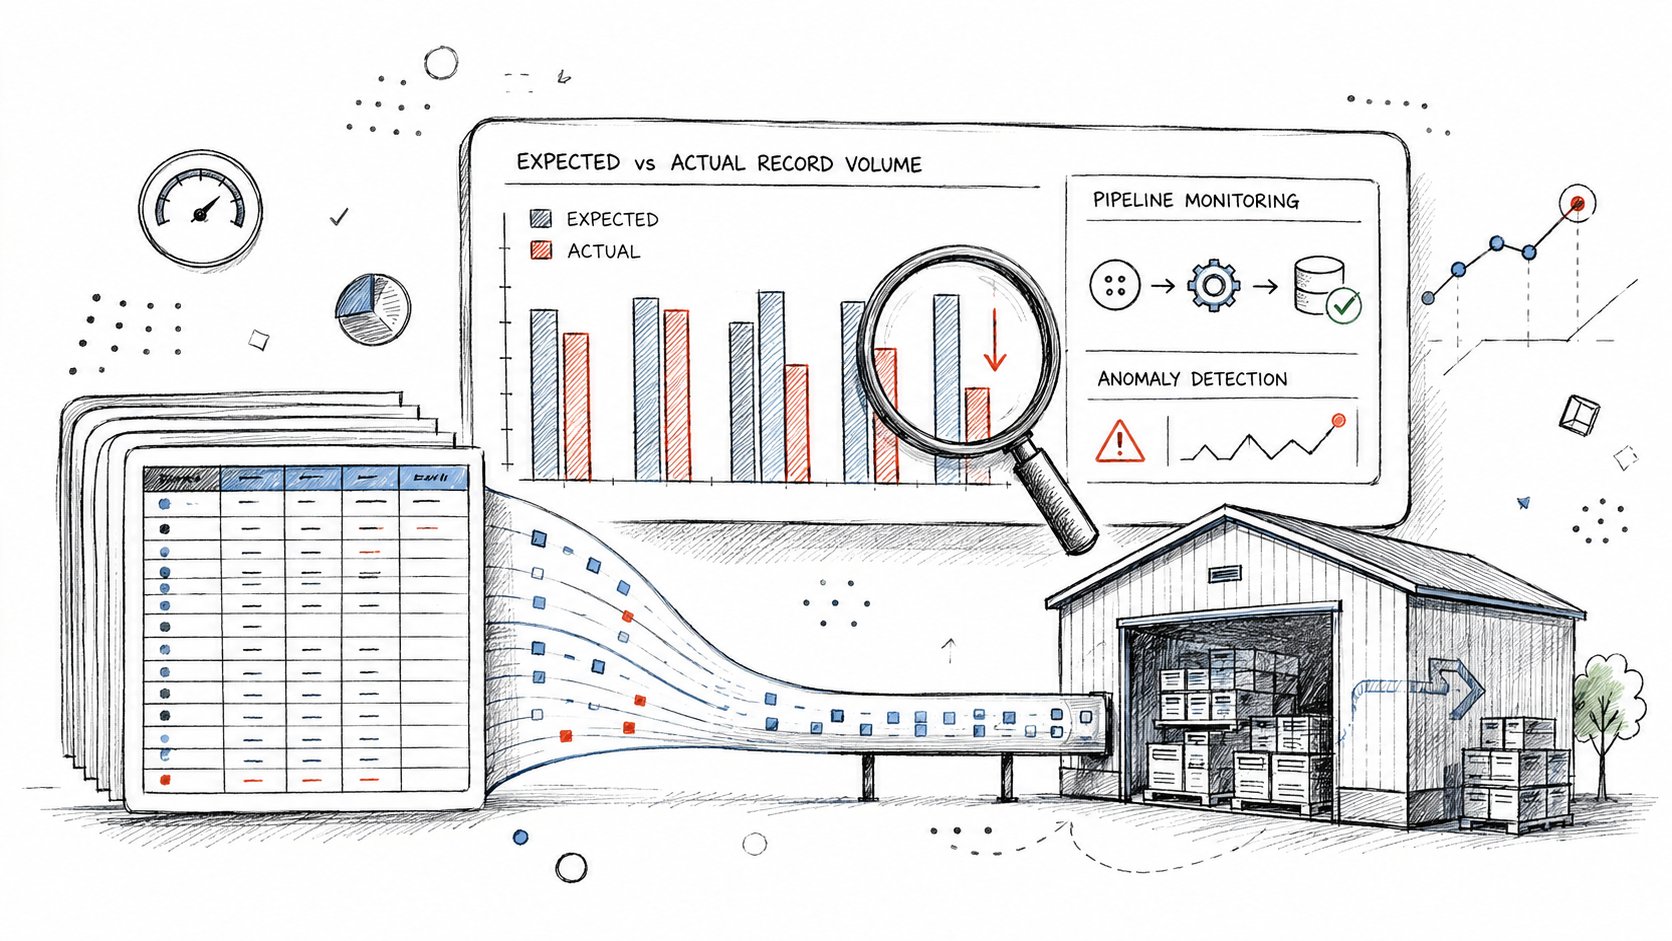
A dataset can contain well-populated fields and still be incomplete because entire records never arrived. Record count monitoring compares the number of loaded rows with an expected volume, a defined minimum, or the historical behavior of the same dataset.
Consider a daily transaction table that normally receives 10 million records but suddenly contains only 7 million. That change can indicate an incomplete data load or missing source records. The example is part of the supplied operational scenario, and it illustrates why a successful pipeline status doesn't prove that all expected business events were delivered.
Record-count checks work at two levels. An absolute rule can flag a count below a business-defined minimum. A comparative check can flag an unusual change against the dataset's own history. The second approach is valuable when legitimate volume varies by weekday, season, region, or accounting cycle.
Investigate drops and increases
A sudden drop is an obvious warning, but an unexpected increase can also indicate duplication, replayed files, a join explosion, or a source-system change. Teams should preserve the count alongside load time, partition, source, and business date so investigators can narrow the affected scope quickly.
Avoid copying a generic range from another dataset. Establish expected behavior from the table's own history, then account for known business cycles such as month-end processing or seasonal demand. The source data may also arrive in batches, so the check should run at a point when the load is expected to be complete.
digna Data Anomalies can identify unusual record-volume behavior without forcing engineers to maintain a separate threshold for every table. Correlate the volume signal with field completeness. A lower row count combined with a rise in missing customer IDs points toward a broader ingestion problem, while a lower count with stable field coverage may suggest a missing partition or business segment.
Record count monitoring also applies to missing rows within a period. If a source system should deliver transactions for every region or business unit, compare counts by those dimensions rather than only at the total-table level. A complete-looking total can hide a missing regional extract offset by higher activity elsewhere.
3. NULL Rate Monitoring
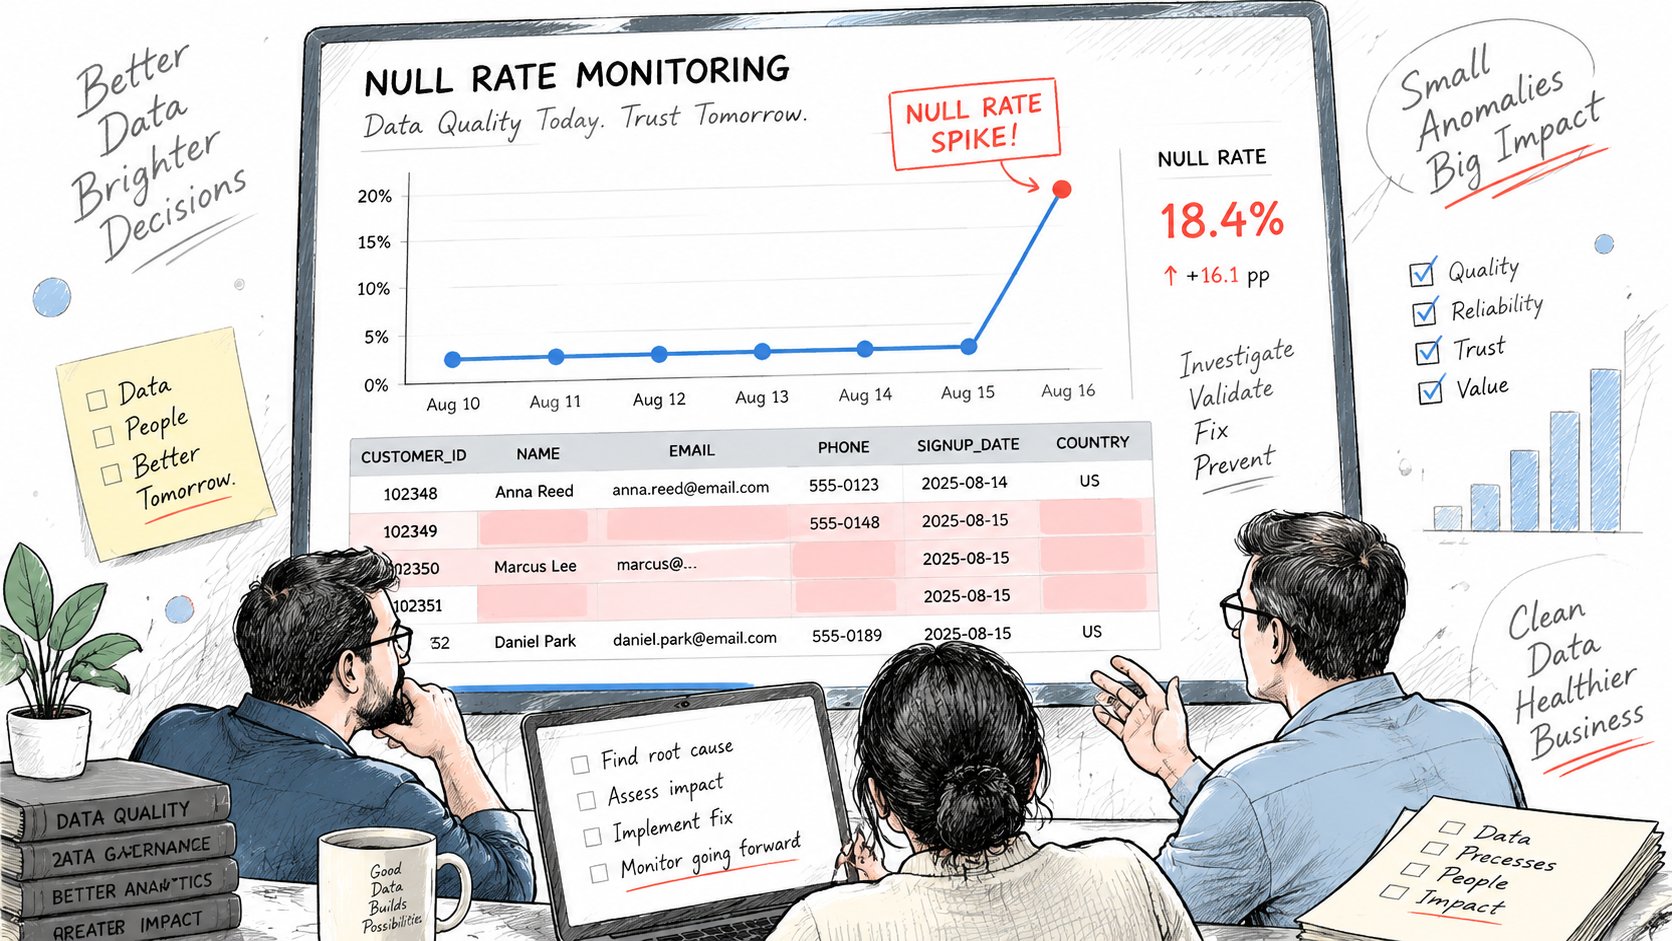
NULL rate monitoring measures the share of expected values that are missing and tracks that share over time. At field level, calculate it as:
NULL rate = null or empty values / total expected values × 100
Completeness and NULL rate describe opposite sides of the same condition. Completeness shows what is populated; NULL rate shows what is absent. Data Quality Sense identifies NULL rate as a central completeness measure.
The current rate is only one part of the assessment. A field with stable, accepted missingness may support its intended process, while a sudden increase can indicate a broken interface, changed mapping, failed transformation, or altered source behavior. Compare the current result with the field's own baseline and connect it with validation results, load timing, and source changes.
Treat missingness as context, not just a count
A NULL does not always mean the same thing. It may represent a value that was not captured, a field that does not apply, an intentional omission, or a special state coded differently across systems. Before calculating a qualified completeness measure, classify NULLs, blank strings, placeholder text, and special codes. Independent data-quality documentation warns that crude missingness can mislead when missing values are poorly coded.
Eligibility rules prevent permitted non-applicability from appearing as a failure. For example, compare a billing-contact field only among records for which a billing contact is required. Also separate sources and ingestion paths, because a customer master and a manually entered service system may have different normal patterns.
A practical monitoring model combines four checks:
Static requirement: Alert when a mandatory field exceeds its accepted NULL rate.
Historical change: Alert when the current rate differs unusually from the field's baseline.
Source comparison: Examine behavior by source system, region, or ingestion path.
Change correlation: Review deployments, interface changes, and mapping updates beside NULL-rate shifts.
Data Quality Sense's completeness reference describes populated, null, and incomplete counts as useful monitoring views. These counts connect an alert with investigation. Analysts can identify the affected records, sources, periods, and business conditions, then compare the missingness pattern with validation failures or delayed loads.
4. Record Completeness Assessment
Field completeness asks whether individual columns are populated. Record completeness asks whether each record contains the full set of attributes required for a particular process. This distinction matters because several fields can each look acceptable while the same customer records remain partially populated.
Suppose a customer record requires a customer ID, name, email, and address. Record completeness counts how many customer records contain all four required attributes. A result such as 97% of customer records contain all required attributes gives process owners a different insight from four separate field percentages. The record-level definition and calculation are described by The Pedowitz Group's completeness guidance.
The correct requirements depend on the downstream use. An underwriting process may need a complete loan application before review. A billing process may need an account number, service address, and billing contact. A reporting dataset may require a timestamp and business key even when a descriptive field is optional.
Find the pattern behind incomplete records
Start with a record-level rule that evaluates all mandatory fields together. Then retain the individual failure reasons. The combined result tells you how many records are usable, while the field-level reasons show what prevents the remaining records from being used.
For example, an e-commerce purchase record may require an order ID, customer ID, product ID, quantity, price, and timestamp. A record missing one of those values should fail the complete-record rule if revenue analytics depends on the full combination.
Use digna Data Validation for record-level checks against explicit business requirements. Separate record types when their requirements differ. A customer, transaction, claim, and service order shouldn't automatically share one completeness definition.
A complete record is not the same as a complete dataset. You need both views to understand whether individual rows are usable and whether the expected population arrived at all.
Track two outputs:
Complete-record coverage: The share of records meeting every requirement for the intended process.
Failure composition: The fields most often missing within incomplete records.
This combination supports remediation. If a small number of fields fail across many records, fix the source or mapping. If many fields fail in a small group of records, investigate a particular source, record type, or ingestion partition.
5. Dataset and Period Completeness Verification
Some completeness failures occur above the row and column level. The entire expected dataset may be absent, one reporting period may be missing, or a source may stop delivering data for a particular region. Dataset and period completeness verification asks whether the expected files, tables, partitions, and business dates exist at all.
Typical checks include:
Expected file arrival: Confirm that the daily sales or settlement file arrived.
Period coverage: Verify that all expected days, months, or quarters are represented.
Source coverage: Check that each business region or upstream system delivered data.
Partition presence: Confirm that the warehouse contains the expected date and entity partitions.
A dataset can pass field-level validation because the rows that did arrive are perfectly populated. That result still doesn't justify publishing a report if an entire reporting period is absent. Completeness must be evaluated against the reporting calendar and the business scope.
Add delivery timing to the completeness definition
Delivery timing provides an operational signal. If a daily file is expected within a defined window and hasn't arrived, the dataset is not available for the process, even if it may eventually appear. digna Timeliness can monitor arrival patterns, flag missing or delayed loads, and calculate expected delivery times from observed behavior.
For a practical data completeness checks framework, define an expectation for each dataset:
Name the source and destination.
Specify the expected business date or partition.
Define the delivery window and time zone.
Record dependencies on upstream files or jobs.
Set a recovery action for a missing or late delivery.
This approach helps teams catch a missing daily sales file before a dashboard runs with a silent gap. It also supports data collection for IEP teams, where expected periods and required records must be tracked explicitly rather than inferred from whatever data happens to be available.
Document fallback sources and rerun procedures. A missing dataset may result from a source outage, a scheduler failure, a rejected file, or a dependency that completed late. The alert should point investigators toward those possibilities instead of treating every absence as the same defect.
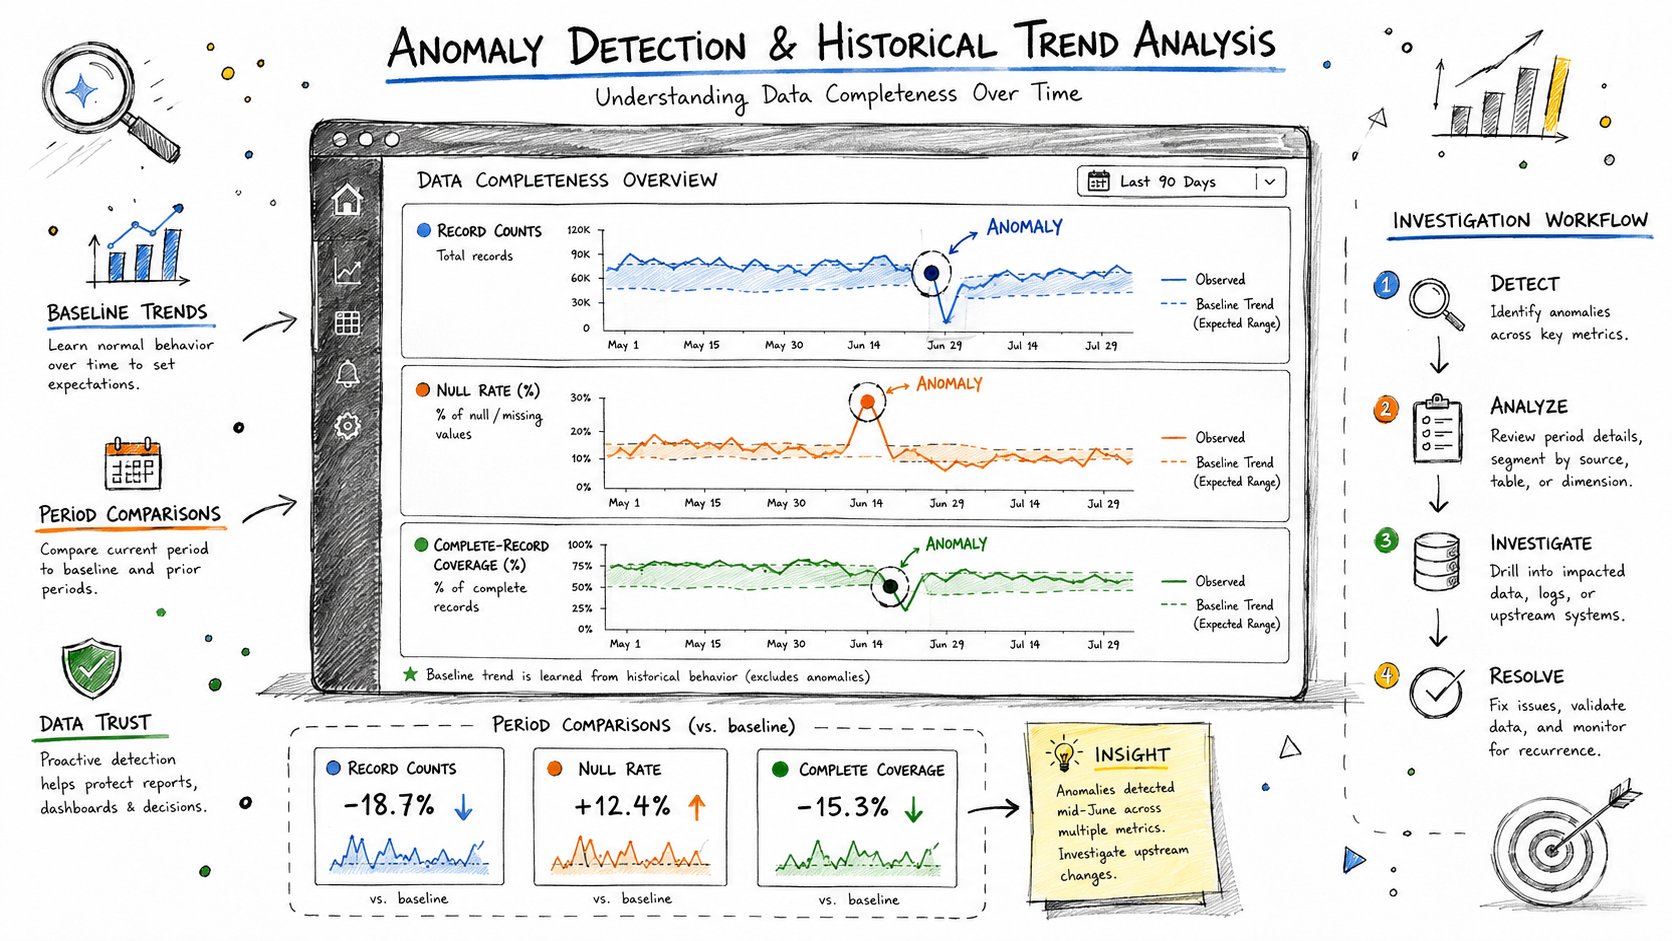
6. Anomaly Detection and Historical Trend Analysis for Completeness
Fixed rules identify known requirements. Anomaly detection and historical trend analysis identify completeness patterns that change without a predefined failure condition. Useful signals include NULL rates, populated values, record counts, complete-record coverage, delivery times, and the presence of expected periods.
A dataset can deteriorate gradually. Record counts may fall across several loads, or a required field may become less populated after a system change. Each metric can remain above its alert threshold while the overall risk grows. Historical comparison makes that direction visible, much like comparing today's reading with a patient's established baseline rather than judging it alone.
Use digna's time-series anomaly detection approach to compare current completeness behavior with learned patterns. The objective is to flag meaningful change for review, not to classify every deviation as a defect.
Combine baselines with domain judgment
An anomaly becomes useful only after its context is checked. A month-end reconciliation process may produce a recurring pattern. A new registration workflow may intentionally change which fields are populated. A source migration may create a temporary transition that requires separate handling.
Review signals on a regular cadence and retain the observations. digna Data Analytics provides historical context for trends, volatility, recurring failures, and differences between periods. Analysts can ask when the change began, whether it affects every source, and whether it follows a schedule.
Use this sequence:
Detect: Find an unusual change in volume, NULL rate, or complete-record coverage.
Locate: Break the signal down by source, region, partition, record type, or process.
Correlate: Compare it with deployments, schema changes, operational events, and delivery delays.
Validate: Ask the domain owner whether the change is expected.
Remediate: Fix the source or pipeline, then confirm that the metric returns to an acceptable state.
Store completeness observations consistently. Daily collection suits many operational datasets, while high-volume pipelines may need more frequent checks. Trend analysis is reliable only when the metric definition, scope, and expected behavior remain stable. Keep those details with each observation so later comparisons do not confuse a measurement change with a data-quality change.
7. Data Completeness Versus Accuracy and Validity Assessment
Completeness is necessary, but it doesn't answer every data-quality question. Completeness asks whether required data is present. Accuracy asks whether it correctly represents reality. Validity asks whether it conforms to defined rules.
A phone number demonstrates the difference clearly:
Missing value: A completeness problem.
Present but incorrectly formatted: A validity problem.
Correctly formatted but belonging to another person: An accuracy problem.
The same distinction applies to a customer ID. A populated ID can satisfy a field-completeness check while failing validity if it violates the expected format or relationship. It can also fail accuracy if it identifies the wrong customer.
Monitor dimensions together
Use digna Data Validation to apply explicit checks for required values, formats, ranges, relationships, and business logic. This guide to validity-checker tools provides useful context for treating validation as broader than NULL detection.
A shared quality view should show the dimensions separately and together. The remediation path differs:
Completeness failure: Find why the value, record, or period is absent.
Validity failure: Correct the format, domain, type, or relationship rule.
Accuracy failure: Compare the value with a trusted source or real-world event.
Conditional requirements also matter. An attribute may be mandatory only when another field indicates that the record is eligible. A crude global completeness score can penalize valid design skips unless the rule includes that condition.
Avoid the false reassurance of a high score
A dataset with every required field populated may still contain incorrect addresses, invalid account numbers, or wrong transaction amounts. Conversely, a dataset can contain accurate values for the rows it received while missing an entire source period.
Completeness is evidence that required information is present. It isn't evidence that the information is correct, valid, timely, or sufficient for every analysis.
Prioritize issues by business impact. A consistently populated field with incorrect values may create greater risk than an optional attribute with occasional missingness. Business users should help define that priority because they understand how each defect affects reporting, operations, compliance, and decisions.
8. Continuous Monitoring Strategy
A reliable completeness program combines deterministic validation, anomaly detection, timeliness monitoring, and historical analysis. Each layer answers a different question. Validation asks whether known requirements are met. Anomaly detection asks whether current behavior differs from the normal baseline. Timeliness monitoring checks whether expected data arrives when required, while historical analysis shows whether a gap is isolated, recurring, seasonal, or worsening.
Start by defining what makes a record usable and what makes a dataset usable. Then connect each definition to the right measurement:
Required-field validation: Detect missing mandatory values, such as a customer ID or transaction amount.
Record-level validation: Confirm that an eligible record contains all attributes needed for its intended use.
Record-count monitoring: Identify missing or unexpectedly duplicated populations.
Timeliness monitoring: Detect late, early, or absent deliveries.
Anomaly detection: Flag unusual changes in volume, NULL rates, delivery behavior, or complete-record coverage.
Historical analysis: Compare completeness across periods to identify recurrence and long-term change.
Schema monitoring: Catch structural changes that can introduce new missingness.
These layers work like several instruments on the same control panel. A field check may show that values are present, while a record-count check reveals that an entire source population never arrived. A timeliness alert may then explain why both signals changed.
digna supports this operating model through Data Validation, Data Anomalies, Data Analytics, Timeliness, and Schema Tracker. Metric computation and analysis run inside the customer's databases. Private-cloud and on-premises deployment options support enterprise control requirements.
Correlate signals before assigning ownership
Suppose validation failures rise while record counts fall and a source arrives late. Together, these signals may indicate one incomplete upstream extract. Treat the event as one investigation rather than opening separate tickets that hide the connection.
A practical routine is:
Define required fields and eligible records with business owners.
Set expectations for volume, period coverage, and arrival timing.
Apply deterministic checks to known requirements.
Establish baselines for important completeness metrics.
Correlate alerts across validation, anomalies, timeliness, and schema changes.
Review recurring issues and trends with data owners.
Revisit rules when business processes or source systems change.
Interpret missingness according to eligibility, encoding, source context, and downstream use. A missing value can be expected for an ineligible record, while a missing period or absent dataset can indicate a delivery failure. Research on missing-data mechanisms notes that presence indicators alone may not show whether missingness is structurally informative or biased.
8-Point Comparison: How to Measure Data Completeness
Method | 🔄 Implementation complexity | ⚡ Resource requirements | 📊 Expected outcomes | 💡 Ideal use cases | ⭐ Key advantages |
|---|---|---|---|---|---|
Field Completeness Rate | Low, simple SQL/NULL checks | Low, minimal compute/storage | Field-level % completeness; pinpoint missing fields | Required-field compliance, audits, basic validations | Transparent, easy to implement, actionable |
Record Count Monitoring | Low, periodic counts and baselines | Low, lightweight aggregations, historical counts | Detects missing loads and volume anomalies | Batch/stream load monitoring, pipeline failure detection | Fast detection of missing datasets; low cost |
NULL Rate Monitoring | Medium, trend tracking & baselining | Medium, historical metrics & monitoring | Trends/spikes in NULL proportions over time | Fields where missingness signals change in sources | Sensitive to emerging problems; early warnings |
Record Completeness Assessment | Medium–High, multi-field rules per record | Medium, per-record validation compute | % of records meeting all required attributes | Downstream processes needing complete records (underwriting, billing) | Business-relevant metric; prioritizes remediation |
Dataset & Period Completeness Verification | Low, presence/schedule checks | Low, minimal checks + schedule metadata | Confirms dataset/file arrival and period coverage | Scheduled batches, regulatory/periodic reporting | Prevents missing-period reports; simple to enforce |
Anomaly Detection & Historical Trend Analysis | High, ML baselines & time-series analysis | High, historical storage, ML compute | Detects unusual deviations and slow degradation | Complex pipelines, seasonal patterns, enterprise monitoring | Catches subtle/gradual issues; fewer false positives |
Completeness vs Accuracy & Validity Assessment | High, integrates multiple quality dimensions | High, cross-dimension checks and tooling | Holistic quality profile (completeness+accuracy+validity) | Data governance, remediation prioritization, audits | Prevents narrow fixes; focuses on business impact |
Continuous Monitoring Strategy (Integrated) | High, combine rules, anomalies, analytics | High, multiple modules, alert correlation | Comprehensive coverage with correlated alerts & context | Enterprises with critical pipelines and heterogeneous sources | Combines strengths of all methods; reduces missed issues |
From Completeness Percentage to Data Confidence
No single metric proves that a dataset is complete for every purpose. A field completeness rate can show that required values are populated, but it won't reveal a missing file, an absent business region, a late delivery, or a slow decline in record volume. A complete-record percentage can show that rows are usable, but it won't prove that the expected population arrived.
The strongest measurement model progresses through several levels:
Field level: Are required values populated?
Record level: Does each usable record contain all required attributes?
Volume level: Did the expected number of records arrive?
Dataset level: Are the expected files, tables, and partitions present?
Period level: Does the data cover every required business date or reporting period?
Timeliness level: Did the data arrive within its expected window?
Behavioral level: Are NULL rates, counts, and populated values behaving normally?
Quality-dimension level: Is the present data also accurate and valid?
This layered view prevents a successful pipeline status from becoming a false assurance signal. It also helps teams assign the right owner. A missing required value may belong to a source application team. A missing partition may belong to ingestion. A late file may require pipeline or scheduler investigation. A schema change may require coordination with downstream consumers.
Define “complete” for the decision
The acceptable level of completeness depends on intended use. Data-quality guidance from the University of Greifswald notes that there is no universal cutoff for acceptable missingness. The relevant question is whether the remaining complete records support the decision, report, model, or operational process.
That means a governance team should document:
Which attributes are mandatory.
Which records are eligible for each requirement.
Which sources and periods are expected.
What delivery window applies.
Which completeness gaps block publication or processing.
Which missingness patterns require investigation even when a threshold passes.
Then measure both the score and the reason behind it. A single average can conceal a critical column, source, region, or period. Break metrics down by the dimensions that matter to the process, and retain enough history to identify recurring failures.
Turn monitoring into an operating practice
A practical implementation starts with deterministic rules for known requirements. Add expected volume and delivery checks. Establish historical baselines for NULL rates and record populations. When an alert fires, investigate correlated signals rather than treating each metric independently. Review trends with business owners so that legitimate process changes aren't confused with defects.
digna offers a modular path for this work. Data Validation can enforce required values and record-level business rules. Data Anomalies can identify unusual changes in completeness-related behavior. Data Analytics can provide historical context. Timeliness can monitor arrival patterns and missing loads. Schema Tracker can detect structural changes that may introduce new completeness problems.
The platform executes checks and metric computation in the customer's databases, with private-cloud and on-premises deployment options for organizations that need data to remain in their own environment. That architecture supports a controlled approach across warehouses, lakes, and pipelines, while a shared dashboard gives engineers, analysts, and stakeholders a common view of incidents and trends.
Data Completeness isn't just a percentage. It's a statement about whether the information required for a real business purpose is present, available at the right time, and stable enough to trust. Measure the individual values, complete records, record volumes, expected periods, delivery behavior, and historical changes. Then connect those signals to Accuracy and Validity so teams know not only what is missing, but also whether the data that arrived can support the decision.
digna combines Data Validation, Data Anomalies, Data Analytics, Timeliness, and Schema Tracker to help teams monitor completeness across enterprise data. Visit digna to explore a modular observability platform that runs in your environment and helps you investigate missing values, missing loads, unusual changes, and related data-quality issues.
Frequently asked questions
What is the standard completeness formula?
Completeness Rate = (Records with Data / Total Records) × 100. So 9,800 populated phone numbers out of 10,000 expected values produces a 98% completeness rate, which is the baseline every other method refines.
Why isn't a single percentage enough?
Because a transaction pipeline can report a successful load while still leaving the business with incomplete data. Reliable monitoring has to move beyond one number into field, record, NULL-rate, timeliness and anomaly checks that each catch a different gap.
What does field completeness rate measure?
Populated values divided by expected values, times 100, for one field at a time. A customer profile may contain a name and address yet remain unusable if its required customer ID is blank, which a table-level percentage would hide.
Which checks belong in a continuous plan?
Field and record completeness for structure, NULL rates for presence, timeliness so a late partition does not read as a missing one, and anomaly detection for the gaps that appear without breaking any stated rule.
Why measure completeness against expectation rather than volume?
Because volume tells you what arrived and expectation tells you what should have. A load that delivers a plausible number of rows from only half the source regions passes a volume check and fails a completeness one.



