How to Run a Query Efficiently in 2026
|
0
min. czyt.

You can ship a query that returns rows, passes tests, and still causes trouble in production. The breakage usually shows up later, when a dashboard is slow, a reconciliation number is off, or a downstream job consumes the wrong grain of data without anyone noticing. If you run a query often enough, you learn that “it finished” is the lowest bar, not the one that keeps a warehouse trustworthy.
Table of Contents
Optimizing Analytical Queries with Statistics and Predicate Design
Beyond Syntax The Semantic Validation Gap in Query Monitoring
Handling Late, Changing, or Partial Data in Query Operations
Why Running a Query Means More Than Just Executing SQL
A query used to be treated like a line of text sent to a database. That view is too small for modern systems, because the database is choosing access paths, join order, and resource use while it works toward the result. The relational model from Edgar F. Codd in 1970 shifted the idea toward declarative requests, where the user states the desired result and the system decides how to retrieve it, and IBM's System R turned that idea into a practical system with a cost-based query optimizer that compared alternative plans before execution (IBM history on Patricia Selinger).
That shift still matters every time a team runs a query in a warehouse, an operational database, or an observability workflow. The result depends on data volume, intermediate results, scan volume, and the resources available at that moment, not just on whether the SQL parses. For teams working with observability and data quality, the query is the operation you measure, not just the text you review, which is why platforms built around execution behavior, such as digna's data observability, focus on what the query does inside the database rather than on syntax alone.
Practical rule: treat the execution plan as part of the query, because that's where cost, resource pressure, and plan drift show up first.
Why syntax checks aren't enough
A syntax check tells you the statement is valid. It doesn't tell you whether it read too much data, joined in the wrong order, or produced a result that still looked plausible enough to slip through review. That's the gap production teams keep running into, especially when query success is judged by completion alone.
The other blind spot is historical behavior. The same SQL can run differently after data grows, statistics change, or a join path becomes less selective. Standardization history also explains why teams can't rely on one vendor's behavior forever, because SQL has evolved across ANSI and ISO revisions over decades while remaining the shared language for relational systems (ANSI's SQL standard history).
The Standard Workflow for Running a Query
The most reliable production workflow starts before the database does any heavy lifting. Define the required output first, then ask for only the minimum columns needed to support it. That keeps the query focused and avoids dragging unnecessary data through later joins and aggregates.
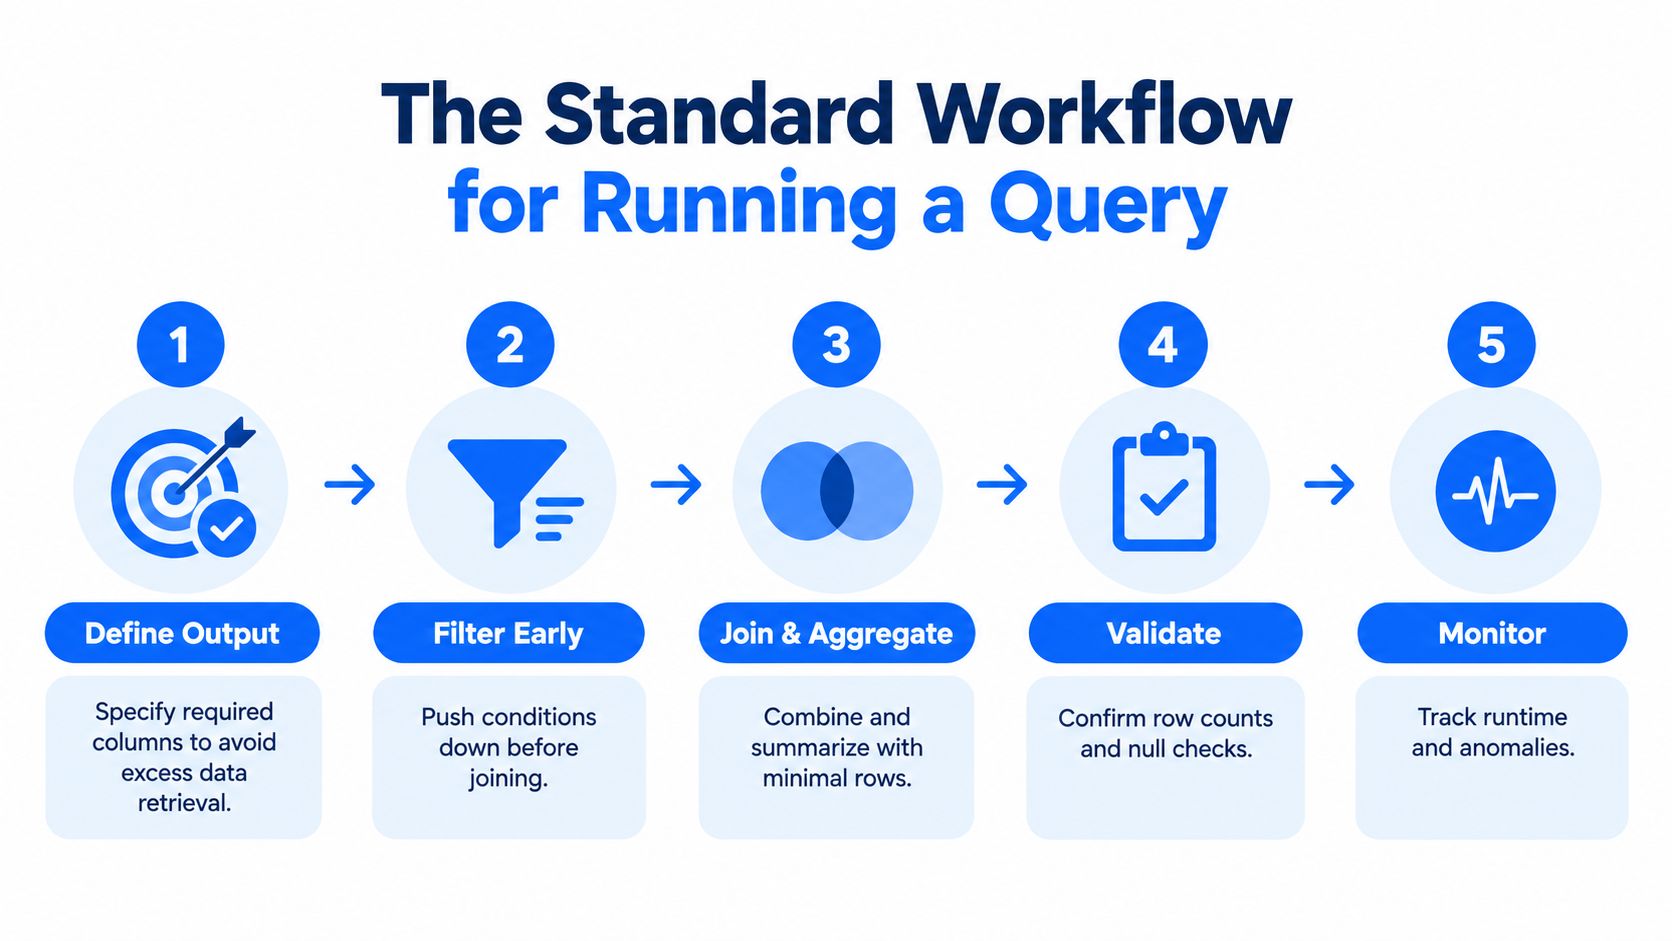
Step 1 Define the output
The output definition should include the grain you want, the row population you expect, and the columns that are required. If the business question is daily customer activity, don't query at account-month grain and hope the numbers reconcile later. A query that asks for less is easier to reason about, cheaper to execute, and much less likely to surprise you.
Step 2 Filter before you join
Push conditions down early so the database works on fewer rows. That pattern aligns with Microsoft's guidance to query only required columns and reduce data before JOIN operations, and it matters even more when source tables are large or skewed (Google BigQuery performance best practices).
Step 3 Inspect the execution plan
A plan review should cover join order, scan volume, cardinality estimates, and any sort or aggregation stage that could become a bottleneck. Don't trust “looks fine” in the SQL editor. Check what the optimizer thinks will happen, then compare it with the workload you expect.
Step 4 Benchmark against representative data
Run the revised query against realistic partitions, not toy samples. A query that is fast on a narrow slice can fall apart on the current month, the largest tenant, or a cold-cache path. Measure the result against the latency and resource budget you set up front.
Keep the query boring in production. Boring means bounded, measurable, and stable across the partitions your team really queries.
Step 5 Validate the runtime behavior
Use plan metadata and job metadata to diagnose where the time goes, then rerun after each meaningful change. In practice, a query is “done” only when it returns the right result, stays within budget, and behaves consistently across representative data.
For teams that want a deeper operational model, pipeline orchestration for query workloads helps connect the query to the rest of the data flow instead of treating it as an isolated command.
Optimizing Analytical Queries with Statistics and Predicate Design
Analytical workloads often go unnoticed before they fail loudly. The SQL is valid, but the optimizer gets a bad signal because the join keys don't line up cleanly, catalog statistics are stale, or a predicate forces a broader scan than it should. IBM's tuning guidance calls out data-type mismatches, expressions in join predicates, non-equality joins, unnecessary outer joins, redundant restrictions, and inaccurate catalog statistics as recurring risks, and that list matches what teams see in real systems (IBM DB2 query tuning guidance).
What breaks analytical performance
Expressions on indexed or partitioning columns are a common trap. Once you wrap the column in a function, the predicate can become non-sargable, which means the database can't use the access path you expected and ends up scanning more data than necessary. Data-type validation matters just as much, because a join key mismatch can push the optimizer toward a less efficient plan.
This is also where practical learning resources help. If you're building your own database skill set and want to sharpen the tuning side, build database projects without a degree is a useful outside read because it frames skill growth around real work instead of theory.
A disciplined validation loop
Run the query once for correctness, then compare estimated rows against actual rows at each stage. After that, test cold-cache and warm-cache behavior, measure elapsed time and resource use, and change only one thing at a time. That sequence is slower than blindly tweaking SQL, but it's the only way to know whether a change improved the plan or just moved the cost somewhere else.
A strong routine should include:
Validate join keys first. Make sure data types match before you touch indexes or hints.
Check estimation errors. If the plan's row estimates are off, tune the statistics or the predicate shape before blaming hardware.
Measure resource consumption. CPU, memory, bytes scanned, and spill or shuffle volume tell you whether the query is healthy.
Repeat after one change. Multiple edits at once hide the cause of the improvement or regression.
For teams standardizing query tuning, SQL query optimisation guidance is useful because it ties predicate design to the actual execution path instead of treating optimization as a formatting exercise.
Beyond Syntax The Semantic Validation Gap in Query Monitoring
A query can execute successfully and still be wrong in ways that matter. It can duplicate rows through a join, drop late-arriving records, shift a date boundary by accident, or aggregate at the wrong grain while returning a perfectly clean result set. That's why syntax and execution status are weak signals on their own.
Independent database research shows that cardinality-estimation errors are widespread and often the dominant cause of poor query plans (VLDB research on query behavior and cardinality estimation). That matters because the optimizer's assumptions shape the plan, and the plan shapes performance and, sometimes, the result quality you think you're getting.
Execution success versus semantic success
Execution success means the engine finished the statement. Semantic success means the query returned the right population, at the right grain, with the right business meaning. Those are different tests, and production teams need both.
A query-monitoring stack that stops at runtime misses the most dangerous failures. The query can be fast, cheap, and still wrong. In finance, healthcare, telecom, and public-sector environments, that kind of error can contaminate reports, operational decisions, or model inputs without triggering an obvious incident.
A stronger production pattern is to attach expectations to every critical query:
Expected grain. Know whether the output should be customer-day, account-month, or something else.
Reconciliation totals. Compare output totals with a trusted control total when one exists.
Representative edge cases. Check late arrivals, duplicate keys, and boundary dates explicitly.
Behavioral baseline. Compare the current result shape with prior runs and watch for drift.
digna's in-database approach fits this model because the checks run where the data lives, so teams can validate behavior without moving sensitive records out of the warehouse or operational store. That's a practical advantage when the goal is observability, not another copy of the data.
Handling Late, Changing, or Partial Data in Query Operations
A query can finish cleanly and still be wrong for production use. A file may land after the cutoff, a source can backfill rows, or a producer can change shape without notice. The SQL still runs, but the result may no longer match the business slice you intended. Teams that rely only on pass or fail checks usually find out after a dashboard shifts or a downstream job consumes the bad output.
The European Commission's data-quality guidance treats quality as purpose-dependent and names accuracy, completeness, consistency, uniqueness, integrity, timeliness, provenance, and data-collection methods as quality attributes. That framing fits operational query work better than a binary success flag.
Monitoring needs a severity model
Freshness, period coverage, schema changes, and completeness checks should not all trigger the same response. A late-but-valid load may deserve a warning. A missing source file should block downstream use. If every issue is fatal, teams stop trusting alerts. If every issue is informational, nobody reacts fast enough.
Strong control comes from context-aware thresholds, not one pass or fail rule for every dataset.
The harder call is separating late-but-valid data from missing data. Historical arrival patterns help. Seasonal baselines help too. So does a clear owner for each check. Preserve evidence for review, because the post-incident questions are usually simple: what changed, when did it change, and was the result still safe to use?
Where context beats rigidity
If a source normally lands early but arrives late once a week, the policy should reflect that pattern. If a dataset is corrected later in the day, monitoring needs to allow interim inconsistency without masking real breakage. That is the line between durable control and brittle automation.
For teams that need a concrete definition of freshness, data timeliness metrics and monitoring gives a practical way to set the rule set and the alert severity model.
Late and changing inputs also need semantic checks. Grain, population, and business meaning can drift even when freshness looks acceptable. That is where an in-database approach helps, because it lets teams validate those conditions where the data lives instead of copying records out just to inspect them.
Practical Takeaways for Reliable Query Execution
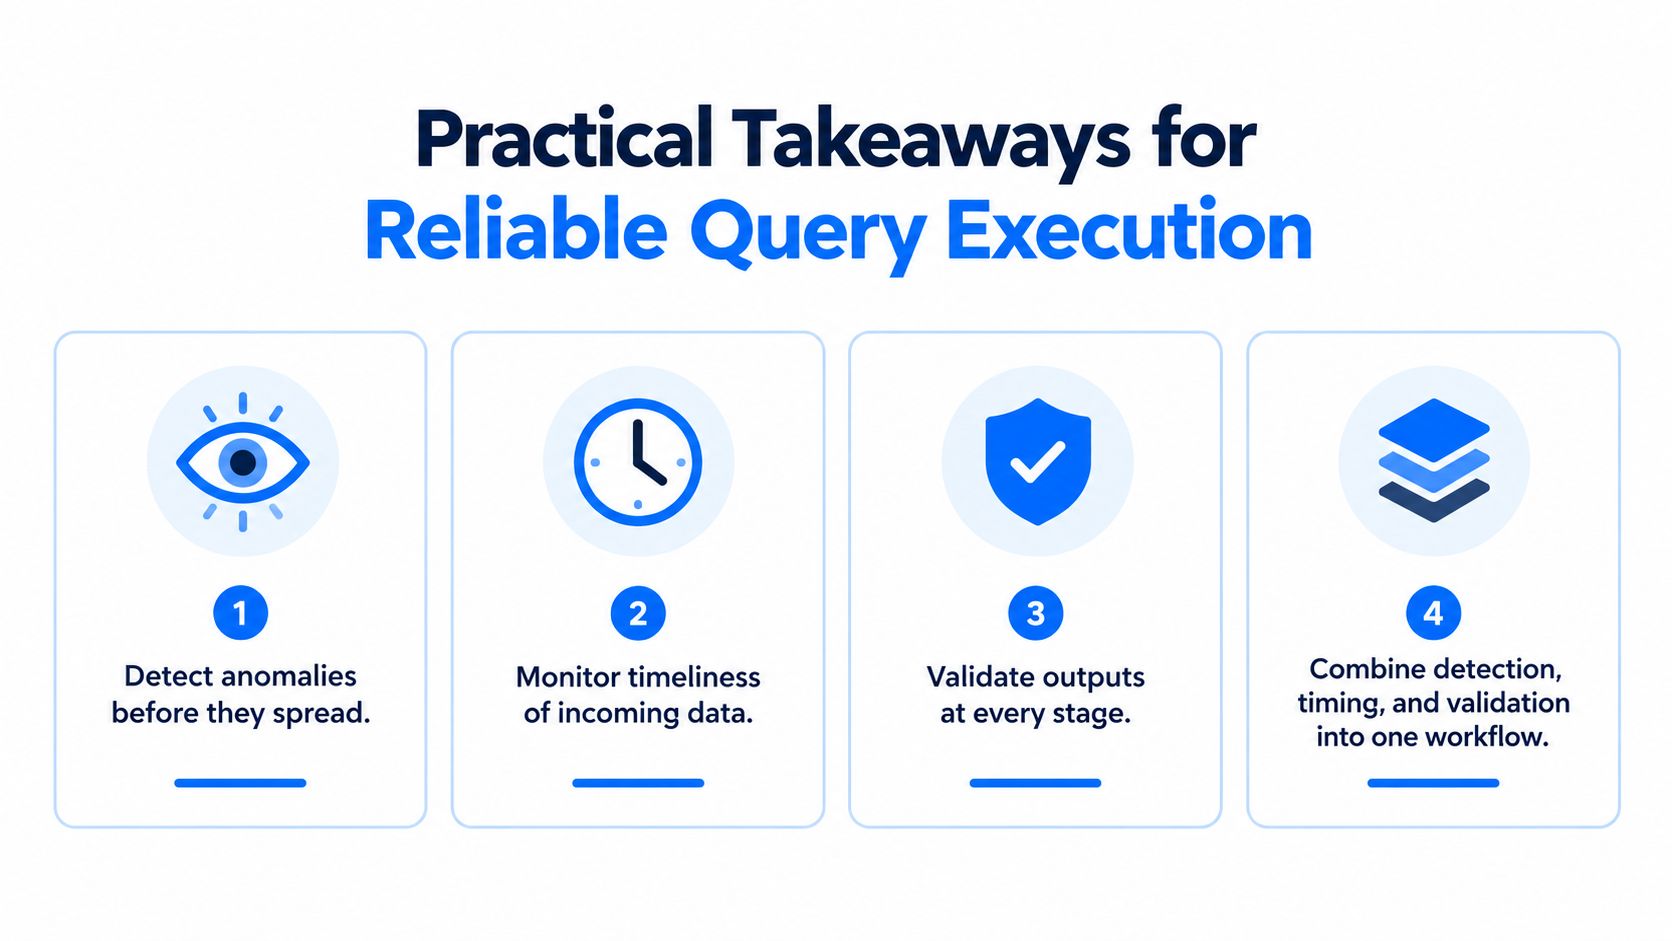
A query that returns cleanly can still be wrong. In production, reliable execution depends on performance control, timeliness control, and semantic validation working together, because a fast result with the wrong grain or population is still a failed outcome.
What to standardize
Start with the expected grain and the acceptable latency window for each important query. Record a baseline for runtime, rows scanned, and output shape, so regressions are visible when behavior changes. If you only check whether the statement finished, you miss the drift that matters.
Keep the policy simple enough that operators can apply it under pressure. Define which failures block use, which ones trigger review, and which ones are tolerable for a short period. That approach aligns detection, validation, and governance without turning every alert into a crisis.
What works in production
Use anomaly detection for drift, timeliness checks for arrivals, and validation for business rules. Keep those checks in-database when possible, because copying data elsewhere just to inspect it adds cost and risk. If the warehouse can test behavior where the data already lives, diagnosis is faster and the alert stream is easier to trust.
For query performance, keep plan review and baseline comparison in the same loop. If the plan changes, inspect it. If row estimates drift, compare them with actuals. If runtime is still within budget but the output shape is off, treat that as a data issue, not a successful run.
For teams comparing approaches, database performance tuning for query reliability is a practical companion because it connects query behavior to workload stability instead of isolated fixes.
If you need to monitor query behavior, catch drift early, and validate outputs without moving sensitive data, visit digna. It runs checks inside your warehouse, so you validate grain, timeliness, and drift without moving a single record.


