Pipeline Orchestration: A Practical Guide to Reliable Data
|
6
min read

You can have a warehouse full of data, a scheduler that never misses a cron, and still wake up to a stale executive dashboard. The file landed late. One upstream job half-failed. Nobody noticed until someone asked why last night's numbers didn't match this morning's reality. That gap between “the job ran” and “the output is trustworthy” is where pipeline orchestration starts to matter.
Only after an incident do many teams recognize that gap. By then, the problem has grown beyond a missed run, because downstream reports, models, and alerts have been built on incomplete or late data. Orchestration coordinates the steps, dependencies, retries, and monitoring that keep a pipeline coherent when the stack is distributed and failure is partial, not total, which is why it became central as data workflows spread across cloud and analytics systems (Atlan on pipeline orchestration patterns).
Table of Contents
The 3am Pipeline Problem You Already Know
A dashboard goes stale, and the first reaction is usually to blame the warehouse, the BI layer, or the analyst who noticed it. The core problem is often more mundane: an upstream load arrived late, a file was missing, or a partition never backfilled. If nothing in the stack is watching for that condition, the pipeline can look healthy while producing incomplete output.
That's the reason people search for pipeline orchestration after an incident. The orchestrator sits between raw jobs and trusted outputs, and it decides what runs, what waits, what retries, and what stops when something upstream breaks. In production systems, that control layer preserves lifecycle state across distributed steps, manages retries and backfills, and blocks downstream transforms when the prerequisite data is not ready (DataOps School on pipeline orchestration).
Practical rule: if a downstream consumer can't tell the difference between “late,” “missing,” and “failed,” your control plane is too thin.
This is also where a lot of teams overestimate what their current scheduler gives them. A timer that launches a job isn't the same thing as a system that enforces dependencies, handles partial failure, and records execution history in a way operators can act on. The right mental model is simple, orchestration is the coordination layer, not the transformation layer, and that distinction matters when the stack is under stress.
Defining Pipeline Orchestration
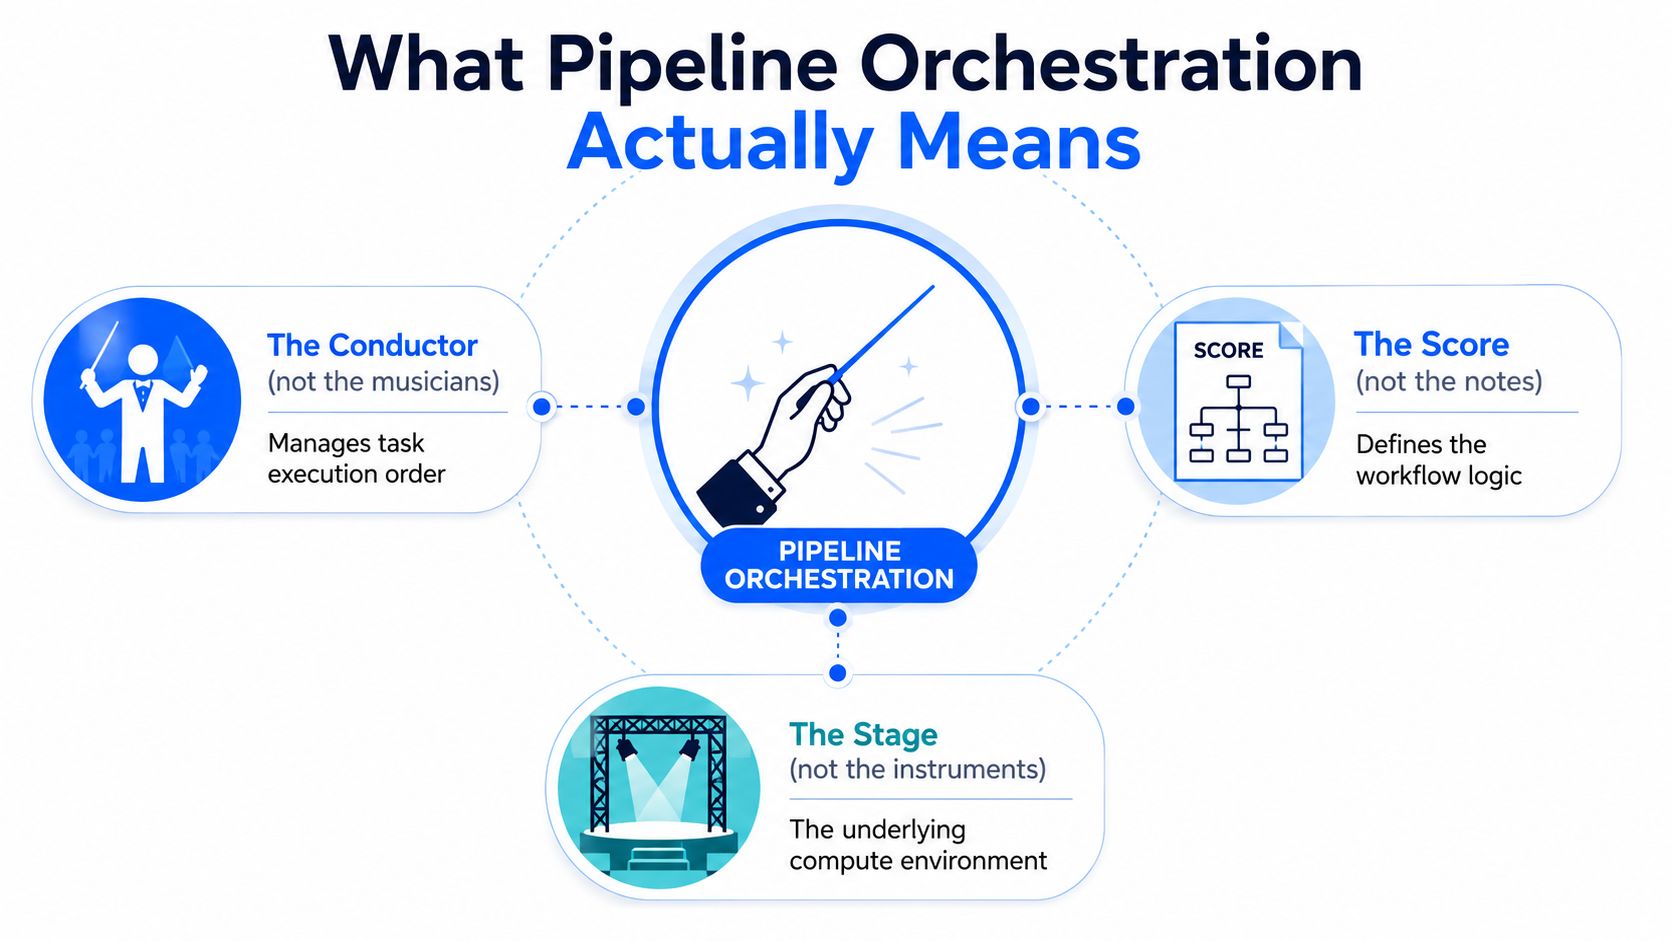
A pipeline can move data and still fail the business. A file lands late, a partition is skipped, or a downstream model starts before the upstream load has finished, and the dashboard still looks normal until someone trusts it. Orchestration is the control layer that decides which step runs, which step waits, and which step stops when the upstream condition is not right.
The practical definition of pipeline orchestration is the layer that decides when, in what order, and under what conditions each step in a data pipeline runs, while enforcing dependencies, handling failures, and monitoring execution across connected systems (Beta Systems on data pipeline orchestration). It sits above execution engines like Spark, dbt, or warehouse-native jobs, and below the business logic that depends on trustworthy data.
A useful way to separate the pieces is this. Orchestration coordinates work, while observability tells operators whether the work produced data they can trust. In private-cloud and on-prem environments, that split matters even more because vendor-managed data access is often limited, so the platform has to surface health from logs, task state, freshness checks, row-count checks, and other signals you can collect inside your own boundary. If those signals are not designed together, the orchestrator may know a job finished, while the team still cannot tell whether the output is safe to use.
What It Does And What It Does Not
The core jobs are straightforward. It schedules work, waits for upstream dependencies, retries failed tasks, backfills historical ranges, and reacts to external events like a file arriving or a message landing on a queue. Those are coordination problems, not transformation problems.
The separation matters in production because teams often try to make one tool do everything. The result is brittle DAGs, oversized jobs, and failures that take too long to diagnose. A better design keeps orchestration focused on control flow, lets compute engines handle transformation, and gives the observability layer a clear job, identify whether the data is fresh, complete, and consistent before downstream consumers act on it.
Orchestration answers the question, “should this step run now?” It does not answer, “is the data good enough to trust?”
The Core Components of an Orchestrator
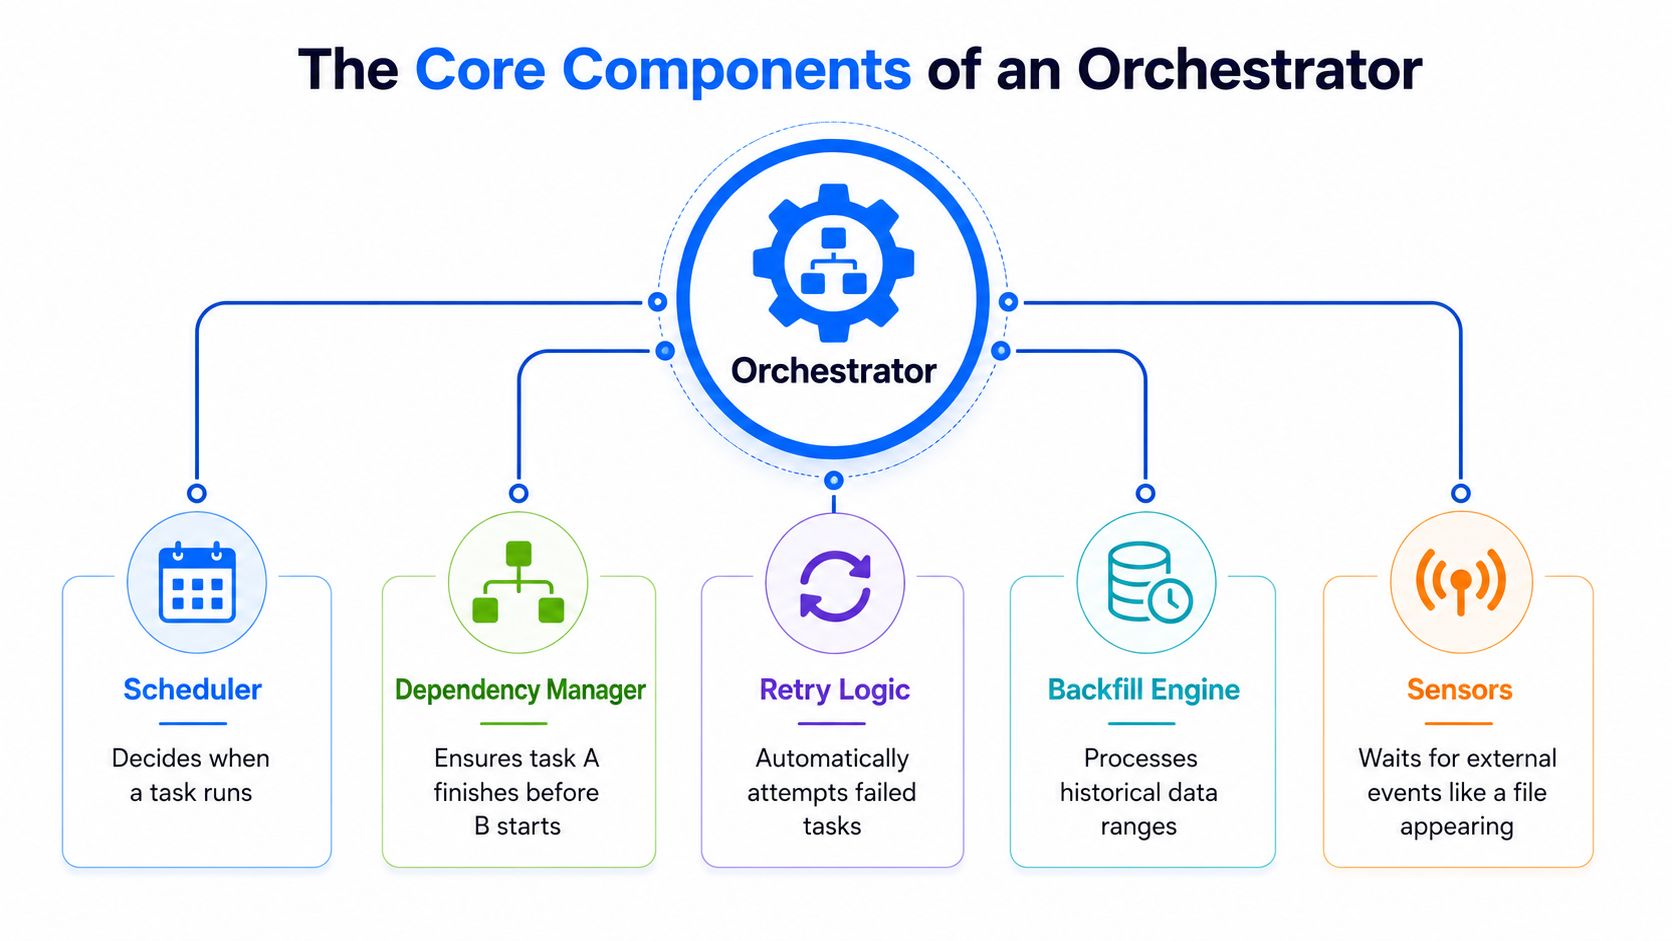
A pipeline can be full of jobs and still fail at the point that matters, production. What separates a calendar from an orchestrator is state, dependency awareness, and failure handling. In practice, that means the control plane has to know what ran, what is blocked, what can be retried safely, and what should wait for a late upstream partition before it poisons downstream output.
That design choice matters even more in private-cloud and on-prem environments, where you cannot rely on vendor-managed data access to explain what happened after the fact. Teams need signals they can collect inside their own boundary, so orchestration and observability have to be designed together. If the orchestrator only knows that a task finished, but the platform cannot confirm freshness, completeness, or consistency, operators still end up guessing at 3am.
Scheduling and Dependency Management
Scheduling decides when a task becomes eligible to run. Dependency management decides whether it is allowed to run at all. In a warehouse pipeline, raw ingestion should finish before transformation starts, and transformation should finish before a publish step writes to the reporting schema. That sounds simple until a late partition shows up in the middle of a release window.
The control value here is causal. If an upstream extraction fails, downstream work can be blocked or rescheduled instead of producing a partial table that looks valid at first glance. That is the difference between a control system and a pile of independent jobs.
Retries, Backfills, and Sensors
Retries are for transient failure, not for hiding design flaws. A controlled retry can save a run when a dependency flakes once. If the same step fails every night, the problem is in the pipeline design or the source system, not the retry policy.
Backfills handle historical correction without rerunning the entire graph. That matters when late-arriving data affects a bounded date range, because the cleanest fix is usually to recompute only the affected partitions.
Sensors close the gap between time-based and event-driven orchestration. They can wait for a file, an object, or another external signal before triggering downstream work. In a mixed estate, that matters because batch, micro-batch, and near-real-time feeds rarely share the same latency tolerance.
A modern orchestrator should support both time-based triggers and event-driven triggers, because estates that mix warehouse loads, streaming inputs, and file arrivals need both coordination styles, and teams comparing control-plane choices still end up weighing dbt vs Airflow in that decision path (DataOps School on pipeline orchestration).
Common Orchestration Patterns and Architectures
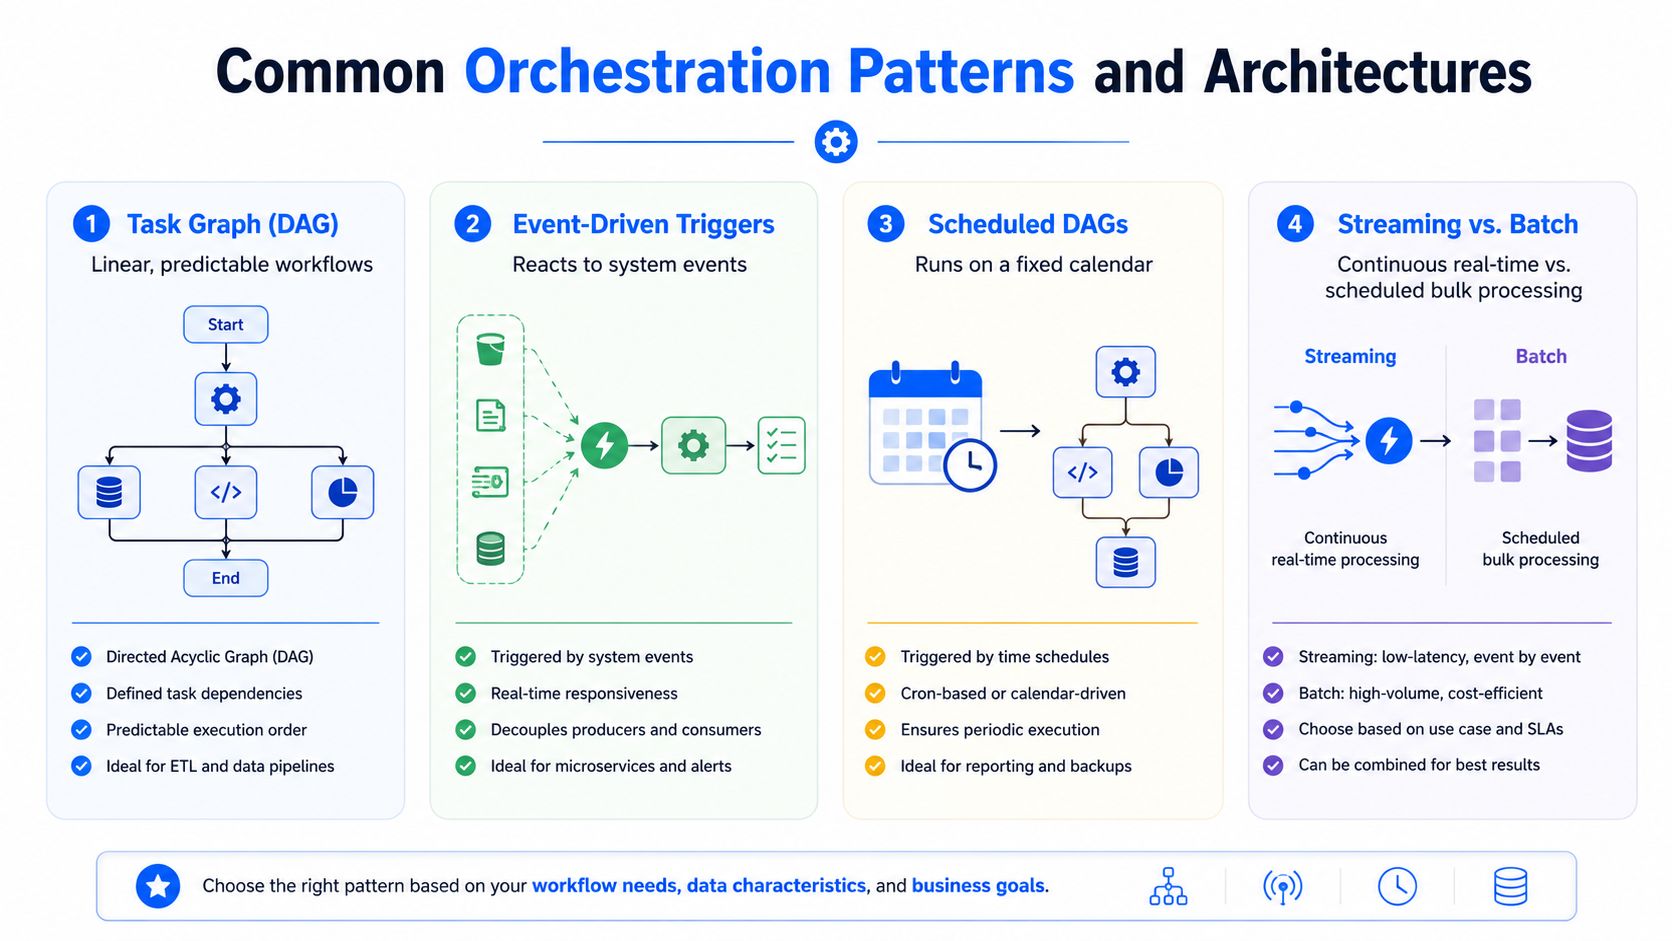
Different pipeline shapes need different orchestration patterns. A tightly coupled ETL chain wants predictable ordering. A system that reacts to file arrivals or queue messages wants event-driven triggers. A platform that mixes warehouse jobs and streaming feeds needs both, sometimes in the same environment.
Task Graphs and DAG-Based Scheduling
Task graphs work best when the workflow is explicit and the order matters. That's why DAGs became the default mental model for many data engineers, they make dependencies visible and make failure easier to reason about. Apache Airflow pushed that pattern into the mainstream, and most mature orchestration stacks still borrow the same graph logic even when the implementation is different.
The practical advantage is traceability. When a node fails, operators can see exactly which downstream tasks were blocked and why.
Event-Driven, Streaming, and Batch
Event-driven orchestration shines when the system should react to arrivals instead of a clock. A file lands, a message appears, a webhook fires, and the pipeline responds. That pattern is common in private-cloud and on-prem setups too, because the triggering event often happens inside the customer boundary, not in a vendor-managed control plane.
Streaming changes the design pressure. Batch can tolerate latency in exchange for simplicity, while streaming cares about continuous movement and tighter operational feedback. Most real estates blend the two, which is why the orchestrator needs to support time-based and event-driven behavior side by side.
If you're comparing workflow control for transformation-heavy systems, the trade-off between dbt-style modeling and orchestration-first control is worth mapping carefully, and this internal guide is useful: digna's dbt vs Airflow comparison.
Operational Concerns That Decide Whether It Works
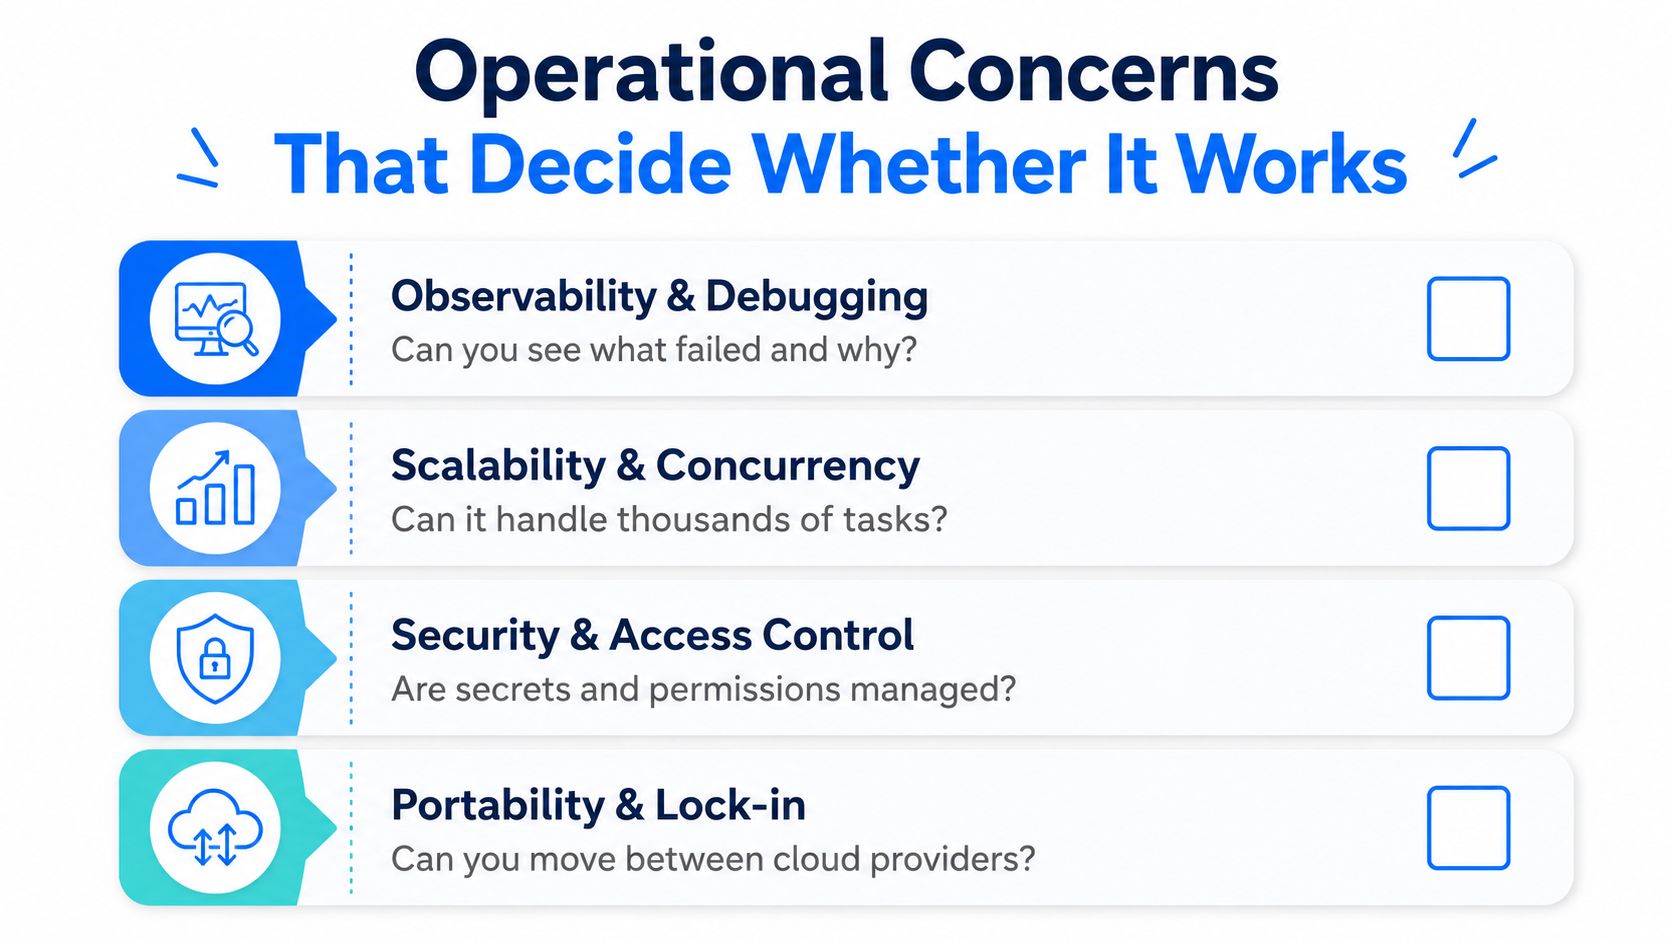
A tool can launch jobs and still fail as a platform. The difference shows up in four places, scalability, observability, security, and multi-tenancy. In private-cloud and on-prem environments, each of those has sharper edges because you can't fall back on a vendor-managed control plane when something goes wrong.
Scalability and Observability
Scalability is about how the orchestrator behaves when the graph gets big, noisy, or bursty. Some systems manage a handful of curated jobs well and then struggle when teams add dozens of pipelines, sensors, and backfills. The answer is usually not “more retries,” it's better control over concurrency, state, and task isolation.
Observability is where many orchestration stacks get over-trusted. The orchestrator can show execution history, logs, SLA status, and alerts in one place, but that still doesn't tell you whether the data was correct. The section below on observability matters because orchestration and data trust are related, not identical.
Security and Multi-Tenant Deployment
Security has to fit the network and identity model you already run. In on-prem and private-cloud deployments, that means service accounts, secrets, and access policies need to live inside existing boundaries, not in a separate SaaS control plane that sees production data by default.
Multi-tenancy becomes a real design concern once multiple teams share the same orchestration layer. Schedules, credentials, and operational visibility need clear isolation, otherwise one team's backfill becomes another team's incident. In practice, the safest architecture is the one that keeps blast radius small and production data resident where policy requires it.
If you're building the observability side of that control plane, this internal reference maps the problem space well: digna data observability.
Why Orchestration Alone Is Not Enough
Orchestration can tell you that a load finished. It cannot tell you whether the load finished with bad data. That's the gap most pipeline guides leave open, and it's why a reliable platform needs a second layer for quality and observability.
Timeliness is the first blind spot. A pipeline can execute successfully and still arrive too late for the dashboard, model, or report it feeds. Schema changes are another blind spot, because a column type shift or a missing field can pass through a healthy DAG and only fail later in consumption. Anomaly detection and validation catch different classes of brokenness, distribution shifts in key metrics, and record-level rule violations, both of which can be invisible to orchestration alone.
The practical integration pattern is simple. The orchestrator emits run metadata and contract signals, then a data observability layer consumes those signals and checks arrival, structure, and quality before downstream users see the result. That separation is especially important in private-cloud and on-prem deployments, where analyses need to happen inside the customer environment and the vendor doesn't get direct access to production datasets.
Practical rule: let orchestration decide whether the pipeline ran, and let observability decide whether the data deserves to be published.
This is also where teams avoid false confidence. A green DAG is not the same thing as a trustworthy dataset. If the source table is late, if the schema drifted, or if a record violates a business rule, the right response is to stop promotion or quarantine the output, not to congratulate the scheduler for finishing on time.
Enterprise Architecture Examples You Can Adapt
A useful architecture starts with where data lives, not with the tool you want to use. In cloud-native estates, the orchestrator often triggers transformations, emits metadata, and hands results to an observability layer that watches freshness, schema, and anomalies. In regulated environments, the same pattern usually has to run inside customer-controlled infrastructure.
Cloud-Native Lakehouse
In a lakehouse stack, source systems land data in object storage or a warehouse staging area. The orchestrator coordinates the transformation step, then emits metadata about the run, the inputs, and the output table or partition. That metadata is what observability tools use to track freshness and lineage.
The important design habit is not to treat the orchestrator as the only source of truth. It should produce signals that downstream monitoring can read, while the quality layer independently validates the result.
Private-Cloud and On-Prem
On-prem architectures need the same control flow, but the boundary is tighter. The orchestrator and the observability platform have to run inside customer-controlled environments, and production data should stay resident there. That is the reason platforms like digna are built to execute analyses inside the customer database, so timeliness, schema changes, anomalies, and record-level validation stay inside the boundary.
The pattern also applies to ML pipelines. Feature generation, training orchestration, model registry promotion, and deployment all need controlled handoffs. If the handoff is untrusted, the model inherits the same fragility the warehouse did.
A good enterprise design makes the handoff explicit. A weak one assumes that a successful job means the next layer can safely consume the result.
KPIs, Runbook Practices, and What Good Looks Like
A reliable orchestration setup should be measured, not admired. The KPIs that matter most are freshness, success rate, retry rate, mean time to detect, and SLA breach count. Freshness usually reflects observability and timeliness. Success rate and retry rate reflect pipeline stability. Mean time to detect and SLA breaches show whether operators can see problems early enough to act.
KPI | What it measures | Operational concern | Where to look |
|---|---|---|---|
Freshness | How current the data is | Observability | Arrival checks, delivery windows |
Success rate | How often runs complete cleanly | Scalability | Orchestrator run history |
Retry rate | How often tasks need another attempt | Reliability | Task logs and failure patterns |
Mean time to detect | How quickly you notice a problem | Observability | Alerts and anomaly dashboards |
SLA breach count | How often delivery misses the agreed window | Timeliness | SLA status and run reports |
Before a backfill, verify the affected date range, upstream dependencies, and whether downstream consumers need a coordinated pause. After a failure, check the first failed task, the upstream data shape, and whether the issue is transient or structural. If a schema change is about to land, roll it forward with contract checks and validation in place, not after the dashboard breaks.
The teams that stay out of trouble do a few things consistently. They keep orchestration and observability separate. They limit blast radius in on-prem and private-cloud deployments. They make retries deliberate, not automatic. They also keep production data inside the environment where policy says it belongs.
If your pipelines still rely on fragile handoffs, missing alerts, or a scheduler that can't explain what broke, digna fits naturally into that gap. It runs inside customer-controlled environments, watches timeliness, schema changes, anomalies, and validation together, and gives teams a way to confirm that an orchestrated pipeline produced trustworthy data. Visit digna if you want to compare that model against the stack you're running today.


