Database Performance Tuning: Master Your System
|
8
min read
Your dashboard didn't fail all at once. It got a little slower each week. A finance report that used to load instantly now stalls during peak hours. A BI refresh starts missing its window. An ML feature pipeline still runs, but the data profile behind it has shifted just enough that query plans no longer behave the way they did when you last tuned the system.
That's where a lot of teams are right now. They're treating database performance tuning as a slow-query exercise when the actual problem is drift. Not just workload drift, but data drift. Row counts change, distributions skew, a nullable field starts arriving with new patterns, a schema update lands unnoticed, and the baseline you trusted stops describing reality.
Traditional tuning still matters. You still need execution plans, index reviews, memory settings, and disciplined rollback. But static tuning is incomplete in systems where data shape changes every day.
Table of Contents
Beyond Slow Queries The Real Source of Performance Issues
Most performance incidents don't begin with a single obviously broken query. They begin with a system that becomes less predictable. A dashboard is fast in the morning and erratic by noon. A warehouse job that fit comfortably inside its batch window starts colliding with other workloads. Nobody changed the SQL yesterday, yet users still feel the degradation.
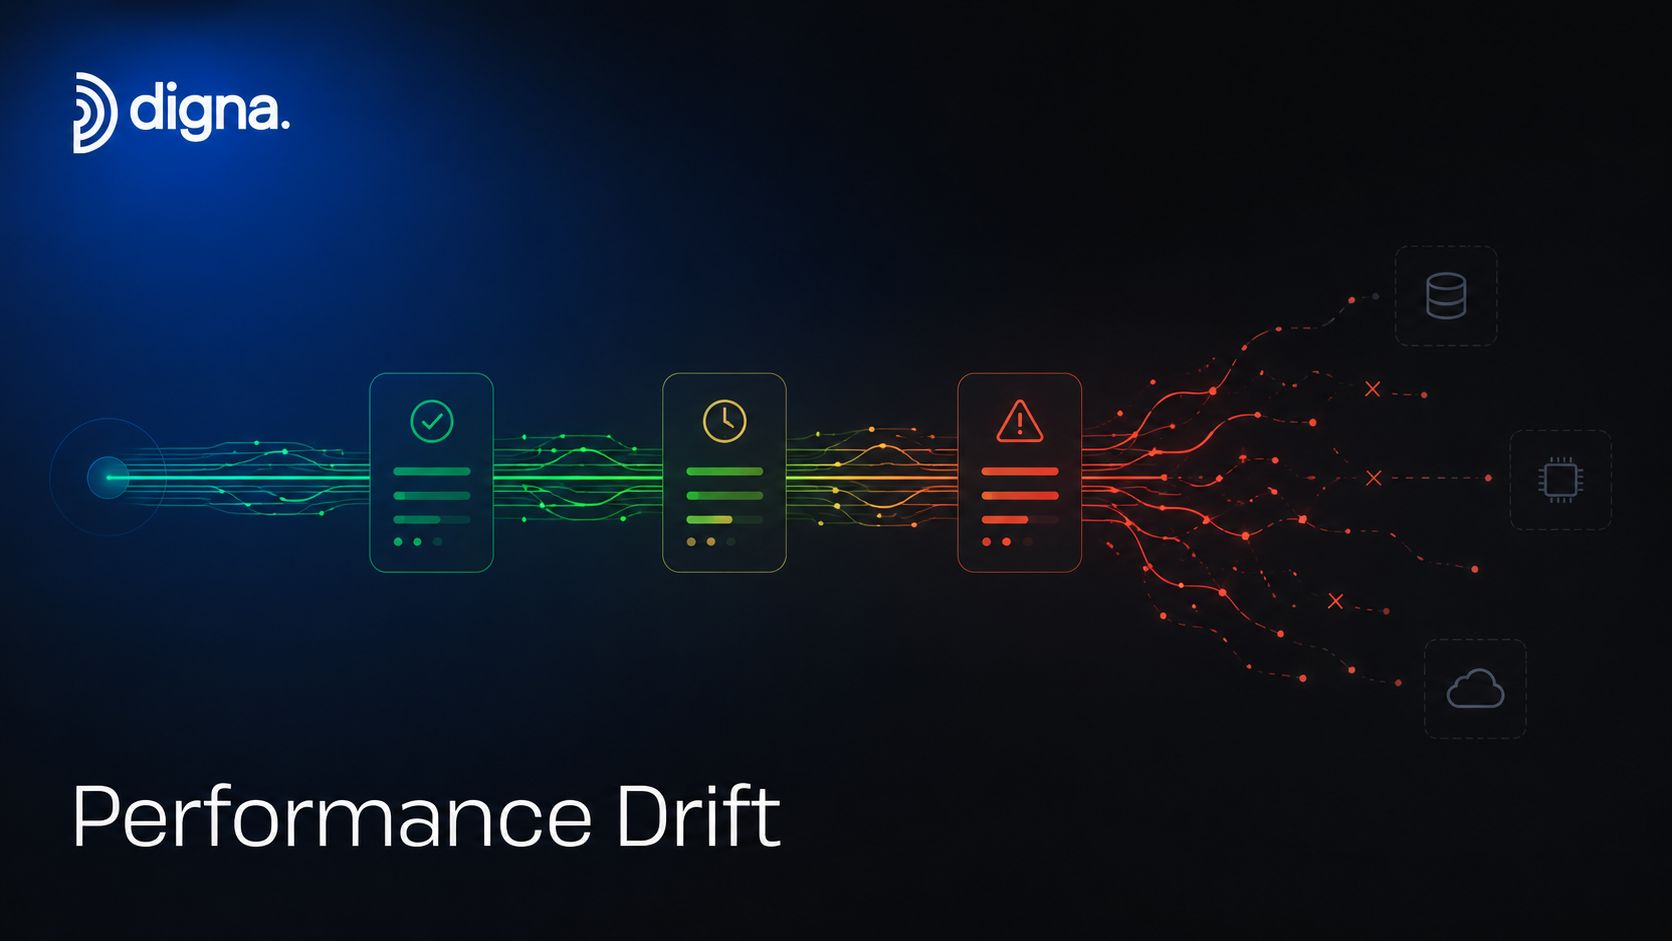
The old playbook says to find the slowest query and tune it. That still has value, but it misses a growing class of issues where the SQL is only the symptom. Recent analysis shows that 68% of database performance degradation in 2024–2025 stems not from query inefficiency but from upstream data quality issues that alter access patterns unexpectedly, yet only 12% of tuning content links observability metrics to performance tuning according to Last9's analysis of database performance tuning.
Why stable systems become unstable
A query can be perfectly reasonable for last month's data shape and a poor fit for today's. PostgreSQL is a good example. A table can accumulate churn, autovacuum falls behind, bloat grows, and what looked like a modest scan turns into ugly I/O behavior. SQL Server teams see similar drift around tempdb contention and plan selection under changing workload patterns. Teradata environments can look healthy at the system level while one workload class subtly shifts enough to distort queueing and response time.
Static tuning assumes the data stays similar. Production systems rarely honor that assumption.
This is why database performance tuning needs a broader lens. You're not only managing query text and engine settings. You're managing the conditions those queries run against.
A practical way to think about it is this:
Slow SQL often means poor access paths, bad joins, stale statistics, or excessive reads.
Performance drift often means the workload changed because the data changed.
Business impact shows up first in stale reports, delayed dashboards, and less reliable model outputs.
Teams that work on full-stack performance for developers already understand that latency is usually cross-layer. Database work is no different. If an upstream load introduces duplicate records, shifts cardinality, or changes the arrival pattern of fresh data, your query plan can degrade even when the application code is untouched.
The hidden break in most tuning workflows
Traditional baselines are often snapshots. They capture a good period, maybe a bad period, then compare the two. That's useful, but it doesn't tell you when the baseline itself is no longer trustworthy because schema, volume, freshness, or distribution have drifted.
That gap is where many recurring incidents live. The database didn't suddenly get worse. The environment around it changed, and the team kept tuning against an outdated picture.
Establish a Baseline How to Measure and Diagnose Problems
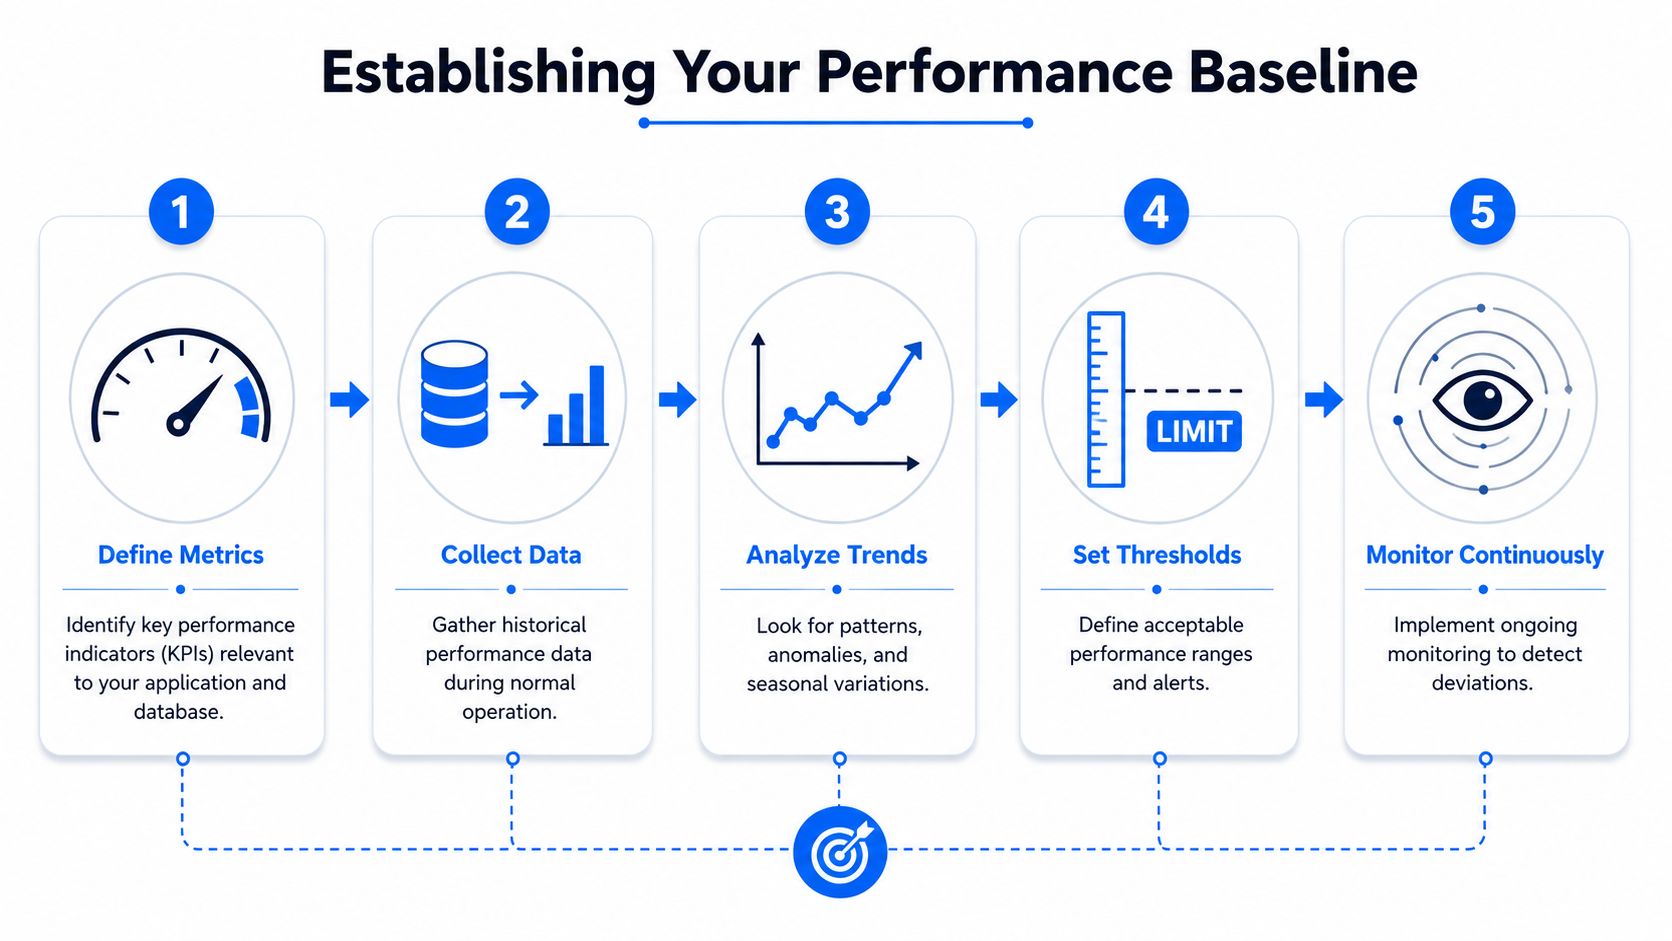
Database performance tuning starts with evidence. If you can't describe the system's normal state, you can't tell whether a change improved anything or moved pain somewhere else.
The core workflow hasn't changed because it works. The "measure, analyze, optimize, validate" lifecycle is the universal standard, requiring capture of latency, throughput, and resource utilization before any optimization to ensure changes are validated against a baseline, as outlined in this overview of the performance tuning lifecycle.
Measure first, then touch the system
Good teams get impatient here. That's understandable. Users are waiting, and there's pressure to “just add an index” or “give it more memory.” Resist that urge until you've captured a baseline from both healthy and unhealthy periods.
Oracle's tuning guidance is still useful on this point because it insists on gathering full operating system, database, and application statistics during both good and bad states. That discipline matters. Missing statistics aren't a paperwork problem. They turn root-cause analysis into guesswork.
Practical rule: If you didn't record the before-state, you can't prove the after-state is better.
Baseline collection should include the operating envelope of the workload, not only a single slow statement. That means measuring what the system is doing by module, time window, and resource type.
For teams building a tighter monitoring practice, these database monitoring and auditing techniques are worth reviewing alongside engine-native tools.
What to capture in the baseline
The exact tooling differs by platform, but the categories are consistent. Query Store in SQL Server and Azure SQL, pg_stat_statements in PostgreSQL, Oracle performance views, and Teradata system tables all help expose the same classes of evidence.
Signal | What to look for | What it usually points to |
|---|---|---|
Latency | Rising tail latency and unstable response times | Plan changes, I/O pressure, blocking, cache misses |
Throughput | Lower completed work per module or job window | Contention, queueing, write amplification |
CPU and memory | Saturation, sudden shifts, poor cache behavior | Bad plans, oversubscription, undersized caches |
I/O and waits | Read spikes, spills, storage pressure, wait events | Missing indexes, sort pressure, bloat, temp work |
Errors and retries | Timeouts, connection churn, failed refreshes | Resource exhaustion, pool mis-sizing, lock chains |
Capture these metrics under reproducible load when possible. If you only sample during an outage, you won't know whether the issue is exceptional or part of a trend.
A solid baseline usually answers four operational questions:
What was slow. Not one anecdote, but the affected query classes, jobs, and user paths.
Where the pressure was. CPU, memory, storage, temp space, or concurrency.
When it changed. After deployment, after data arrival, during a reporting window, or during background maintenance.
Whether the business noticed. Dashboard delay, stale analytics, broken SLAs, or delayed model scoring.
Baselines need context, not just metrics
A narrow baseline can mislead you. Suppose a warehouse query slowed down after a schema change added a new column and downstream ETL began populating it with unexpected null patterns. The query plan might still be the immediate mechanism, but the diagnosis isn't complete until you connect the change in performance to the change in data shape.
That's why mature database performance tuning doesn't stop at “collect metrics.” It ties system metrics to workload timing, schema state, and data arrival behavior. Otherwise, your baseline is precise but incomplete.
Prioritize the Hotspots to Find the Biggest Wins
Once you've measured the system, the next trap is random tuning. Teams drown in charts, then spend a week polishing low-impact queries while the true bottleneck keeps burning CPU or saturating I/O.
The fastest way out is prioritization by impact. Not by which query looks ugly. Not by which alert fired first. By which hotspot consumes the most meaningful resources or creates the broadest user pain.
Rank by impact, not annoyance
A query that runs constantly and wastes moderate resources can matter more than a dramatic one-off report. SQL Server Query Store, Azure SQL visualizations, Oracle workload views, PostgreSQL pg_stat_statements, and Teradata workload metrics all help answer the same question: what is repeatedly expensive enough to shape system behavior?
Start with a short ranking model:
Frequency matters. A small inefficiency executed all day can dominate total load.
Breadth matters. Queries tied to shared dashboards or core APIs deserve more attention than niche admin jobs.
Resource type matters. CPU-heavy and I/O-heavy hotspots create different remediation paths.
Timing matters. A job that collides with morning reporting may be more urgent than a slower task that runs overnight.
Don't optimize the loudest query first. Optimize the one that distorts the platform most.
Execution plans are where this becomes concrete. Look for full scans on large relations, expensive joins with poor row estimates, spills to temporary storage, or repeated key lookups that inflate reads. In PostgreSQL, check whether checkpoint pressure or autovacuum lag lines up with the slowdown. In SQL Server, inspect tempdb behavior and memory grant patterns. In Teradata, examine which workload classes are queueing and whether one query family is monopolizing resources.
What a real hotspot looks like
A real hotspot usually has one of these shapes:
A reporting query that looked fine on a moderate table but now scans far more data because distribution shifted.
A frequently executed transactional statement that lost an efficient access path after statistics drifted.
A warehouse transformation whose intermediate sort volume grew until it began spilling.
A broad BI join that was acceptable before schema drift introduced duplicate or orphaned keys upstream.
Use effort-versus-impact thinking before you start changing objects. Some wins are simple. Refresh statistics, remove an obviously unused index that adds write cost, or correct a predicate that prevents index use. Others need more care because they reshape application behavior or storage design.
The point isn't to build a perfect backlog. It's to identify the few changes that will move the platform back toward stable reports, predictable batch windows, and reliable downstream consumers.
Optimize the Core with Query and Schema Tuning
After the hotspots are ranked, tune the core path first. That usually means query patterns, indexes, statistics, and only then heavier schema changes. Most systems still have a surprising amount of low-risk improvement available before anyone needs to talk about repartitioning or major redesign.
Start with low-risk changes
A disciplined workflow starts small. Refresh statistics if they're stale. Review execution plans. Add or adjust indexes only when the plan and access pattern justify them. Minor SQL rewrites, connection pool corrections, and plan validation usually belong ahead of structural redesign.
One practical mistake shows up everywhere: teams keep adding indexes without checking whether existing ones already overlap or whether the write path can afford more maintenance cost. Guidance summarized in this database performance tuning overview is directionally right here. Removing unused or redundant indexes can reduce write overhead and storage cost, while blindly adding more can push the optimizer toward poor choices or larger maintenance burdens.
A few tuning moves consistently pay off:
Clean up index sprawl. Redundant indexes increase write cost and can confuse troubleshooting.
Prefer short, purposeful indexes. Large text-like fields are usually poor index candidates because they inflate structure size and computational cost.
Check cache behavior after query changes. Buffer pools should hold the working set without consuming all system memory.
Audit regularly. Index review and configuration hygiene prevent slow decay that creeps into mature systems.
Use AI rewrites carefully
AI query rewriting is attractive because it promises quick wins. Sometimes it helps. It can suggest join simplifications, predicate cleanup, or alternative formulations that humans might miss under time pressure.
But AI has a sharp edge in production databases. A 2025 industry survey found that 44% of AI-generated query optimizations introduced subtle bugs in finance and healthcare datasets due to misinterpreted null handling or date range semantics, according to this industry survey summary on AI-driven tuning.
That result matches what experienced engineers already know. Query speed is not the same thing as query correctness.
Use AI suggestions like a junior reviewer's draft:
Check the execution plan change.
Validate record-level semantics.
Compare result sets on representative edge cases.
Watch null handling, date boundaries, and duplicate behavior closely.
Faster SQL that returns the wrong rows is a production defect, not an optimization.
This matters even more in analytics and ML systems. A subtle semantic error in a reporting query can become a stale or misleading KPI. A bad rewrite in a feature pipeline can change model inputs while making the warehouse look “faster.”
Know when schema changes are worth it
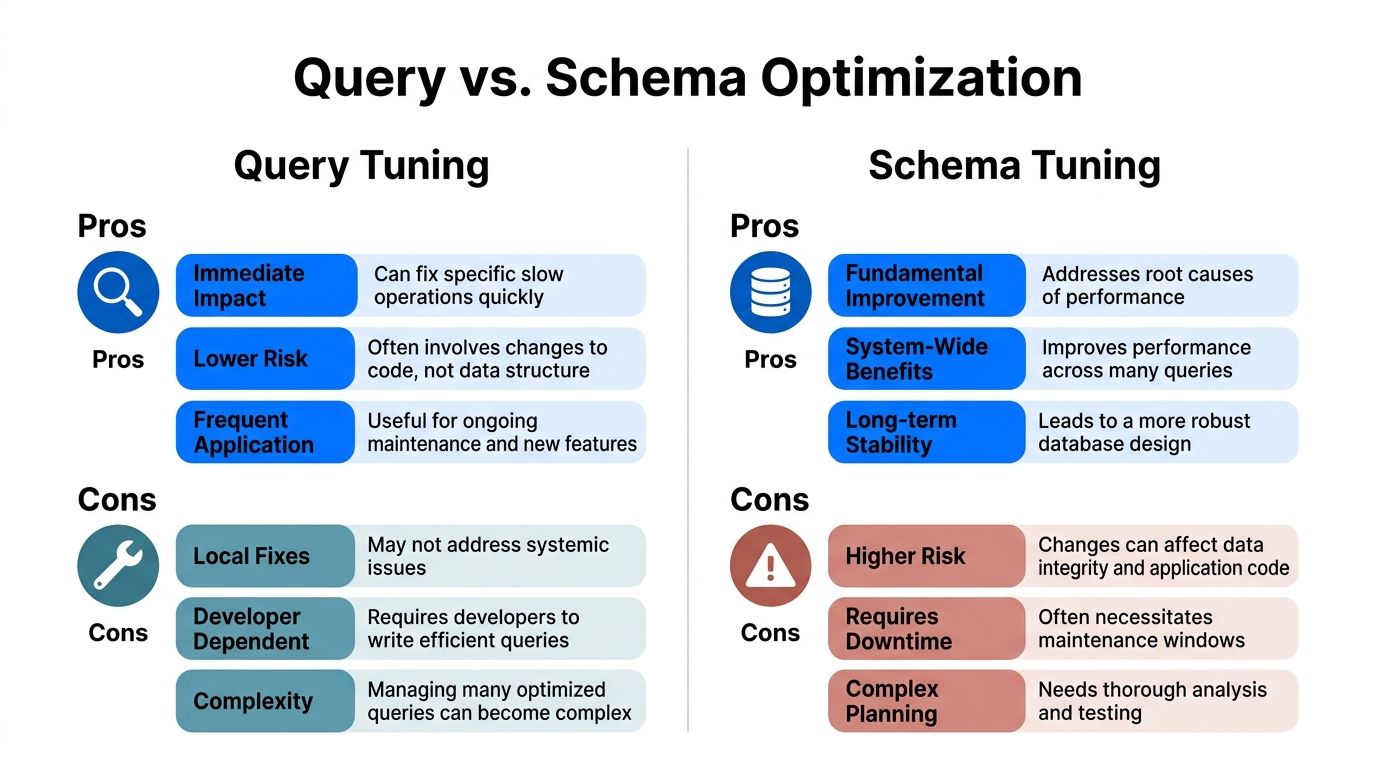
Query tuning is local. Schema tuning is systemic. That's why schema changes can produce broad benefits, but they also carry more risk.
Use schema changes when the problem is structural, not cosmetic. Examples include tables that have clearly outgrown their current layout, join paths that repeatedly depend on awkward key shapes, or workloads that need partitioning and lifecycle management rather than another round of query bandages.
A useful way to frame the choice:
Option | Best when | Main trade-off |
|---|---|---|
Query tuning | A small set of statements drives the issue | You may only fix local symptoms |
Index tuning | Access paths are wrong or incomplete | Writes get more expensive |
Schema tuning | Many queries suffer from the same design constraint | Higher change risk and more coordination |
The sequence matters. Start with the least disruptive option that can plausibly solve the problem. If the needle doesn't move, revert cleanly and move to the next layer.
That mindset keeps database performance tuning from turning into accidental redesign.
Tune the Engine with Configuration and Resource Adjustments
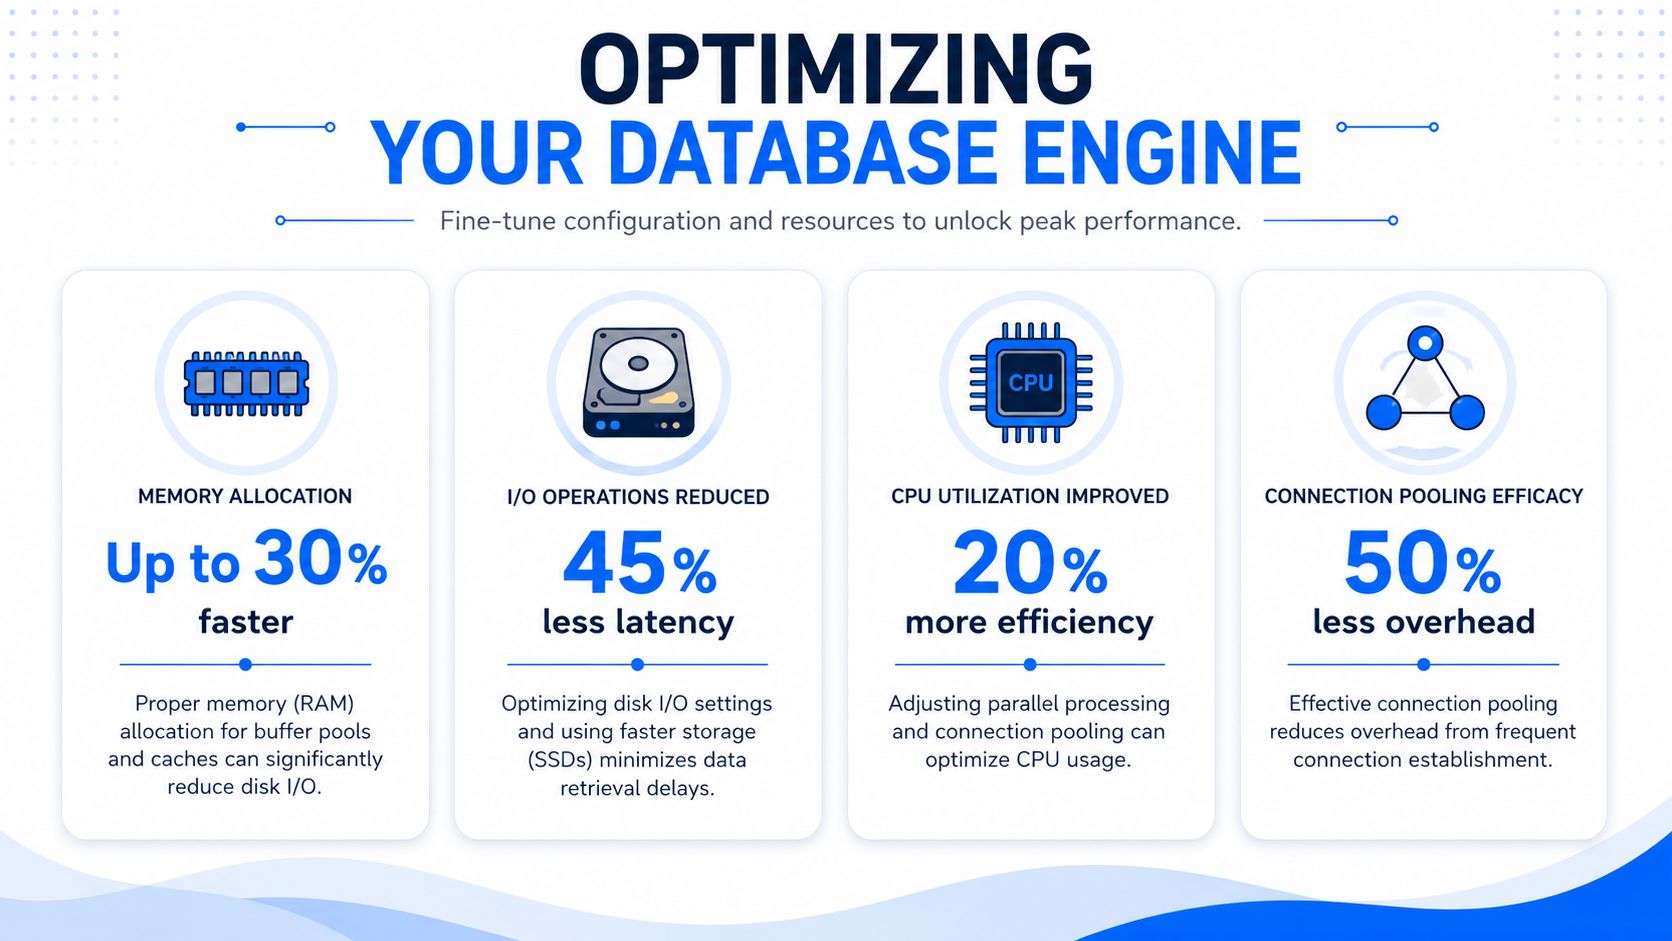
Once query and schema work are underway, shift attention to the engine itself, a phase where a lot of teams either overreach or underreach. They either twist every knob they can find, or they leave obvious resource issues untouched because they assume “it must be the SQL.”
Both are mistakes.
Treat configuration as an experiment
Configuration tuning only works when it follows a strict single-change method. Oracle's tuning methodology is explicit on this point in its guidance on a step-by-step tuning method. Change one parameter or object at a time, record before-and-after metrics, and don't claim success unless the causal link is clear.
That applies to memory settings, connection pools, parallelism, storage placement, and diagnostic tooling. It also applies to the small but common footgun of leaving production tracing or Extended Event sessions running after an investigation. Those tools can become part of the latency profile if no one cleans them up.
A useful order of operations looks like this:
Memory first. Check whether the buffer pool or shared buffers can hold the working set without starving the rest of the host.
Connection behavior next. Too many active sessions can create artificial contention and scheduler pressure.
I/O path after that. Look for temp spill patterns, queue depth, or poor placement of critical files.
Only then adjust deeper knobs. Parallelism, worker settings, and advanced engine behavior need stronger evidence.
Platform-specific checks that matter
The engine details differ, but some checks are too important to skip.
Oracle and OS interaction
A critical historical rule from Oracle still holds up: if operating system kernel utilization exceeds 40%, the likely cause is OS-level contention such as paging, swapping, network transfer overhead, or process thrashing rather than only SQL flaws, as documented in Oracle's performance tuning guide. When that threshold shows up, stop pretending the problem is isolated to a query.
SQL Server and tempdb
If tempdb is poorly placed or undersized for the workload, the rest of the tuning discussion gets noisy fast. Spills, versioning pressure, and concurrent scratch activity all make “slow query” symptoms worse than they appear.
PostgreSQL and maintenance behavior
Watch checkpoints and autovacuum closely. If autovacuum falls behind, table bloat can turn ordinary reads into expensive I/O. If checkpoint settings are mismatched to the write pattern, latency gets jagged.
Teradata and workload classes
On Teradata, system averages can hide pain. The useful view is workload-level behavior, queueing, and how much one class of activity is consuming during critical windows.
Engine tuning is where discipline matters most. One change, one measurement cycle, one rollback path.
Without that rigor, database performance tuning becomes superstition. You won't know whether the memory change helped, whether the pool change hurt concurrency, or whether a storage fix masked a plan problem for a week.
From Reactive Tuning to Continuous Observability
One-off tuning sessions are still necessary. They're just no longer sufficient.
The reason is simple. Your data platform keeps changing after the tuning session ends. Tables grow. Upstream jobs arrive late. Schemas drift. Record distributions move. A baseline captured during a clean period slowly stops representing production truth.

Static baselines decay
If you only revisit performance when users complain, you're always working from the back foot. By then, the issue has already propagated into stale reports, broken dashboards, delayed analytics, or unreliable AI features.
Continuous observability closes that gap. The important shift is to watch not only engine metrics but also the data conditions that invalidate performance assumptions:
Volume anomalies that reshape access patterns
Schema changes such as added columns, removed fields, or type changes
Timeliness drift when expected data arrives late or not at all
Record-level quality issues including duplicates, null anomalies, and broken relationships
AI can help here when it's applied to anomaly detection rather than blind query rewriting. AI-powered anomaly detection can reduce manual rule maintenance overhead by up to 90% when unsupervised methods learn normal behavior and set adaptive thresholds automatically, according to digna's enterprise data platform description. That matters because hand-maintained thresholds age badly in dynamic warehouses.
What continuous observability changes
The architectural piece that makes this practical is in-database analysis. In-database metric computation eliminates data movement costs by executing inspection directly within source databases, enabling real-time monitoring and baseline learning while ensuring customer data remains private in their own environment, as described in this overview of in-database workload analysis.
That model is especially useful in private cloud and on-prem environments where teams need visibility without exporting sensitive production data. It also fits the way data engineers work. If observability can run close to Teradata workload tables, PostgreSQL system stats, or warehouse-resident validation logic, you can catch drift before it becomes a user-facing incident.
A stronger operating model combines:
query and engine telemetry,
schema tracking,
freshness monitoring,
anomaly detection on data shape,
and record-level validation tied to business rules.
If you want a broader primer on that operating model, this overview of data observability in practice is a useful starting point.
Database performance tuning works best when it evolves from a rescue activity into a continuous control loop. That's how you protect not just query latency, but trust in the outputs your database serves.
If your team is trying to connect database performance with data drift, schema change, timeliness, and record-level validation in one operating model, digna is built for that. It runs analyses inside your environment, helps surface anomalies before they become stale reports or unreliable AI inputs, and gives engineers a way to keep performance baselines honest as the data changes.
To watch the data conditions that quietly invalidate a tuning baseline, such as volume shifts, schema changes and late loads, see how digna approaches data platform observability inside your own database.
Frequently asked questions
What causes database performance to degrade over time?
Often the data, not the SQL. Last9's analysis cited in the article attributes 68% of database performance degradation in 2024-2025 to upstream data quality issues that alter access patterns, such as shifting row counts, skewed distributions, new null patterns or unnoticed schema updates that make an old baseline obsolete.
What should a database performance baseline include?
A useful baseline captures latency, throughput, CPU and memory, I/O and wait events, plus errors and retries, measured during both healthy and unhealthy periods. It should answer four questions: what was slow, where the pressure was, when it changed, and whether the business noticed through delayed dashboards or missed SLAs.
How do I decide which slow queries to tune first?
Rank hotspots by impact, not by which query looks ugliest or alerted first. Weigh frequency, breadth, resource type and timing: a small inefficiency executed all day can dominate total load, and a job colliding with morning reporting may matter more than a slower overnight task. Query Store and pg_stat_statements help.
Is it safe to use AI to rewrite SQL queries?
Only with careful review. A 2025 industry survey cited in the article found that 44% of AI-generated query optimizations introduced subtle bugs in finance and healthcare datasets, mostly around null handling and date ranges. Treat suggestions like a junior's draft: check the plan, compare result sets and test edge cases.
How should database configuration changes be tested?
Change one parameter at a time, record before-and-after metrics, and keep a rollback path, following Oracle's step-by-step method. Work in order: memory first, then connection behavior, then the I/O path, and only then parallelism or worker settings. Oracle also flags OS kernel utilization above 40% as a sign of OS-level contention.


