SQL Query Optimisation: A Diagnostic Guide for 2026
|
6
min read

The query looked harmless when it landed in the morning review. It ran fine last week, then a dashboard timed out after lunch, and the common first instinct is still the same, blame the SQL text, add an index, and hope the problem disappears. That approach burns time because sql query optimisation is usually a diagnosis problem, not a guessing game, and the database already has clues if you know where to look.
Table of Contents
Beyond Guesswork Why SQL Optimisation is a Science
A slow report usually creates a false sense of urgency around the wrong layer. One engineer stares at the SQL, another wants a new index, and a third starts toggling settings because production is noisy. The better move is to treat the failure like an investigation, because the optimiser is already making decisions from data distribution, plan shape, and runtime evidence, not from vibes or habit.
Start with the database's actual decision process
Modern optimisers are not rule books with a few shortcuts bolted on. They rewrite the SQL into a logical plan, enumerate candidate plans, estimate predicate selectivity and join cardinalities, and then choose the cheapest physical strategy among alternatives such as nested loops or sort-merge joins, as shown in an overview of query rewrite and plan enumeration from the optimiser lecture material. That matters because a statement that looks simple can still be expensive if the engine misjudges row counts or chooses the wrong access path.
Practical rule: if you can't explain why the optimiser chose a plan, you're not tuning yet, you're still observing.
A useful mental shift is to stop asking, “What's wrong with this query?” and start asking, “Which estimate or assumption failed?” Microsoft's statistics documentation describes statistics as BLOB-backed metadata used to estimate cardinality, the number of rows a query will return, which then guides choices like an index seek versus an index scan when that's cheaper in SQL Server's statistics docs. InterSystems' plan-selection metadata adds the practical ingredients behind those estimates, including row count, field selectivity, average field size, outlier selectivity, and histograms in its optimiser documentation.
That's why tuning gets worse when teams trust the last good plan for too long. When data distribution changes and statistics go stale, the optimiser can start making expensive choices that looked reasonable under older assumptions. The right response is evidence, not superstition, and the shortest route to that evidence is a repeatable diagnostic workflow. I keep a resource like statistical pattern recognition nearby when I want the team to think in patterns, not anecdotes.
Reading the Signs Deconstructing the Execution Plan

The execution plan is where the database tells on itself. It shows how rows move, where filters happen, which joins are chosen, and where the engine thinks the cost sits. If you're new to reading plans, start with the operators that touch the most data, not the prettiest parts of the diagram.
Follow the rows, not the syntax
A practical loop for a slow query is simple. Capture the query with its real parameters, run EXPLAIN ANALYZE, find the bottleneck node in the execution tree, make exactly one change, refresh statistics with ANALYZE, then rerun and compare the new plan with the old one as described in the tuning workflow. That one-change rule matters because it prevents false attribution. If you rewrite the predicate and add an index in the same pass, you'll never know which change made a difference.
The quickest red flags are usually obvious once you know what to scan for. A Table Scan where you expected an Index Seek means the engine decided reading the whole structure was cheaper than using the index. A Nested Loops join over large inputs can be fine for a tiny outer result, but it becomes painful when the engine has to repeat the inner work many times. The plan is also where you catch gaps between estimated and actual rows, which often point straight at a cardinality issue rather than a SQL formatting problem.
Read the plan like a cost map
Here's the pattern I look for in practice:
Big row flow early: if the first operator returns far more rows than expected, the filter isn't selective enough or the statistics are lying.
High-cost join branch: if one join arm dominates the plan, the join order may be wrong, or the join key may not be indexed in a useful way.
Warning icons or conversions: implicit conversions and missing statistics often explain why a seemingly correct statement behaves badly.
Unnecessary scans of wide tables: wide reads are often the hidden tax when the query only needs a few columns.
Runtime tools help confirm the plan isn't lying. Microsoft-oriented tuning guidance highlights SET STATISTICS IO as a core diagnostic because it exposes scan count, logical reads, physical reads, read-ahead reads, and LOB variants so you can quantify I/O cost directly in Red Gate's SQL Server tuning guide. That same evidence-first habit shows up in PostgreSQL ecosystems through pg_stat_statements, which surfaces execution counts and time-based activity for workload ranking.
If you need a structured way to correlate query behaviour with broader system signals, database monitoring and auditing techniques are worth folding into the same review loop. A plan alone tells you what the optimiser wanted to do, but runtime metrics tell you what the engine paid for.
Finding the Culprit Common Query Anti-Patterns
Sometimes the query text is the problem, not the index. I see teams spend hours debating storage layout when the underlying issue is that the SQL itself blocks the optimiser from using the access path it wants. The fastest wins usually come from removing unnecessary work before touching schema design.
Fix the shapes that force expensive work
SELECT * is the classic beginner mistake, but it still shows up in mature codebases because it feels harmless. It isn't harmless when the query only needs a few columns, because the engine may read and move far more data than the downstream step uses. A narrower projection reduces I/O pressure and makes the next operator's job smaller.
Functions in WHERE clauses create a different kind of drag. A filter like WHERE DATE(order_date) = '2026-01-01' changes the column before comparison, which can prevent direct index use because the engine can't apply the predicate to the stored values cleanly. The fix is to write the condition so the column stays on the left in a form the index can understand.
Filtering early and reducing the amount of data that flows downstream is still one of the cleanest ways to help the optimiser do less work.
Watch the queries that hide row-by-row behaviour
Correlated subqueries can look elegant and still behave like a row-at-a-time loop when the optimiser can't flatten them well. That's not always a bug, but it often turns into repeated work that a join or pre-aggregated step could avoid. UNION can also be heavier than people expect because it has to preserve uniqueness, while UNION ALL avoids that extra deduplication cost when duplicates aren't a concern.
Tinybird's guidance on faster SQL calls out the useful order filter, join, aggregate, and it frames sequential reads as dramatically faster than random access patterns in its SQL performance rules. That's the mechanical reason a predicate-friendly shape matters. If the query can eliminate rows early, every later step gets cheaper.
A simple rewrite often makes the difference clear:
Slower shape | Better shape |
|---|---|
|
|
|
|
Correlated subquery repeated per row | Join or pre-aggregate once |
When query shape and indexing need to be evaluated together, building reliable data models becomes relevant because the same table design that supports analytics cleanly can also make filters and joins easier for the optimiser to reason about. I use that link as a reminder that SQL performance is often a modelling issue wearing a query-shaped mask.
Choosing Your Tools Indexing and Partitioning Strategies

Indexing changes how the engine finds rows, but it also changes how much work every write has to do. That trade-off is why a new index is not the default answer to a slow query. The right choice depends on read patterns, write volume, and whether the optimiser already has a plan that is close enough to efficient.
Match the access path to the question
A clustered index changes how data is physically organized, while a non-clustered index adds a separate lookup path. A covering index can be better for read-heavy queries because it holds the columns the query needs and avoids extra table lookups. That matters most when the same filtered columns are hit repeatedly by dashboards, API calls, or scheduled reports.
The cost side is easy to ignore until the table starts changing often. Every new index adds work to inserts, updates, and deletes, and that overhead shows up quickly on write-heavy tables. The real question is not whether a query can use an index, but whether that index earns its place across the full workload.
A cost model only helps when its statistics are current. Microsoft's guidance in SQL Server's statistics docs explains that the optimiser uses statistics to estimate cardinality and select access paths, and stale or missing statistics can push it toward poor choices when the data distribution shifts. Building reliable data models also matters here, because a table layout that matches the query shape gives the optimiser clearer signals and reduces the chance that a good index is ignored.
Use partitioning when the scan is the enemy
Partitioning matters when the table is so large that reading everything is the problem. Time-series tables and range-based queries are the clearest fit, because partition pruning can keep the engine from scanning data outside the active slice. In a cloud warehouse or a lakehouse-style engine, that often matters more than shaving a few milliseconds off a single join.
Platform context changes the trade-offs. In managed environments, compute and storage do not behave like a classic single-node RDBMS, so the old habit of adding indexes everywhere can waste effort or even hurt throughput. If you are deciding whether to tune SQL, table layout, or workload policy, database management best practices help frame the operational side, while the access pattern should still drive the physical design.
I also point teams to professional database management services when indexing, operational review, and recurring regressions all need attention at once. Query tuning rarely stays isolated once production traffic starts changing, and the goal is always to reduce the amount of data processed downstream, not to make one statement look clever.
When Good Queries Go Bad Statistics and Optimizer Hints
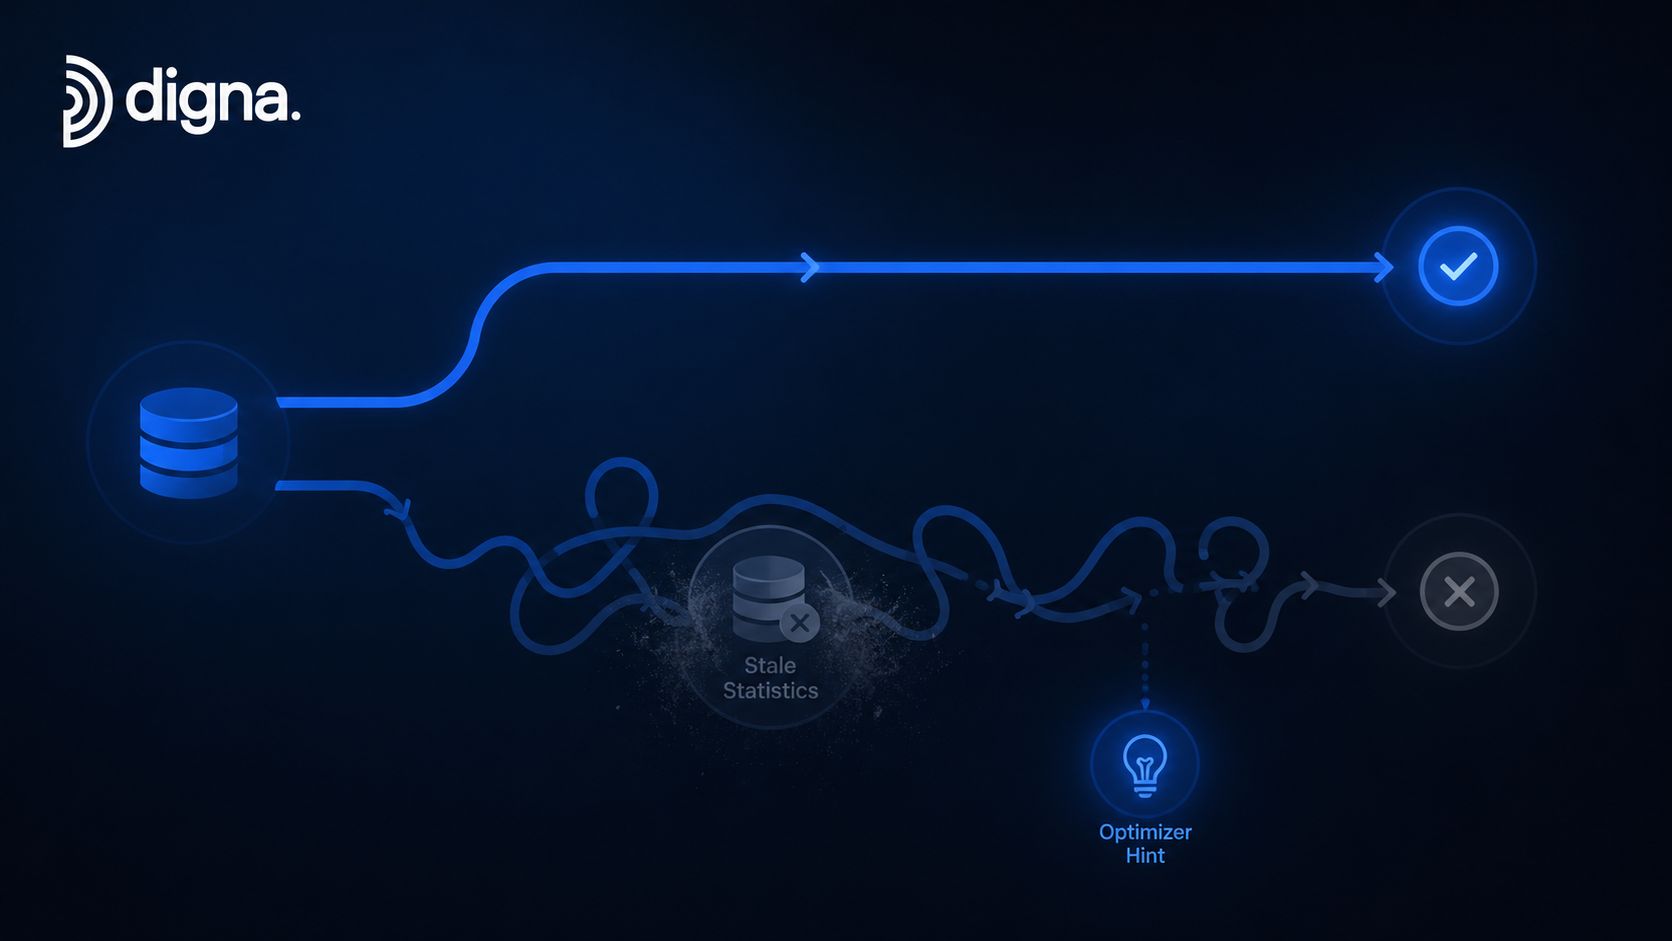
A clean query can still run badly. That's the part many teams resist, because it feels comforting to believe that tidy SQL guarantees a good plan. In reality, the optimiser only works as well as its metadata, and cardinality errors can send it down the wrong branch.
Stale statistics can sabotage a good plan
Cardinality estimation is one of the central bottlenecks in query optimisation. A survey of DBMS optimisers describes cardinality estimation, cost modelling, and plan enumeration as the three core components, and it explains that selectivity errors can cascade into bad join orders and the wrong physical operators in the survey of DBMS optimizers. That cascade is the reason a simple-looking filter can still produce a terrible runtime.
The practical fix is not mysterious. Update statistics regularly, especially after data growth, changing distributions, or bulk loads. If the optimiser has current histograms and row counts, it can estimate intermediate sizes more accurately and choose better operators. If it doesn't, you're asking it to make a cost-based decision with stale facts.
That is also why optimizer hints belong at the edge of the toolbox, not the center. A hint can force join order or access path when the optimiser is repeatedly wrong for a known workload, but it can also freeze a bad assumption into code. Use them only when you've checked the plan, confirmed the data pattern, and decided that manual control is justified.
Practical rule: hints are a correction mechanism, not a tuning strategy.
The earlier section's workflow still applies here. Change one thing, refresh statistics, rerun, and compare. If the bad plan goes away after ANALYZE, the issue was metadata freshness, not query shape. If it doesn't, you've learned something useful about the engine's decision boundary, and that's better than an index blind guess.
From Firefighting to Prevention A Continuous Optimisation Workflow

The teams that stop chasing the same slow query usually build feedback into the platform. They do not wait for a dashboard to fail before checking whether a workload has drifted. They watch the expensive statements, compare runtime over time, and treat regressions as something to catch early rather than recover from late.
Make runtime evidence part of the routine
Modern tuning depends on what the engine did, not what the plan promised. SQL Server's SET STATISTICS IO exposes logical reads, physical reads, scan count, and related I/O details. In PostgreSQL, pg_stat_statements surfaces execution counts and timing signals that help rank expensive workloads. For a broader view of how this fits into ongoing database operations, the discussion in professional database management services is useful because the same discipline applies whether the bottleneck is one query or a wider workload shift. That evidence is the difference between “this feels slow” and “this statement is consuming the most resources.”
A practical operating model looks like this:
Watch the top offenders regularly: review the most expensive queries instead of waiting for user complaints.
Compare against prior behaviour: if a statement that was stable starts drifting, treat that as a regression signal.
Check the layer before changing code: ask whether the issue is SQL shape, statistics freshness, memory pressure, or plan reuse.
Keep changes small: one rewrite, one index decision, or one stats refresh per round makes the result interpretable.
In this context, observability platforms earn their keep. A system like digna can sit in the same operational conversation as workload tracking and quality monitoring, because query regressions often show up as platform symptoms long before someone files a ticket. If the team already uses a wider data operations process, digna's monitoring approach fits naturally alongside query-level review, and it is easier to keep tuning disciplined when the signals are all in one place.
The point is not to turn every engineer into a query archaeologist. The point is to make slow queries visible, explainable, and repeatable to fix. Once the platform surfaces the right evidence, SQL query optimisation stops being a scramble and becomes part of ordinary data engineering practice.
If your team is still chasing slow queries by instinct, visit digna and look at how in-database monitoring can surface workload drift before users feel it. The same evidence-driven approach that helps with query tuning also helps teams keep performance, reliability, and operational visibility in one place.
Frequently asked questions
What question should replace "what's wrong with this query?"
"Which estimate or assumption failed?" Modern optimisers are not rule books with shortcuts bolted on, so tuning starts by finding the estimate that led the optimiser somewhere unhelpful.
When are you actually tuning rather than observing?
When you can explain why the optimiser chose a plan. Until then you are watching a slow query rather than diagnosing one, and any change is a guess about a decision you have not understood.
What role do statistics play?
They drive the plan. Microsoft's documentation describes statistics as BLOB-backed metadata used to estimate cardinality, the number of rows a query will return, which then guides choices such as an index seek versus an index scan when the scan is cheaper.
Why does tuning get worse over time?
Because teams trust the last good plan for too long. Data volume and distribution move underneath a plan that was correct when it was chosen, and the assumption that made it fast quietly stops holding.
Why does a slow report create urgency around the wrong layer?
Because the symptom appears where users are. The report is the visible surface, so attention lands there, while the failed estimate that produced the plan sits several layers below it.


