Data Governance Maturity Model: Levels, Assessment, Roadmap
|
7
min. czyt.
Most advice about the data governance maturity model starts in the wrong place. It tells executives to choose a framework, publish policies, form a council, and buy a catalog. That sequence creates paperwork, not maturity.
Most enterprises rate themselves at Level 3 or Level 4 because they have policies, dashboards, and named committees. Evidence often places them at Level 1 or Level 2. A policy nobody enforces, a dashboard nobody reviews, and a steward who can't make a decision are signs of intent, not capability.
A useful maturity model must answer a harder question: what does the organization do when data breaks, changes, becomes sensitive, or feeds an AI system? The answer should be visible in ownership records, quality controls, lineage, access decisions, issue-resolution workflows, and leadership reporting. This article treats maturity as an operational scoring system, not a framework tour.
Table of Contents
Why Most Enterprises Overestimate Their Governance Maturity
The most common governance mistake is confusing documentation with control. An enterprise can have a data policy, a glossary, a steering committee, and a catalog subscription while still relying on individual heroics to identify and fix data problems. That organization may look mature in a presentation, but its operating behavior remains reactive.
The historical development of staged governance models explains why this confusion persists. The IBM Data Governance Council, a forum of nearly 55 organizations formed in November 2004, helped establish the enterprise governance conversation. IBM published its maturity model in October 2007, and Gartner introduced its enterprise information management maturity model in December 2008. The timeline is documented in this history of the data governance maturity model. These models gave executives a language for progress, but many organizations adopted the labels without adopting the evidence behind them.
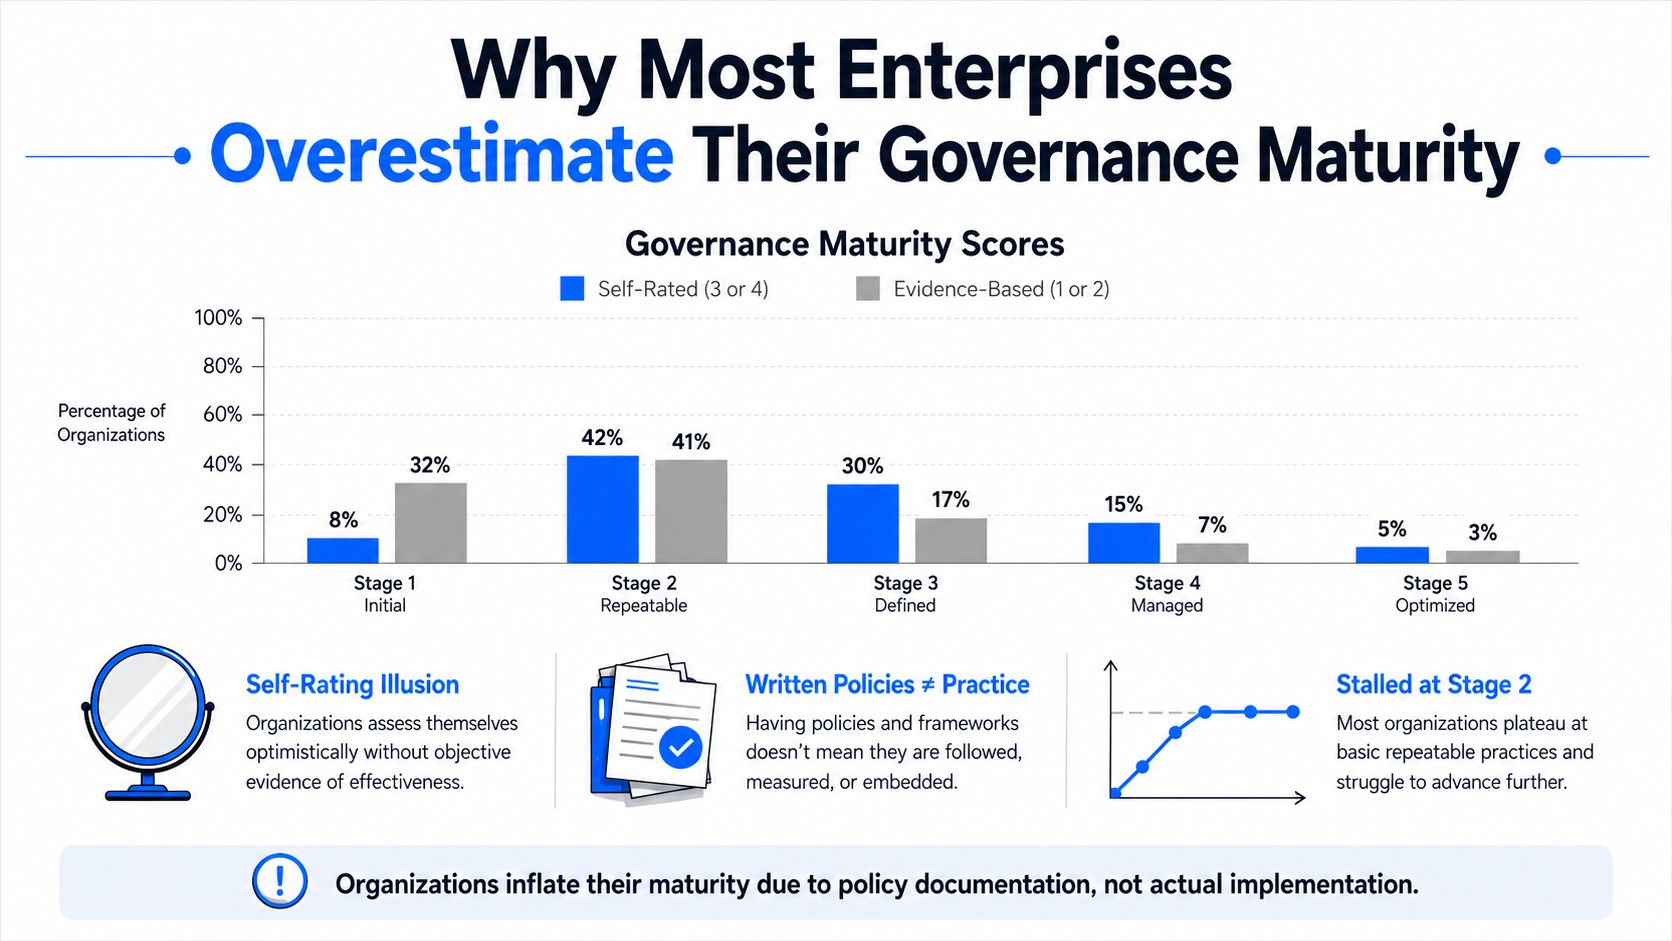
The self-rating illusion
A self-assessment usually asks whether a process exists. An evidence-based review asks whether people use it consistently, whether controls operate without manual intervention, and whether leaders act on the resulting signals.
Look for these warning signs:
Policies without enforcement: Standards exist, but pipelines can publish data that violates them without a blocking control or accountable exception.
Dashboards without decisions: Teams produce quality reports, yet no executive reviews trends or funds remediation.
Committees without authority: A quarterly stewardship group discusses definitions but can't assign work, resolve conflicts, or approve exceptions.
Catalogs without adoption: Technical metadata is loaded, but business users still ask colleagues where data comes from and whether they can trust it.
Practical rule: Score behavior that a reviewer can verify, not capability that a program owner can describe.
The correct starting point is therefore diagnostic. Review a representative set of critical data assets, trace incidents from detection to closure, inspect access decisions, and ask owners to demonstrate how definitions and quality thresholds enter daily delivery work. If the evidence stops at a policy document, score the control as immature.
What a Data Governance Maturity Model Actually Measures
A data governance maturity model is not a policy ladder. It is an operational scoring system for how reliably an organization manages data during routine delivery, incidents, change, and scale. The score should show whether people, processes, metrics, and technology produce data that users can understand, access appropriately, and trust.
Capability-based management established the logic behind progressive adoption of defined practices. CMM-style models apply that logic to organizational capability, while ITIL assesses repeatable service behavior. A governance maturity model extends the approach to data, giving executives a comparable baseline, exposing investment gaps, and setting priorities across business units.
Maturity is not compliance
Compliance checks whether a required condition exists. Maturity measures whether the organization can meet that condition consistently across assets, teams, and changing circumstances. A company may pass an audit with an approved retention policy while lacking the lineage, ownership, and monitoring needed to prove that systems follow it in daily operations.
Maturity also differs from a descriptive body of knowledge such as DAMA-DMBOK. DAMA-DMBOK defines the management areas an organization should address. A maturity model evaluates how those areas operate, from informal activity to measured control and continuous improvement. It should also distinguish governance from how data quality and data governance differ, because quality results alone do not prove that ownership, policy, access, or decision rights work.
Score observable evidence
Assessments should score artifacts and operating behavior, including:
named owners and stewards for critical data products
policy controls that block violations, with documented exceptions
quality rules connected to production pipelines
issue queues with accountable owners and tracked resolution
lineage that supports impact analysis
access decisions tied to roles, purposes, and sensitivity
recurring scorecards that trigger governance decisions
The labels vary by framework. The test does not. A higher score requires repeatability, measurement, and institutional adoption. Manual correction of one recurring defect shows effort, not mature quality management. Automatic detection, owner routing, resolution measurement, and preventive action show an operating control.
Score the execution gap directly. If standards sit in documents while delivery teams bypass them, the organization remains operationally immature, regardless of how complete its governance library appears. That evidence-based score is the useful input for investment decisions and AI-readiness planning.
The Five Levels of Data Governance Maturity Explained
A five-stage model is useful only when every level has evidence attached to it. The common progression runs from Initial or Ad Hoc, through Developed or Repeatable, Defined or Standardized, and Managed or Quantitative, to Optimized. This pattern is described in the staged view of data governance maturity.
Capability signals by level
Level | Defining Behavior | Observable Evidence | Common Failure Pattern |
|---|---|---|---|
Level 1, Ad Hoc | Teams manage data locally and react to incidents | No consistent ownership, undocumented quality rules, manual investigations, inconsistent definitions | Firefighting is mistaken for governance |
Level 2, Reactive | A formal program exists, but controls activate after problems appear | Named program, basic standards, steward network, incident tickets, recurring escalations | The organization documents decisions but doesn't prevent repeat failures |
Level 3, Defined | Governance practices apply across the enterprise | Enterprise policy, measured service expectations, business definitions, proactive metadata management, regular reporting | Standards exist, but adoption varies by domain |
Level 4, Managed | Governance is measured and embedded in delivery | Automated controls, lineage-based impact analysis, quantified quality indicators, controlled exceptions, outcome reporting | Teams optimize individual metrics without connecting them to business results |
Level 5, Optimized | Governance continuously improves through feedback and automation | Governance-as-code, AI-assisted oversight, continuous tuning, closed-loop remediation, leadership decisions based on trends | Optimization becomes disconnected from real user needs |
A Level 1 organization can usually identify data problems only after a report, model, or operational process fails. A Level 2 organization has a program and a response network, but the network still depends on people noticing incidents and escalating them. That's why many enterprises remain stuck at Level 2 despite visible governance activity.
At Level 3, the organization has moved beyond isolated projects. Definitions, policies, and service expectations apply across domains, and teams can show how governance enters delivery workflows. The critical test is consistency, not ambition.
Level 4 requires automation and quantification. Reviewers should see controls running in pipelines, lineage supporting change analysis, and quality results connected to business consequences. Level 5 adds continuous improvement. The organization tunes controls using trends, integrates governance into engineering practices, and treats oversight as a living operational capability rather than a periodic assessment.
A stage label is only credible when an independent reviewer can reproduce the score from operational evidence.
Comparing IBM, Gartner, CMMI DMM, and Cloud Maturity Frameworks
Framework selection matters less than scoring discipline. IBM's historical model established an enterprise baseline for governance capability, while Gartner's approach emphasizes dimensions that connect information governance to business value, lifecycle management, roles, metrics, and infrastructure. Gartner's model evaluates seven dimensions, including vision, strategy, metrics, information governance, organization and roles, information lifecycle, and infrastructure enablement, and reaches an Optimized state where governance is embedded and automated in the information lifecycle, as summarized in this Gartner maturity model overview.
CMMI's Data Management Maturity model is more structurally detailed. It covers five maturity levels across 25 process areas organized into six categories, according to this CMMI DMM framework summary. Cloud-vendor assessments from Microsoft Purview, Collibra, Informatica, and Atlan often package similar concepts inside product-led questionnaires and control inventories. Microsoft's guidance presents a four-stage path from Ungoverned to Fully governed, with criteria such as executive sponsorship, defined responsibilities, and a governance control board, as recorded by the National Academies discussion of maturity assessment.
Framework | Stage Labels (Top Level) | Primary Dimensions Scored | Scoring Style |
|---|---|---|---|
IBM Data Governance Council | Initial through Optimizing | Stewardship, policy infrastructure, risk, value, and organizational capability | Enterprise capability progression |
Gartner | Aware or Reactive through Optimized | Vision, strategy, metrics, roles, lifecycle, governance, and infrastructure | Dimension-based progression tied to information management |
CMMI DMM | Structured maturity levels through optimized capability | Process areas, institutionalization, and management discipline | Detailed process evidence across categories |
Cloud vendor models | Ungoverned through Fully governed, or equivalent labels | Cataloging, lineage, policy, access, quality, and platform controls | Productized assessment linked to implementation capability |
The labels don't line up perfectly. One enterprise may score higher under a model that rewards documented policy and lower under one that requires process institutionalization or automated evidence. Treat any vendor score as a starting point, not a verdict.
Core Dimensions That Determine Your True Maturity Score
A reliable assessment scores capabilities separately instead of assigning one flattering enterprise number. The most useful dimensions are ownership and accountability, data quality and observability, metadata and lineage, privacy and access management, and AI and model governance, a structure reflected in this modern maturity dimension guide.
Five evidence tests
Ownership and stewardship come first. Stage 2 looks like a shared mailbox and a steward network that responds to incidents. Stage 4 has named owners with decision rights, documented escalation paths, and accountability for asset-level outcomes. The distinction between owners and stewards matters, and the data governance roles guide provides useful terminology for separating authority from operational management.
Data quality and remediation should be scored through control behavior. A reactive team maintains an exception queue and investigates defects after users complain. A managed team connects automated rules to pipelines, assigns failures to owners, tracks remediation, and reports whether recurring defects decline.
Metadata and lineage must go beyond technical registration. A Stage 2 catalog contains schemas and system details, but users still need personal explanations. A stronger environment has adopted business definitions, lineage that supports impact analysis, and evidence that teams use the catalog in delivery and change decisions.
Privacy and access control mature from role-based permission administration toward purpose-aware access, sensitivity classification, exception review, and traceable approvals. A permission model alone doesn't prove that access remains appropriate as data use changes.
AI and model governance exposes weak foundations quickly. Stage 2 organizations may keep a shadow AI risk list. Stage 4 environments connect model lineage to governed data, require approval gates, monitor use, and retain evidence of decisions.
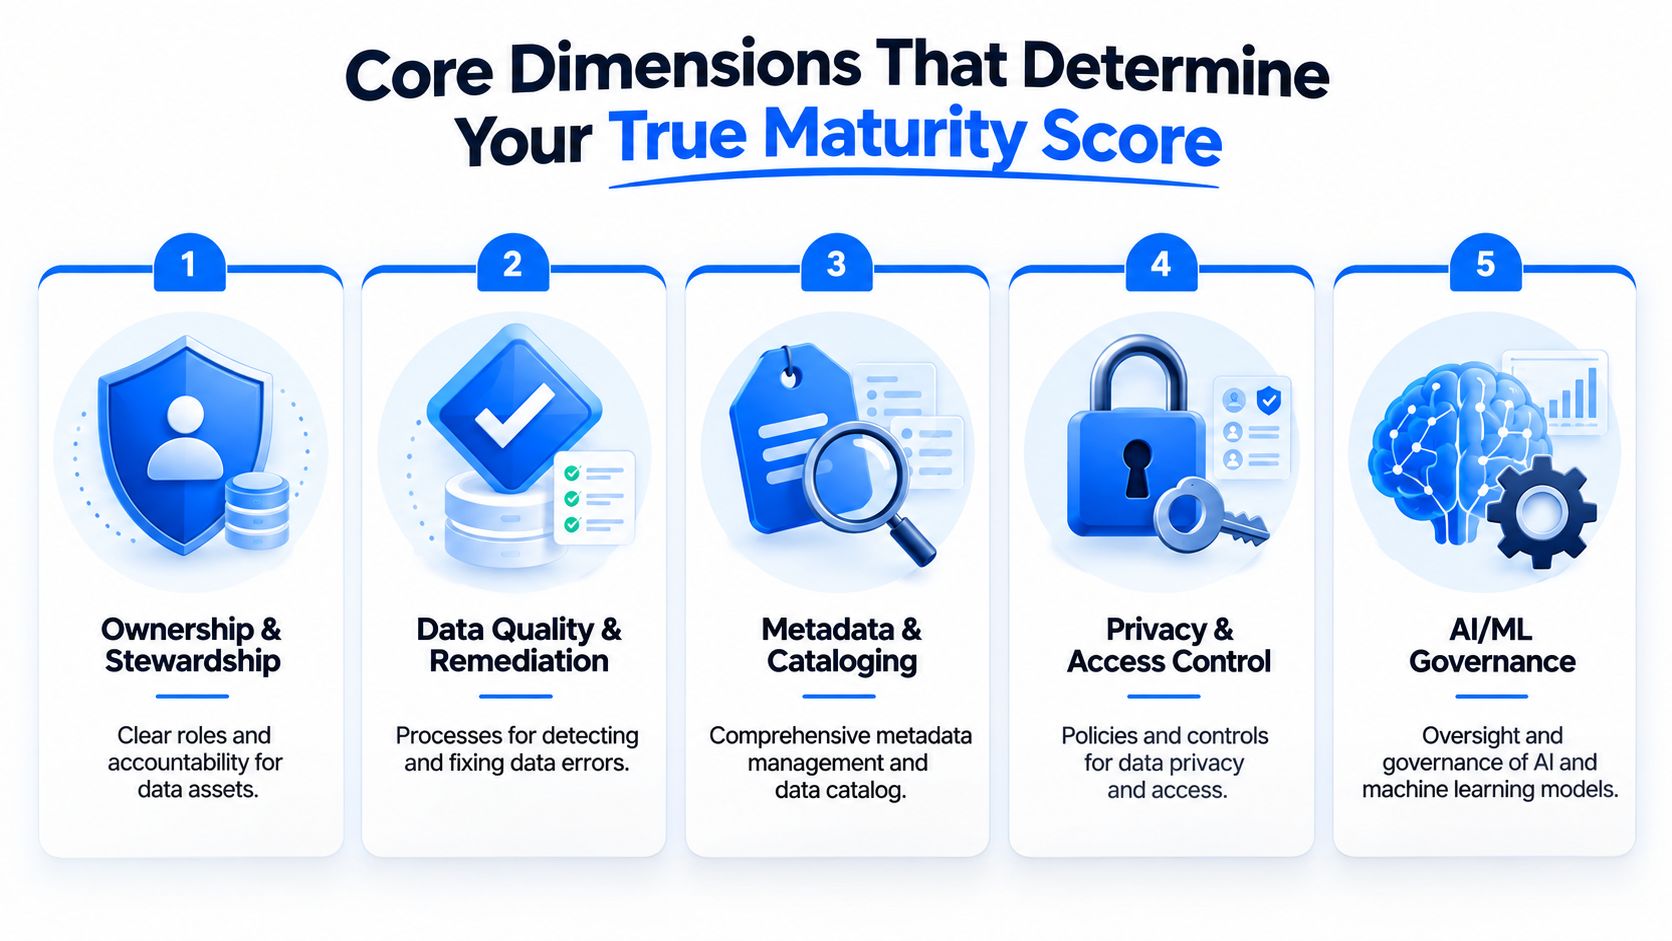
Score each dimension using the same evidence standard. Good intentions, disconnected tools, and a beautifully written framework earn no points unless they produce measured, repeatable behavior.
The Hard Part of Moving From Reactive to Optimized
A mid-sized enterprise can own a published data policy, a catalog license, and quarterly stewardship meetings and still operate at Level 2. The problem usually appears when engineers release a new pipeline. The governance team can describe expected definitions and quality standards, but it has no enforceable data contract with the delivery team, so the first real test arrives when a downstream report breaks.

Why the policy and tooling trap persists
The enterprise adds more documents, expands the catalog, and schedules another council meeting. None of those actions changes who owns a failing data product or what happens when a quality threshold is breached.
Three failed moves appear repeatedly:
Overlaying governance on delivery: Engineers see governance as an approval queue because controls aren't built into their pipelines.
Treating catalog adoption as a rollout: The catalog receives an initial metadata load, but no workflow requires teams to maintain definitions, lineage, or ownership.
Measuring activity instead of outcomes: Leaders count meetings, registered assets, or completed training while users still wait for answers and incidents recur.
The operating model change
Progress from Level 2 to Level 3 requires governance inside everyday delivery. Assign embedded data product owners, publish business-led definitions where analysts work, and connect quality expectations to pipeline behavior. Progress from Level 3 to Level 4 requires automated quality service levels, lineage-driven impact analysis, and decisions that close the loop from detection through remediation.
Operating test: If a governance decision doesn't change a backlog item, pipeline control, access decision, or product definition, it hasn't changed the operating model.
The enterprise doesn't need another maturity workshop first. It needs one domain where ownership, controls, definitions, and resolution are visible enough to prove that governance can operate.
Linking Maturity Scoring to AI Readiness and Business Value
A maturity score matters only when executives can connect it to outcomes and frontline teams can feel the difference. AI makes weak governance harder to hide because models need traceable inputs, appropriate access, reliable quality signals, and documented decisions. An organization stuck at Level 2 may launch generative AI pilots, but production adoption remains constrained when lineage and controls can't be verified consistently.
Research from the EDM Council benchmark program identifies strategic foundations as among the least mature capabilities across industries, with fewer than one third of respondents reaching advanced progress in data strategy, data management strategy, and business case development. The same source reports that 83% of organizations face governance and compliance challenges affecting AI success, while C-suite leaders rate maturity 12% higher than frontline managers. That gap usually means leadership sees a program, while managers experience friction.
Maturity Stage | AI Readiness Signal | Business Outcome | Typical Metric |
|---|---|---|---|
Level 1 | Data sources and ownership are unclear | AI work remains exploratory and fragile | Evidence of unresolved data dependencies |
Level 2 | Pilots exist, but lineage, access, and quality evidence require manual work | Initiatives stall before reliable production use | Manual remediation required before release |
Level 3 | Narrow use cases have defined data owners and repeatable controls | Teams can deliver targeted AI products with operational support | Time to approve governed data use |
Level 4 | Model inputs, lineage, quality, and approvals are monitored | AI operations become more predictable | Production interventions and quality incidents |
Level 5 | Governance continuously tunes controls and feedback loops | AI oversight becomes part of normal product management | Continuous monitoring and documented control changes |
Track cycle time for new data products, defect rates in regulated reporting, and the share of AI initiatives reaching production without manual intervention. AI governance and compliance practices should be evaluated as operating controls, not as a separate compliance presentation.
A Practical 90-Day Roadmap to Advance Governance Maturity
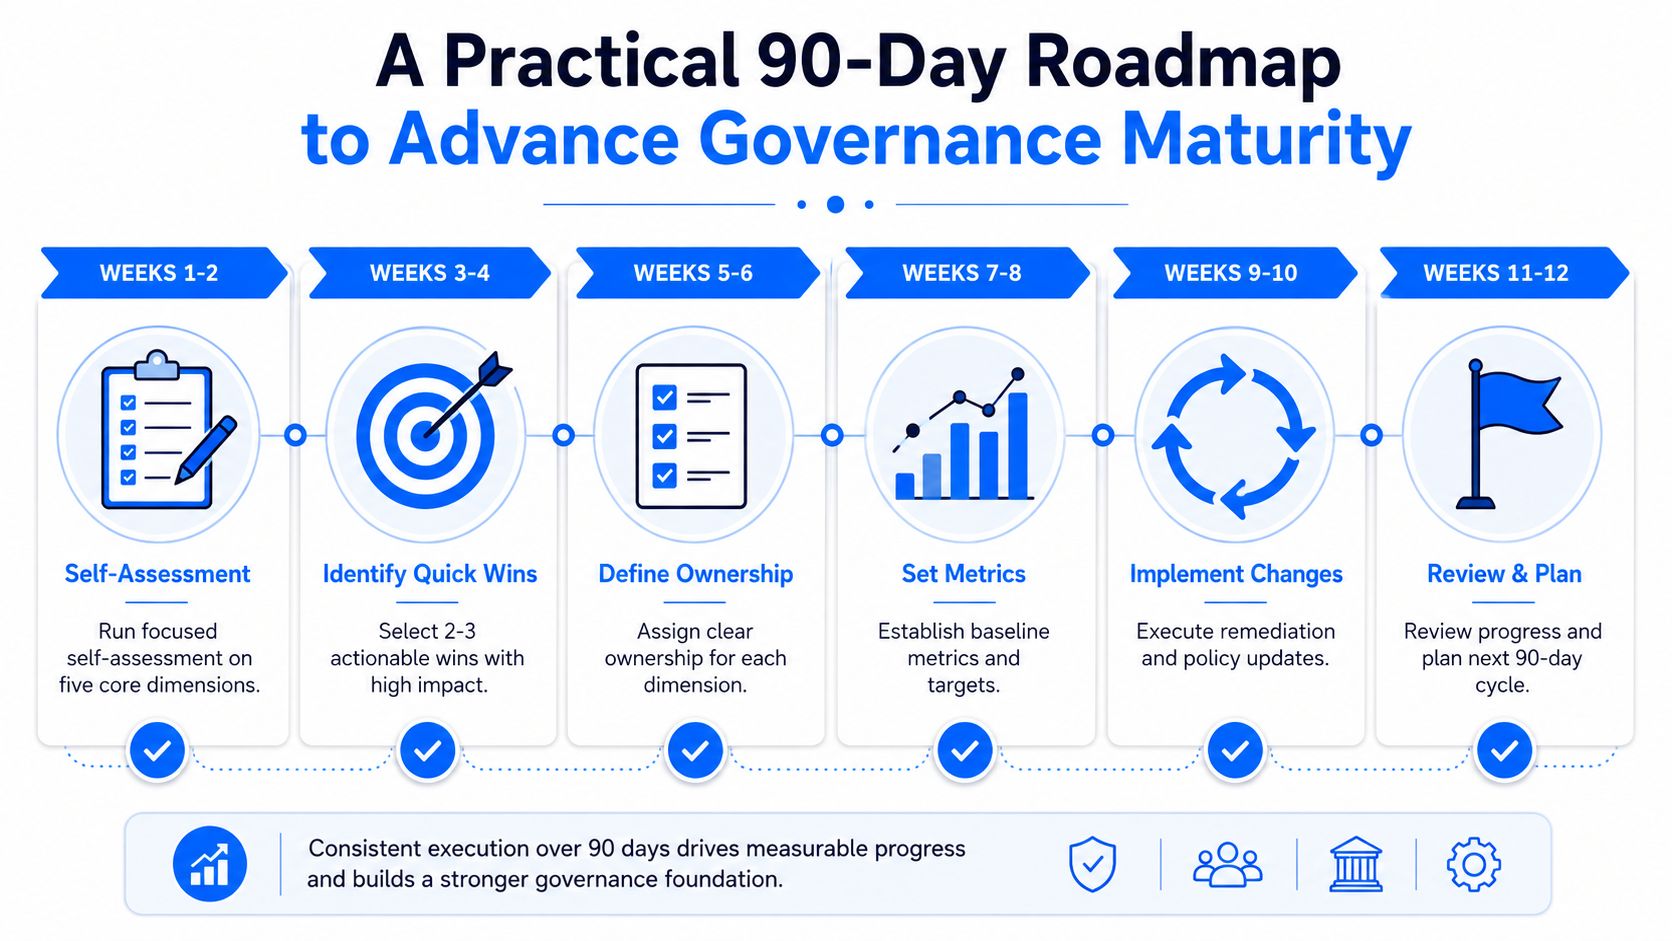
Annual assessments create a report and then lose momentum. Use a 90-day cycle with deliverables that a steering committee can inspect.
During weeks 1 and 2, assess the five core dimensions using evidence. Don't ask whether a policy exists. Ask whether a reviewer can find an owner, observe an active control, verify a lineage path, inspect an access decision, and identify an AI approval gate.
During weeks 3 through 6, choose the single domain creating the most friction. Name the owner, instrument quality rules, publish a lineage map, and define the resolution path. Keep the scope narrow enough that teams can demonstrate changed behavior.
During weeks 7 through 10, establish a lightweight council with a charter, decision rights, escalation rules, and a published scorecard. The council must resolve issues, not merely discuss them.
During weeks 11 and 12, present a stage-progression memo to the steering committee. Show the baseline, evidence collected, controls implemented, unresolved gaps, and the next investment decision. A practical data governance strategy should turn that memo into the next operating cycle.
Internal checklist
Score each question yes or no:
Ownership: Do critical domains have named owners with decision rights?
Quality: Do critical data assets have documented and monitored quality service levels?
Lineage: Can teams trace important data from origin to material business use?
Access: Can the organization show why sensitive data was accessed and who approved it?
AI controls: Do AI use cases pass documented governance gates before operational use?
Resolution: Does every material data issue have an accountable owner and closure evidence?
Pick one domain, name one owner, and instrument one quality rule this week. That single move creates more evidence of maturity than another enterprise-wide policy refresh.
digna helps governance teams turn maturity claims into operational evidence through in-database validation, anomaly detection, timeliness monitoring, schema tracking, and shared visibility into data incidents. Visit digna to evaluate how its modular observability capabilities can support measurable quality controls and a stronger path toward AI-ready governance.

Poznaj zespół tworzący platformę
Zespół z Wiednia, składający się z ekspertów od AI, danych i oprogramowania, wspierany rygorem akademickim i doświadczeniem korporacyjnym.