Observability vs Monitoring: A Practical Decision Guide
|
7
min read

The bad advice in this debate is simple: pick observability and retire monitoring. That sounds modern, but it's wrong for real data teams. Monitoring is your control layer, observability is your diagnostic layer, and the right answer depends on the cost of being wrong for each workload.
Decision point | Monitoring | Observability |
|---|---|---|
Primary job | Detect known bad states | Explain unknown or multi-factor failures |
Best evidence | Thresholds, alerts, stable signals | Correlated metrics, logs, traces, and context |
Auditability | High when controls are explicit | Weaker if it replaces explicit controls |
Cost profile | Lower and narrower | Higher and broader |
Best fit | Stable, well-understood failure modes | Complex, distributed, or high-blast-radius failures |
Table of Contents
Why the Observability vs Monitoring Debate Misses the Real Question
Where AI Anomaly Detection and Schema Tracking Earn Their Keep
Tool Fragmentation and the Real Obstacles to Unified Coverage
Why the Observability vs Monitoring Debate Misses the Real Question
The argument usually gets framed like a horse race, as if one discipline should replace the other. That framing is lazy. Monitoring and observability solve different problems, and the wrong substitution creates blind spots instead of clarity.
Monitoring is explicit control. You define the signal, set the limit, and alert when reality crosses it. Observability is broader, because it's about making internal state inferable from emitted data so engineers can explain unfamiliar failures, not just confirm anticipated ones. The practical question isn't which term sounds more current, it's which level of diagnostic depth the workload justifies.
That matters because replacing monitors with broad observability can weaken governance. If you make controls implicit, you make them harder to audit. For a data platform, that's a bad trade. A missing load, a broken schema, or a KPI drift problem doesn't need philosophical elegance, it needs an explicit owner, an alert, and an evidence trail.
Practical rule: keep explicit monitors for known failure modes, then add observability only where you need root-cause depth, correlation, or exploratory diagnosis.
Google's Site Reliability Engineering book formalized the four golden signals for user-facing services, latency, traffic, errors, and saturation. That baseline still holds up because it gives teams a compact monitoring layer for known problems. But data platforms need more than service health. They also need freshness, schema stability, record validity, business metric behavior, and workload consumption.
If you're deciding where to invest, stop asking whether observability is better than monitoring. Ask what evidence you need when a dataset, pipeline, or report goes wrong, and how expensive it is to be late, vague, or wrong.
What Monitoring and Observability Actually Mean
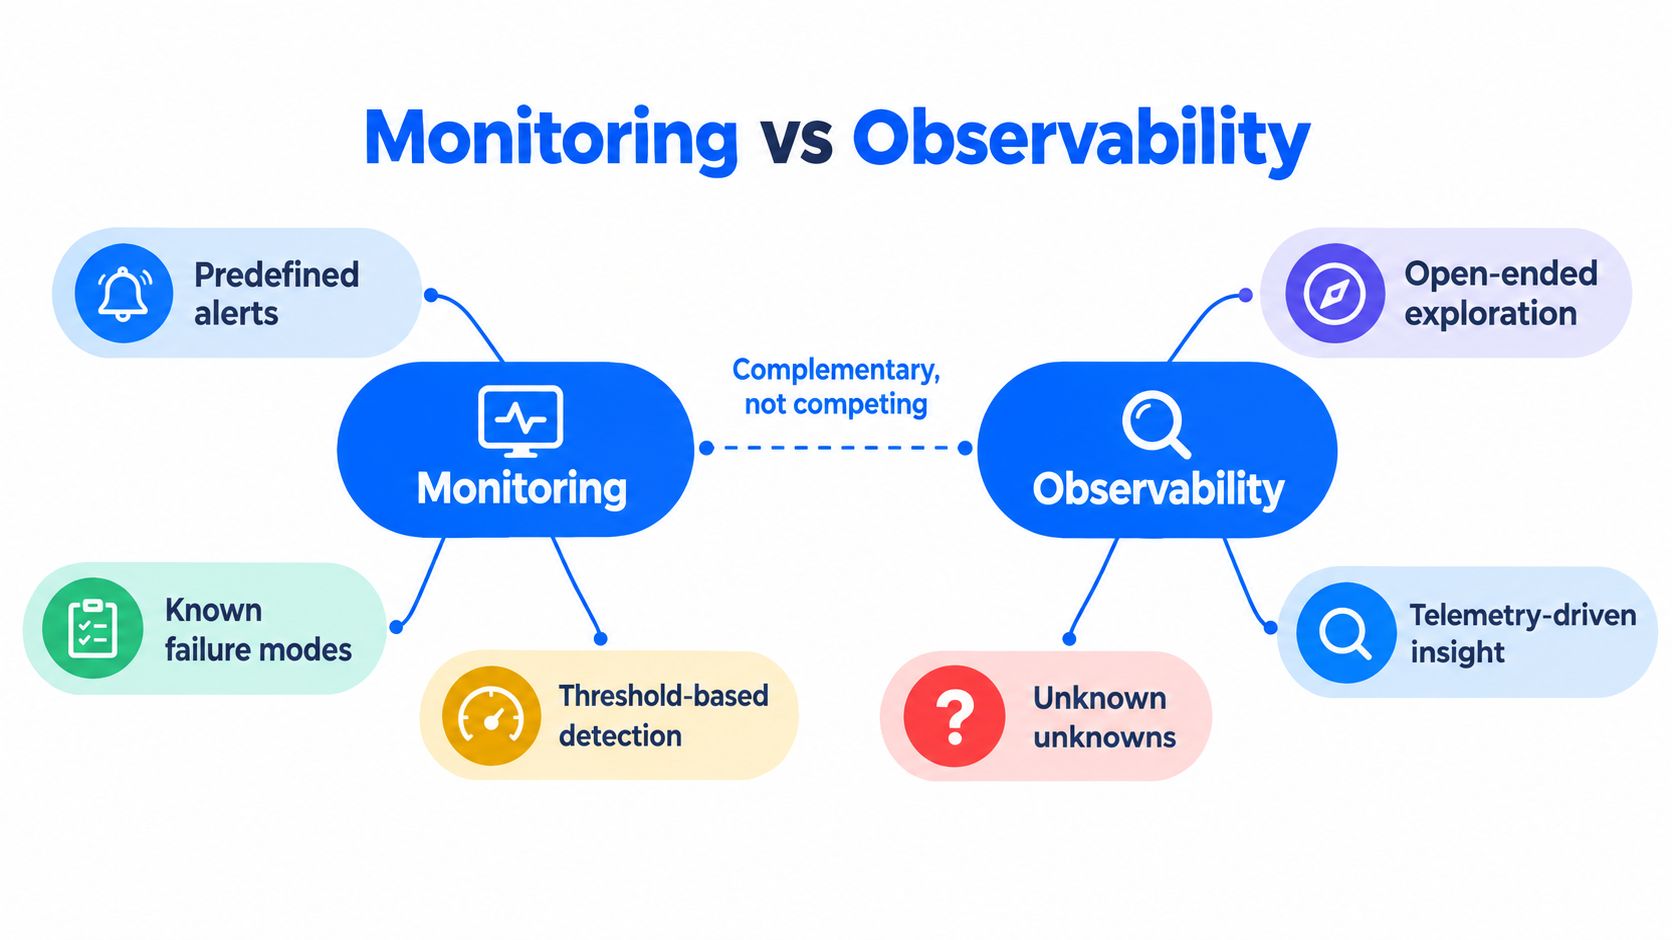
Monitoring is a predefined detection function. Teams choose indicators such as request rate, error rate, latency, CPU utilization, or data arrival status, then alert when values cross a threshold or leave an expected range. It answers a narrow but essential question, is a known condition outside its limit?
Observability is broader. It asks whether you can infer a system's internal state from the data it emits. In practice, that means correlating metrics, logs, and traces so engineers can investigate a failure they didn't predict when they wrote the alert.
The baseline most teams should start from
The classic service-level view still matters. Google's SRE model gives you a minimum monitoring baseline with latency, traffic, errors, and saturation. Those signals are useful because they force discipline. A latency alert says the service is slow, traffic tells you demand changed, errors tell you requests failed, and saturation tells you a constrained resource is close to full use. You don't need more theology than that.
For data platforms, the mapping is direct but not identical. Replace service latency with freshness and delivery timing. Replace traffic with workload and consumption patterns. Replace errors with failed jobs, invalid records, or broken transformations. Replace saturation with warehouse, cluster, or pipeline pressure.
Monitoring tells you that something crossed a line. Observability helps you explain what changed, where it changed, and what else it touched.
That distinction is why data teams get burned when they treat a green dashboard as proof of correctness. A dashboard can be available and still be analytically wrong because the data is stale, incomplete, duplicated, or structurally changed. If your business depends on the output, you need both the control and the evidence.
For a practical entry point, see digna's data observability approach.
Goals, Telemetry, and Detection Versus Diagnosis
The cleanest way to separate these disciplines is to compare what they're for, what evidence they use, and how far they take you. Monitoring is about control objectives. Observability is about diagnosis. One is built for known limits, the other for investigation under uncertainty.
Decision matrix
Criterion | Monitoring | Observability |
|---|---|---|
Control objective | Enforce known limits and service expectations | Explain internal behavior and emergent failure patterns |
Typical trigger | Threshold breach, missing job, failed rule, late delivery | Unusual correlation, behavior shift, unexplained anomaly |
Telemetry focus | Aggregated metrics and alerts | Correlated metrics, logs, traces, and richer context |
Question answered | What happened, and did it exceed tolerance? | What changed, why did it change, and what else may be affected? |
Ownership pattern | Clear operational owner for known checks | Cross-functional diagnosis across platform, data, and application teams |
Audit trail | Strong when controls are explicit | Stronger for investigation than for formal control evidence |
Cost profile | Usually narrower and cheaper to run | Broader, more expensive, and easier to overbuild |
OpenTelemetry's basic split is useful here. Metrics are runtime measurements, logs are event records, and traces are request paths through services. Correlation is the whole point. A metric tells you latency rose, a trace shows which path slowed down, and logs explain the event that caused it. IBM's observability material makes the same point in plain language, metrics alert, traces show execution paths, and logs provide context for resolution.
For data teams, that means you don't choose telemetry by fashion. You choose it by diagnostic value. If a failed batch job is the issue, a monitor may be enough. If a downstream model, report, or customer workflow is wrong, you need the extra context to connect the symptom to the cause.
Use the right evidence for the right job
Monitoring for controls: Use it where the failure mode is known, the limit is stable, and the evidence must be explicit.
Observability for diagnosis: Use it where the cause is uncertain, the dependency graph is messy, or multiple systems may be involved.
Both together: Use both when the cost of being wrong is high and the failure could be silent.
If you want a more operational framing, start with observability best practices for data teams. The point isn't to collect everything. The point is to collect enough evidence to make the next decision defensible.
Detection Scenarios in a Data Platform
Abstract definitions don't move teams. Incidents do. The easiest way to separate monitoring from observability is to test them against the failures data platforms produce.
Failed nightly load and delayed delivery
A failed batch job is the easiest case. Monitoring should catch the broken run, the missing table, or the late arrival. The alert should be blunt and actionable. Observability adds value only if the failure isn't obvious, for example when the job finished but a dependency stalled, a partition didn't land, or the data arrived after the business window closed.
That is where timeliness tracking matters. If a regulatory feed, finance extract, or operational snapshot has a deadline, the alert should say the data is late. The observability layer should show whether the source was delayed, the transfer lagged, or a downstream step held the record back.
Silent schema change and downstream breakage
A schema drift event is exactly where monitoring by itself is weak. The pipeline may still run, but the data contract is broken. Monitoring can catch a missing column, a failed parse, or a rule violation if you already wrote the check. Observability needs schema context, lineage, and affected consumers so you can see what changed and which report or model is now untrustworthy.
KPI drop and business impact
A revenue reporting drop is a different problem. The data may still be technically valid, but the business result has shifted. Monitoring can flag the KPI deviation if you explicitly track it. Observability is useful when you need to connect that change to volume, seasonality, upstream behavior, or a workload shift in the source systems.
In-database execution and analysis
The best diagnostic path often ends in the warehouse or lake itself. If you compute checks in place, you reduce movement and keep the evidence close to the data. That's a better fit for sensitive environments than spraying copies of records across extra tools.

If you're dealing with anomaly-heavy datasets, types of anomaly detection is the right next question. But don't overcomplicate static reference tables or append-only compliance feeds. Those workloads usually need firm monitoring first, not fancy exploration.
Telemetry Stacks and What They Actually Cost
Tooling is where good intentions go to die. Teams usually think they're buying visibility, then discover they've bought setup work, integration drag, and another alert queue.
The real cost is operational friction
In Grafana Labs' 2025 survey of 1,255 respondents, complexity was the leading observability concern, alert fatigue was the largest obstacle to faster incident response, and observability spending averaged 17% of total compute-infrastructure spend. That tells you two things. First, observability isn't free. Second, more telemetry doesn't automatically mean faster diagnosis. It can just mean more work.
Open standards help, but they don't erase the burden. OpenTelemetry and Prometheus-class stacks make it easier to move data around and keep instrumentation portable. They do not magically reduce alert noise, data-pipeline setup, or the coordination needed to turn signals into action.
Choose the stack by evidence value
Stack pattern | Best use | Main trade-off |
|---|---|---|
Metrics-first monitoring | Stable services, known SLOs, explicit alerts | Narrower diagnostic depth |
Metrics plus logs plus traces | Distributed systems and multi-step investigations | Higher setup and correlation effort |
In-database execution | Sensitive data, warehouse-centric workloads, lower data movement | Less flexibility if you overconstrain the model |
An in-database approach changes the economics. It keeps data in place, reduces movement, and fits environments where governance matters as much as speed. That's often the right answer for enterprise data platforms, because the telemetry should live close to the data it describes. If you have to copy half the warehouse just to measure it, you're probably doing too much.

If you want one practical recommendation, use the cheapest stack that still produces a defensible diagnosis for the workload. Anything more is decoration.
Where AI Anomaly Detection and Schema Tracking Earn Their Keep
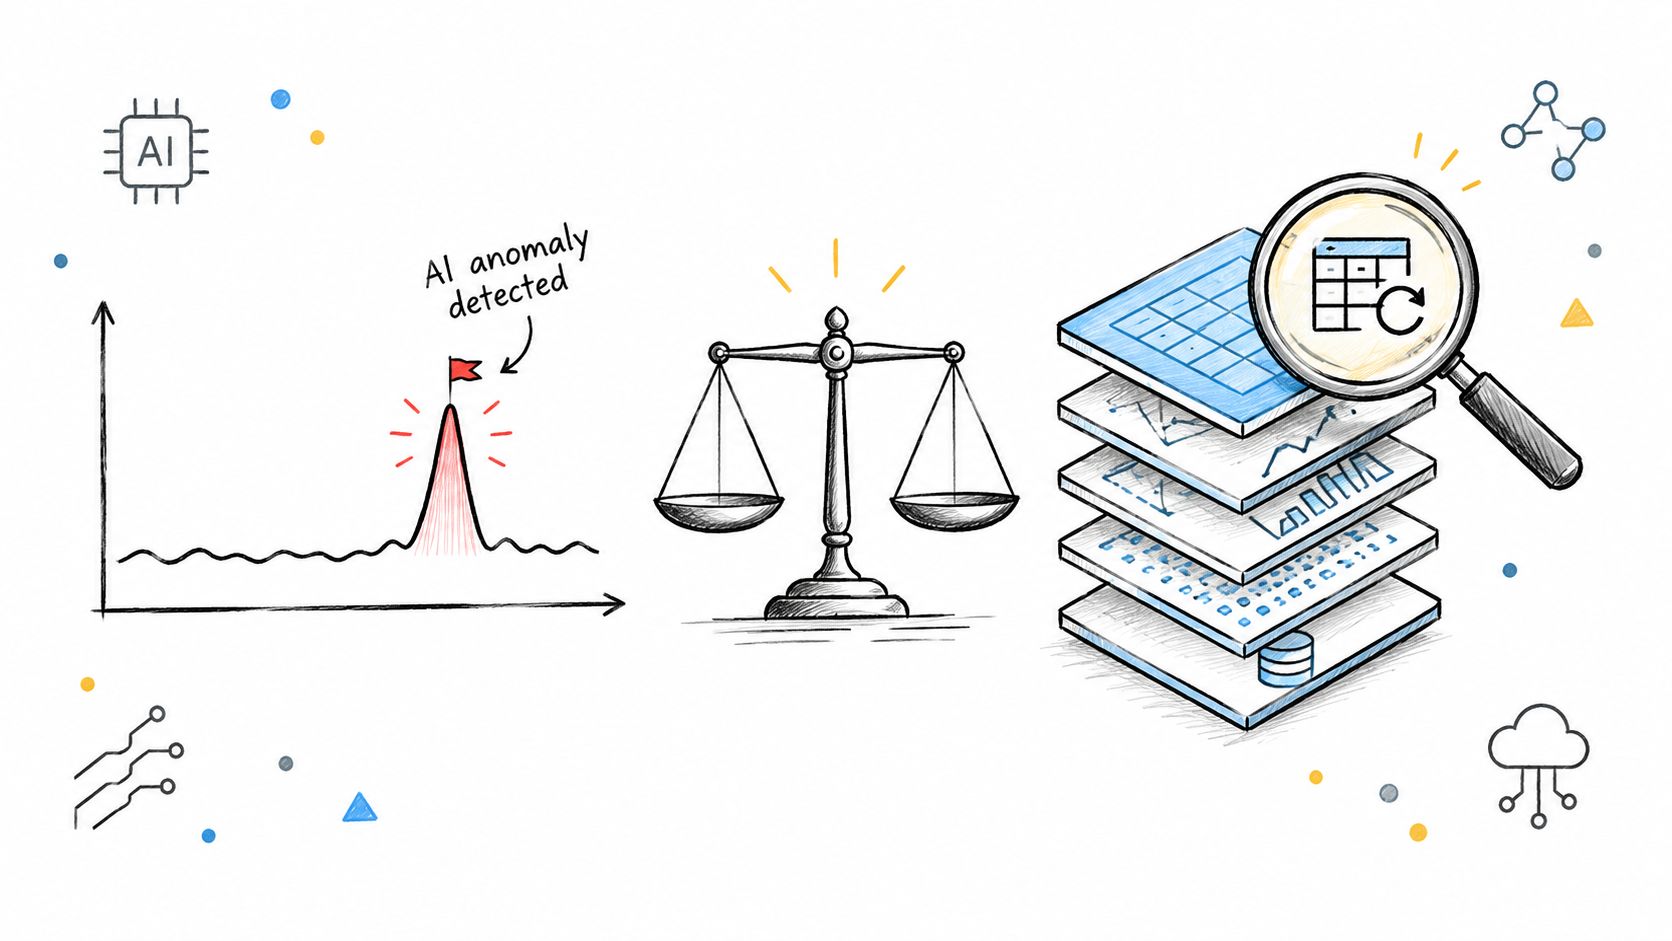
AI anomaly detection is useful when static thresholds fail. If a dataset has volatile revenue, erratic consumer behavior, sensor noise, or machine-generated events, fixed limits become blunt instruments. Baseline learning and continuous comparison can spot meaningful deviation without forcing teams to hand-tune every rule.
Use statistical detection where behavior moves
AI-driven anomaly detection earns its keep here. It helps when the shape of the data changes over time and the signal matters more than the exact number. A threshold can tell you something is high. A baseline can tell you something is unusual.
It's a bad fit for static reference tables, deterministic keys, and append-only compliance feeds. Those workloads don't need cleverness. They need reliable checks and clear ownership.
Match the control to the dataset
Freshness and timeliness: Use arrival monitoring where the business cares about when data lands, not just whether it lands.
Schema tracking: Use it wherever downstream consumers depend on structure staying stable.
Record validation: Use it for business-rule enforcement, especially where audit evidence matters.
In-database execution: Use it when security, governance, or data movement is the constraint.
The practical mistake is treating every dataset as equally dynamic. It isn't. A slowly changing dimension table does not deserve the same observability bill as a high-volume transactional feed or a volatile revenue stream.
I'd also keep schema tracking separate from anomaly detection in your head. Schema drift is structural. Anomaly detection is behavioral. You need both in a serious data estate, but they solve different problems and shouldn't be justified with the same argument.
If you're deciding where to invest, how AI detects data anomalies in pipelines is the right lens. Use intelligence where variance is real, not where a rule will do the job cleanly.
Tool Fragmentation and the Real Obstacles to Unified Coverage
If observability were just a tooling upgrade, unified coverage would already be normal. It isn't. A 2026 CNCF survey of 407 practitioners found that 46.7% of organizations ran two or three observability tools in parallel, while only 7.4% had reached a single unified observability experience. Dashboard and alert configuration was the top setup challenge at 54%.

That's the story. The hard part isn't buying another platform. It's wiring telemetry into a workflow that produces actionable diagnosis instead of more tabs. Integration complexity and data-pipeline setup slow teams down because every extra signal creates work for engineers, operators, and analysts.
Operational rule: instrument the fewest datasets at the deepest level, and keep the rest on explicit monitoring. Blanket coverage usually just creates alert fatigue and weak ownership.
This is also why observability maturity is a workflow problem before it's a tooling problem. If nobody owns the monitor, the alert becomes noise. If nobody can explain the signal, the data becomes decorative. Match coverage depth to criticality, not to optimism.
For a practical implementation path, digna's data observability tools fit the model of selective depth. The right stack is the one your team can operate.
A Hybrid Operating Model and Industry Specific Implications
The defensible model is hybrid. Monitoring handles control objectives, audit evidence, and stable service-level expectations. Observability handles exploratory diagnosis, baselining, and emergent failures. That's not compromise, it's discipline.
This matters most in regulated or high-blast-radius environments. In financial services, you need explicit checks for financial, risk, regulatory, and transactional data because the evidence has to stand up in front of auditors and operations teams. In healthcare, reliability and traceability matter because clinical and operational data can't drift unnoticed. In telecommunications, high-volume behavior changes fast, so you need strong monitoring plus enough observability to explain spikes, delivery issues, and platform consumption. In the public sector, audit-ready evidence and consistency matter more than flashy coverage.
A simple operating policy
Monitor what must not fail without notice. Use explicit controls for missing loads, stale data, schema changes, and business-rule violations.
Observe what you can't predict. Add deeper telemetry where the failure path is ambiguous, distributed, or costly to untangle.
Reassess each workload. If the data changes faster than your thresholds, move more of that workload into observability.
The worst mistake is assuming one discipline is the mature version of the other. They are partners with different jobs. Monitoring keeps the lights on. Observability explains why the lights flickered.
For enterprise data teams, that's the whole decision. Assign each workload to the discipline that matches its failure cost, compliance burden, and telemetry maturity, then revise the split as your stack evolves. If you want a platform built around that exact logic, visit digna and see how it handles data anomalies, timeliness, schema changes, validation, and in-database execution inside your own environment.
Running that hybrid split is simpler when the explicit controls and the diagnostic evidence sit in the same place as the data. digna's data platform observability runs anomaly detection, validation, timeliness and schema tracking inside your own database, so each workload gets the depth it needs without copying records into yet another tool.
Frequently asked questions
What is the difference between observability and monitoring?
Monitoring detects known bad states with predefined thresholds and alerts, while observability explains unknown or multi-factor failures by correlating metrics, logs and traces. Think of monitoring as the control layer and observability as the diagnostic layer, which is why most data teams need both rather than one replacing the other.
Should observability replace monitoring?
No. Swapping explicit monitors for broad observability makes controls implicit and harder to audit, which is a bad trade for a data platform. Keep explicit monitors for known failure modes such as missing loads, broken schemas and KPI drift, then add observability only where you need root-cause depth or correlation.
What are the four golden signals of monitoring?
Google's Site Reliability Engineering book names them as latency, traffic, errors and saturation. On a data platform they map to freshness and delivery timing, workload and consumption patterns, failed jobs or invalid records, and warehouse, cluster or pipeline pressure, plus schema stability and business metric behavior.
How much does observability cost compared to monitoring?
Observability is broader and noticeably more expensive. In Grafana Labs' 2025 survey of 1,255 respondents, observability spending averaged 17% of total compute-infrastructure spend, and complexity was the leading concern. Monitoring is narrower and cheaper, so the practical advice is to run the cheapest stack that still produces a defensible diagnosis.
When should you use AI anomaly detection instead of fixed thresholds?
AI anomaly detection pays off when data behavior moves, for example volatile revenue, erratic consumer activity, sensor noise or machine-generated events, where fixed limits become blunt instruments. Static reference tables, deterministic keys and append-only compliance feeds are a poor fit, because they need reliable rule-based checks and clear ownership instead.