10 Best Data Observability Tools of 2026: An Analysis
|
7
min read

Your warehouse jobs ran. The dashboard loaded. Nobody got a pipeline failure alert. Then a stakeholder asks why yesterday's revenue fell off a cliff, and the answer is ugly: the data was wrong for hours, maybe days, and your monitoring never caught it.
That's the gap data observability tools are meant to close. They watch for late data, broken schemas, drifted distributions, and other silent failures that sit downstream from infrastructure health. The category is growing quickly because modern pipelines are sprawling, AI workloads are less forgiving, and teams can't keep adding manual checks forever. Research and Markets estimates the global data observability tools market will reach between USD 2.0 billion and USD 4.0 billion by 2025, with growth projected to USD 3.5 billion by 2033 at a 12.5% CAGR from 2026 to 2033, driven by demand for end-to-end visibility and more complex data pipelines (global data observability tools market outlook).
If you're already tightening your broader reliability practice, this Webtwizz app health guide is a useful companion read. For the tooling decision itself, the fastest way to cut through vendor noise is to use a framework. The tools below are compared through an enterprise lens across nine practical criteria: anomaly detection, validation depth, lineage context, timeliness coverage, deployment model, privacy posture, scalability, usability, and pricing clarity.
Table of Contents
1. digna

A pipeline breaks at 2 a.m. The immediate question is not whether your observability tool can raise an alert. The question is whether it can inspect the problem without pulling sensitive production data into someone else's SaaS environment.
digna is unusually explicit on that point. Its model centers on in-database execution inside customer-controlled infrastructure, with private cloud and on-prem deployment options. For regulated teams, that architecture can be the deciding factor because data movement, residency, and vendor access are procurement issues as much as engineering issues. That direction also matches broader data observability market architecture trends.
Why digna stands out
digna groups observability into five modules: Data Anomalies, Data Analytics, Timeliness, Data Validation, and Schema Tracker. In practice, that means one platform can cover unexpected metric shifts, late or missing loads, rule-based checks, structural drift, and historical investigation.
I like the design choice because it reflects how incidents unfold. A freshness alert often turns into a validation problem. A schema change can trigger an anomaly. Teams that buy separate tools for those workflows usually create handoff friction, duplicate alerts, and long triage loops.
That overlap still confuses buyers. Many teams are trying to decide whether anomaly detection and rule-based quality checks should sit in one platform or two, and recent commentary on data observability and data quality overlap shows how blurry that line remains in the market.
If you want a concise explanation of the statistical approach behind this style of monitoring, digna's guide to Monte Carlo methods for better data observability is a useful reference.
Practical rule: If the governance team, analytics engineering team, and platform team are each evaluating different products for anomalies, freshness, and validation, pause and map the overlap before signing anything.
digna also advertises fast time to first value. I would treat that as a positive signal, not a promise. Private deployments still depend on identity setup, warehouse access, networking constraints, and internal review cycles.
Best fit and trade-offs
digna makes the most sense for enterprises that evaluate tools against more than alerting features. In this article's framework, that shows up across deployment model, privacy posture, data movement, validation depth, timeliness coverage, schema monitoring, and enterprise-readiness. Those criteria tend to matter more in large organizations than a polished SaaS trial.
The primary digna advantage is architectural control. Customer data stays in the customer environment, and the same interface covers anomaly detection, validation, timeliness, and schema drift. That is a strong fit for teams in finance, healthcare, telecom, and government, where security review can eliminate otherwise capable vendors before a proof of concept even starts. The gap is real enough that analysis of government observability deployment requirements calls out the need for platforms that work across varied data sources without exposing raw production datasets.
The trade-offs are straightforward:
No public pricing: shortlisting takes longer because buyers need a sales conversation before they can compare cost.
More implementation work: private cloud and on-prem setups usually require platform engineering time.
Less optimized for quick-start SaaS buying: smaller teams that want a lightweight trial may prefer tools with a lower setup bar.
For buyers who rank privacy, deployment flexibility, and enterprise controls alongside detection quality, digna deserves serious consideration.
2. Monte Carlo
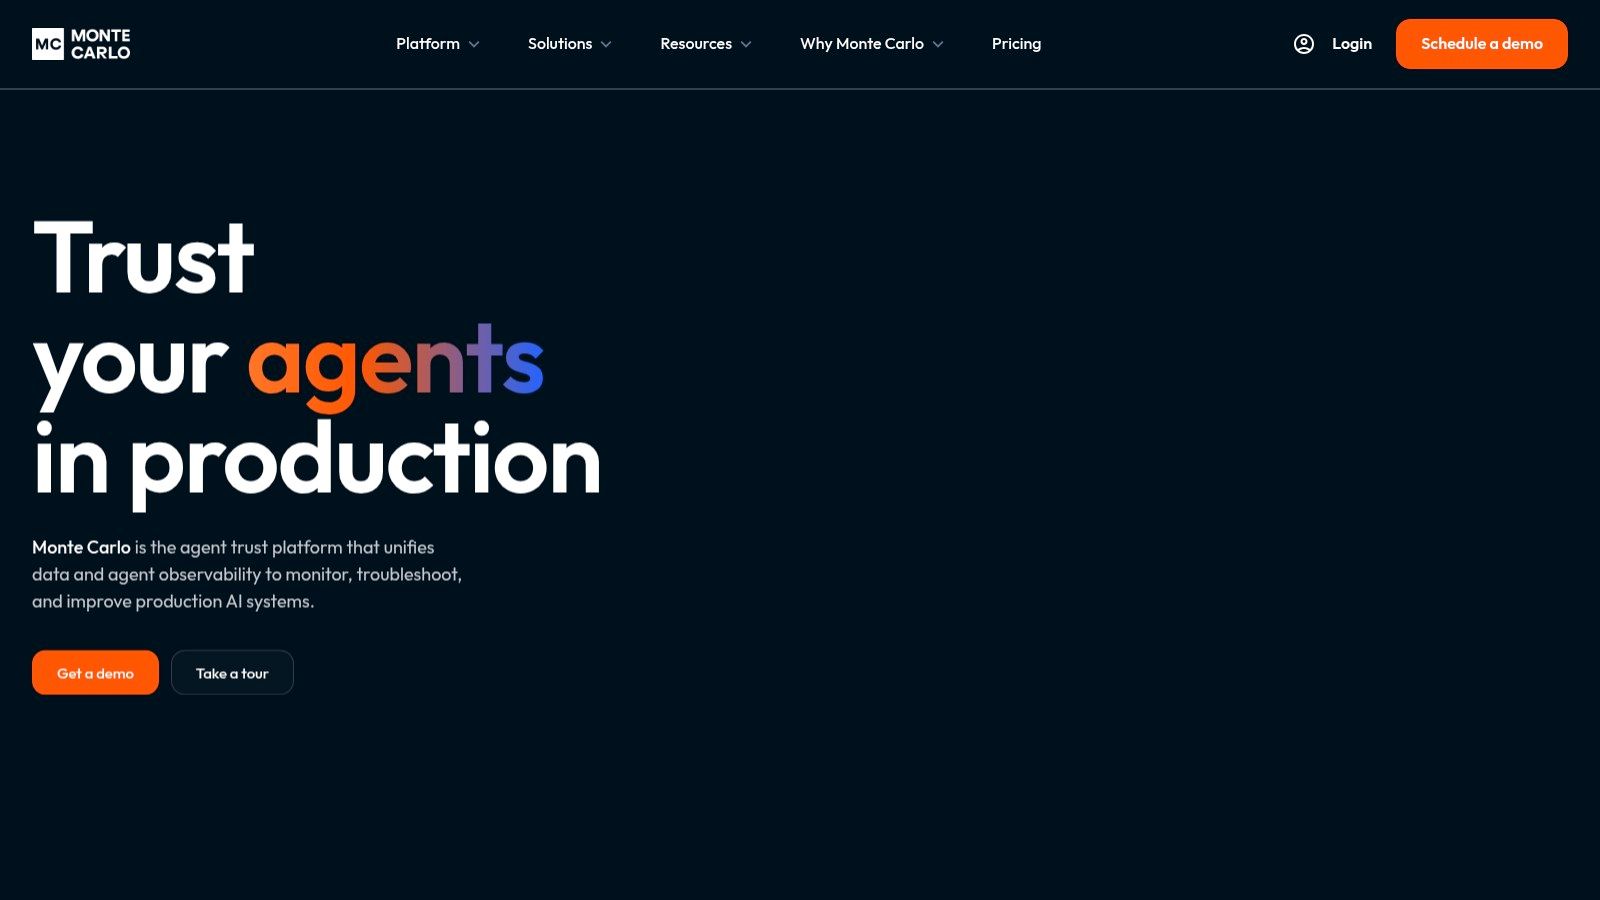
A common enterprise failure pattern looks like this: the team spots a data issue quickly, then loses hours figuring out which downstream tables, dashboards, and models are affected. Monte Carlo is built for that second part of the problem. It covers warehouses, pipelines, BI assets, and newer AI observability use cases, but its real value shows up after an alert fires.
The product is strongest in environments where incident response needs structure. Automated monitors, field-level lineage, and triage workflows are important. Detection is only half the job. The harder part is sizing the blast radius, assigning ownership, and deciding whether to quarantine bad data before it reaches executives, customers, or production models. Monte Carlo's Circuit Breakers feature reflects that operating model. For readers who want more background on the probabilistic ideas behind this approach, digna's explanation of Monte Carlo methods for better data observability is a useful reference.
Where Monte Carlo is strongest
Monte Carlo belongs on the shortlist when the evaluation criteria favor operational maturity over deployment flexibility. In this article's framework, it scores well on breadth of integrations, lineage depth, alerting workflow, and support for large-scale incident management. That makes it a practical fit for data platform teams that already run a sizable warehouse estate and need observability tied closely to day-to-day operations.
The trade-off is the one buyers should examine early. Monte Carlo is a sales-led enterprise product, so cost can rise with scope, and scope tends to expand once teams start instrumenting more assets. Buyers should also weigh deployment and privacy requirements carefully. If private-cloud options, strict data residency controls, or minimal metadata movement are central decision criteria, those questions need clear answers before a proof of concept starts.
Choose Monte Carlo when incident handling, lineage context, and broad ecosystem coverage matter more than a lightweight rollout. Look elsewhere if your priority is low-cost adoption or tighter control over deployment architecture.
3. Bigeye

Bigeye feels like a tool built for buyers who already know they need enterprise controls. It covers the standard observability signals well, including freshness, volume, distribution, schema, and lineage. The stronger story is security posture and deployment flexibility, especially for teams that need read-only access patterns and formal access controls from day one.
This is one of the tools I'd put in front of security-conscious data platform teams that don't want to bolt governance onto observability later. Agentless read-only connectivity can be a decisive buying point when security review is strict and developer time is limited.
Best fit in practice
Bigeye is a serious option for larger, data-mature organizations that need observability to survive architecture review, compliance review, and procurement review all at once. Its professional services and partner orientation can also help teams that need enablement, not just software.
The downside is familiar. There's no public pricing, and the product is clearly aimed above the small-team market. If your stack is still simple, Bigeye may feel heavier than you need. If your environment is regulated and politically complex, that weight can be a benefit.
4. Soda (Soda Cloud + Soda Core OSS)
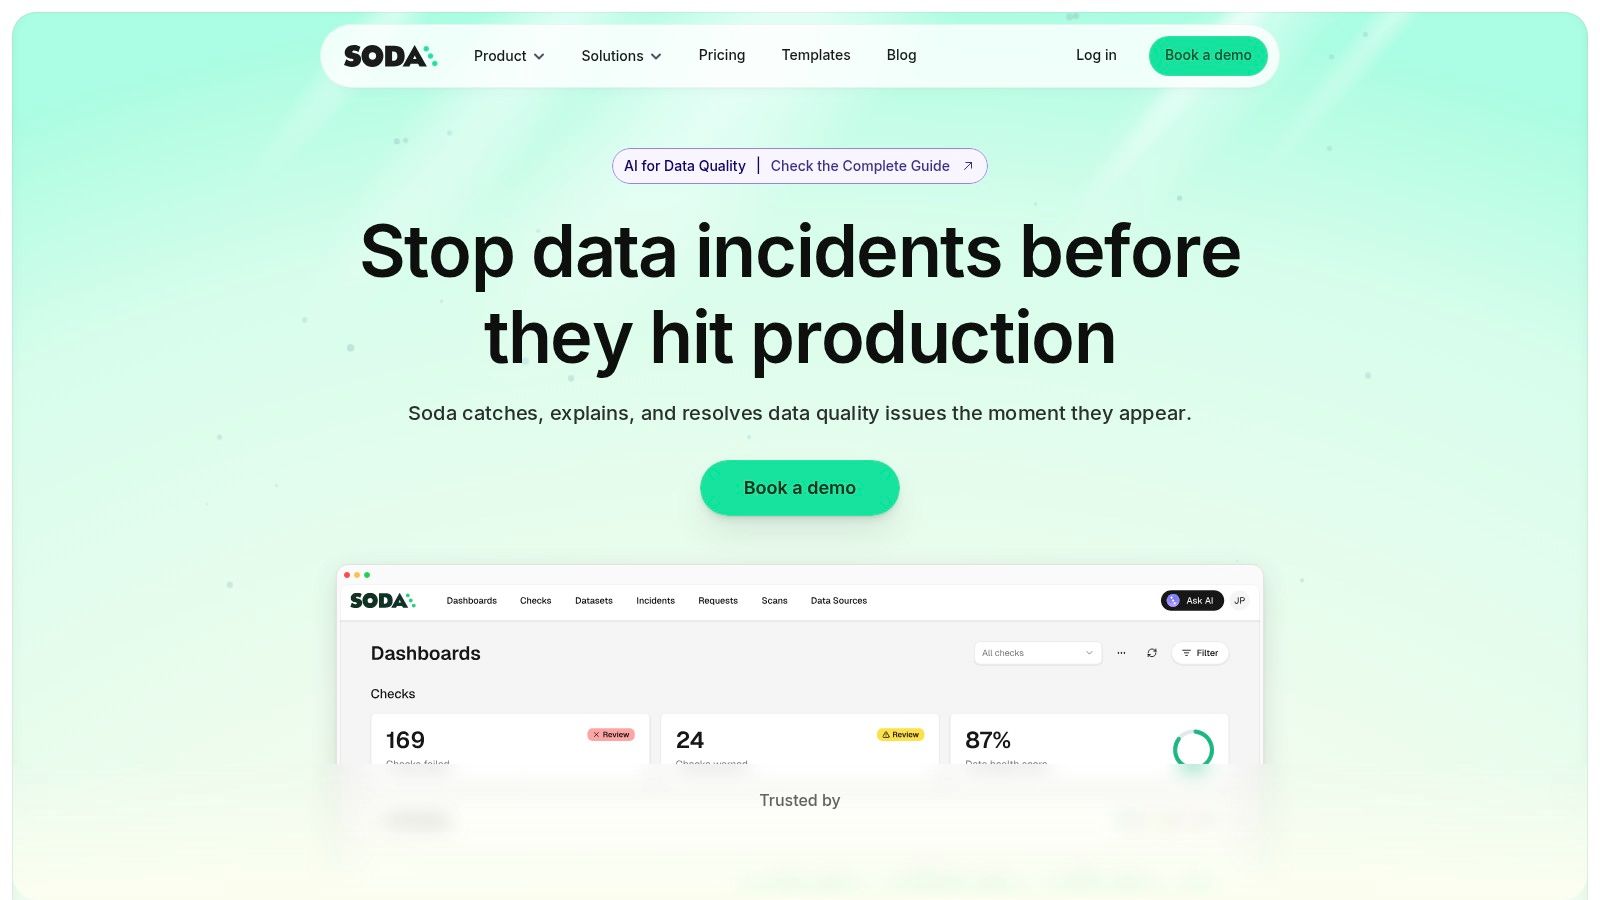
Soda stays relevant because it gives teams two entry points. You can start with Soda Core as open source and define checks in code, then add Soda Cloud if you want collaboration, alert routing, and team workflows. That split is useful when engineering wants control first and a broader operating model later.
The checks-as-code approach is the main attraction. For analytics engineers and platform teams that already live in Git, YAML, and CI, Soda feels natural. You can express known expectations directly and keep them close to the transformation logic.
What works well
Soda is a good reminder that observability and validation are not the same thing, even when buyers blur them together. The strongest Soda setups usually pair metric monitoring with explicit tests for business rules. That's why the OSS plus managed cloud model works. It supports local control while still giving non-engineering stakeholders a place to see incidents and collaborate.
A few practical trade-offs stand out:
Open-source flexibility: You can get started without immediate platform lock-in.
Good team handoff: Soda Cloud adds a friendlier workspace for triage and assignments.
Cloud upsell path: Advanced workflows often sit behind the managed product.
Custom pricing: Cost transparency drops once you move beyond the open-source starting point.
For teams that want code-first adoption and don't mind layering capabilities over time, Soda remains one of the most pragmatic choices.
5. Anomalo
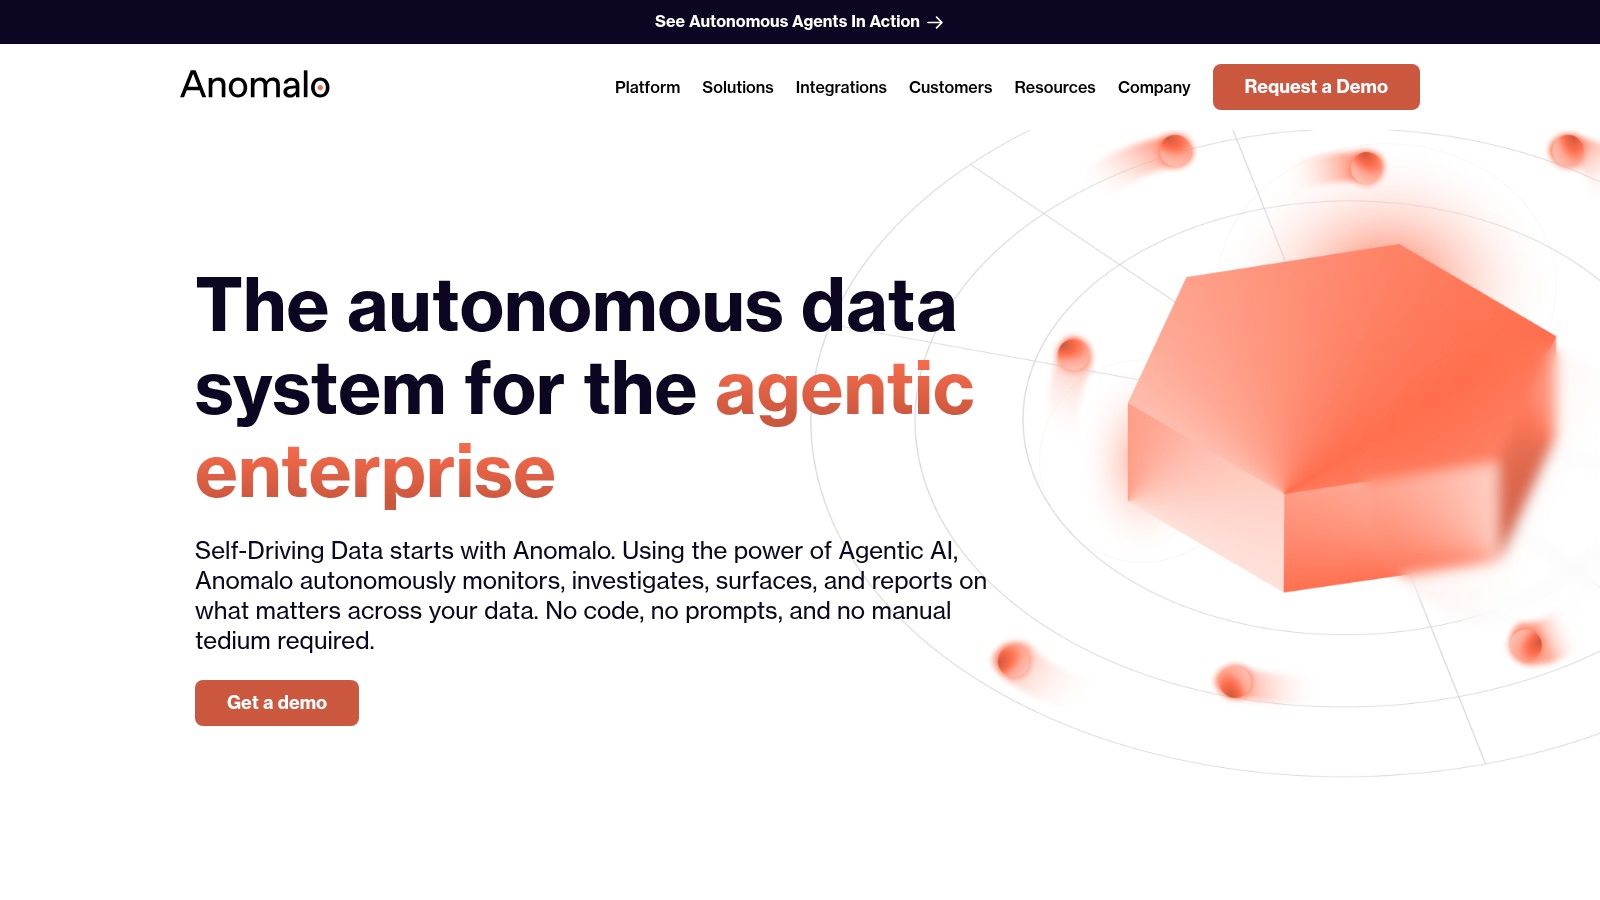
Anomalo leans hard into automated monitoring and AI-assisted setup. That makes it attractive to teams that want coverage fast without writing a large library of thresholds and rules upfront. It's particularly credible for Databricks-heavy environments, where blueprint-driven rollout can matter more than generic flexibility.
The product framing is straightforward: profile tables, learn normal behavior, surface unusual change, and attach enough context that engineers can act. That's often the right model for organizations with too many assets to hand-tune every monitor.
Where Anomalo makes sense
Anomalo is strongest when speed-to-coverage matters more than deep customization on day one. If your biggest pain is “we don't know what's breaking until the business tells us,” broad automatic profiling can be a better first move than a long rules program.
The caution is procurement realism. Pricing isn't public, and AI-heavy positioning can hide cost variability until you get into a real enterprise quote. I'd validate not just feature fit, but how predictable the commercial model remains as monitored scope expands. That isn't unique to Anomalo, but it matters here.
6. Acceldata

Acceldata takes a broader view than most pure-play data observability tools. It tries to cover pipeline health, data quality, drift, lineage, and operational cost in one platform. That breadth is useful when your real problem isn't only bad data, but also expensive data movement, underperforming jobs, and fragmented ownership across platform teams.
This is one of the few options where FinOps belongs in the buying discussion. If your leadership wants a single place to look at reliability and cost, Acceldata is easier to justify than stitching together three tools and hoping the handoffs work.
Why teams choose it
The strongest Acceldata case is tool sprawl reduction. Instead of one product for pipeline performance, another for quality checks, and another for cost views, you centralize more of the operating model.
That comes with an obvious trade-off. A broad platform usually needs thoughtful onboarding, stronger ownership, and clearer internal process to realize full value.
The wider the scope of the observability platform, the more important your operating model becomes. Broad coverage doesn't help if nobody owns remediation.
Acceldata publishes plan tiers for its Data Observability Cloud, which gives buyers at least some transparency before a sales call. That's a small but meaningful advantage in a market where pricing often disappears behind demo forms.
7. IBM Databand (IBM Data Observability by Databand)
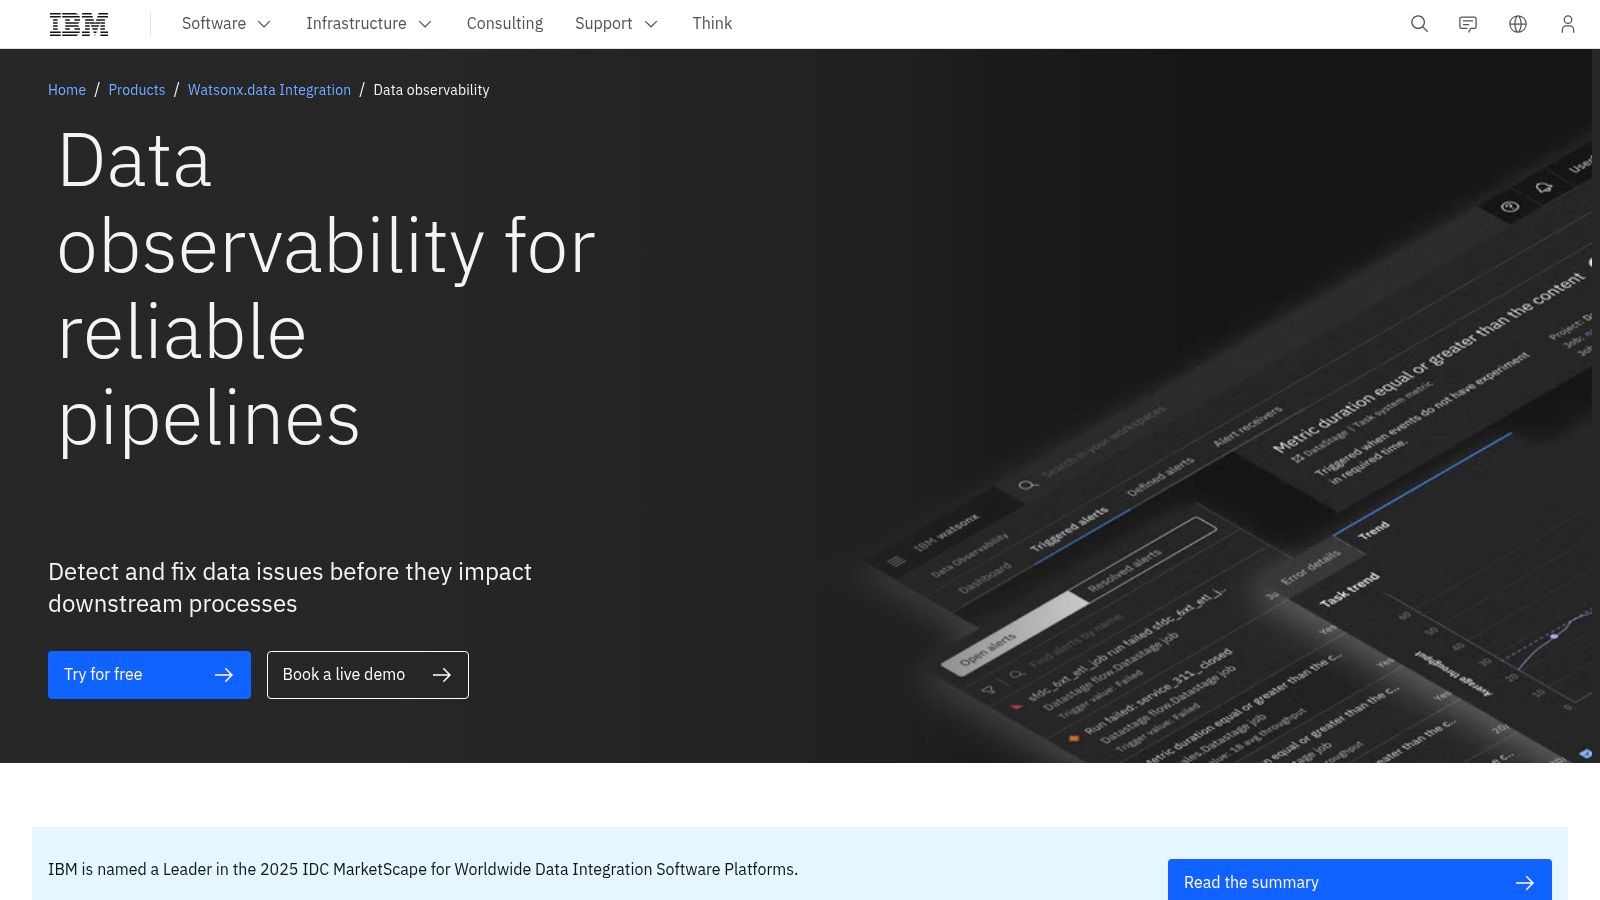
IBM Databand is a sensible shortlist option when your data reliability effort is tightly tied to pipeline operations. It monitors runs, tasks, datasets, and SLAs, then layers in anomaly detection, alerting, and incident triage. In other words, it speaks the language of orchestration teams as much as data quality teams.
That matters because many data incidents begin as workflow and timing failures, not just bad values in a table. Databand's warehouse and pipeline orientation makes it useful when the question is “what broke in the execution path?” before “what drifted statistically?”
Practical buying signal
Self-hosted deployment is one reason IBM Databand deserves attention from larger enterprises. Plenty of vendor comparisons still underplay deployment boundaries, even though some organizations cannot adopt a fully vendor-managed SaaS pattern.
IBM's ecosystem is also part of the value. If you already use IBM tooling or want integration paths into watsonx.data and enterprise schedulers, Databand becomes easier to operationalize. The cost is buying friction. Expect demos, quotes, and a more formal procurement process than you'd get from developer-led tools.
8. Metaplane
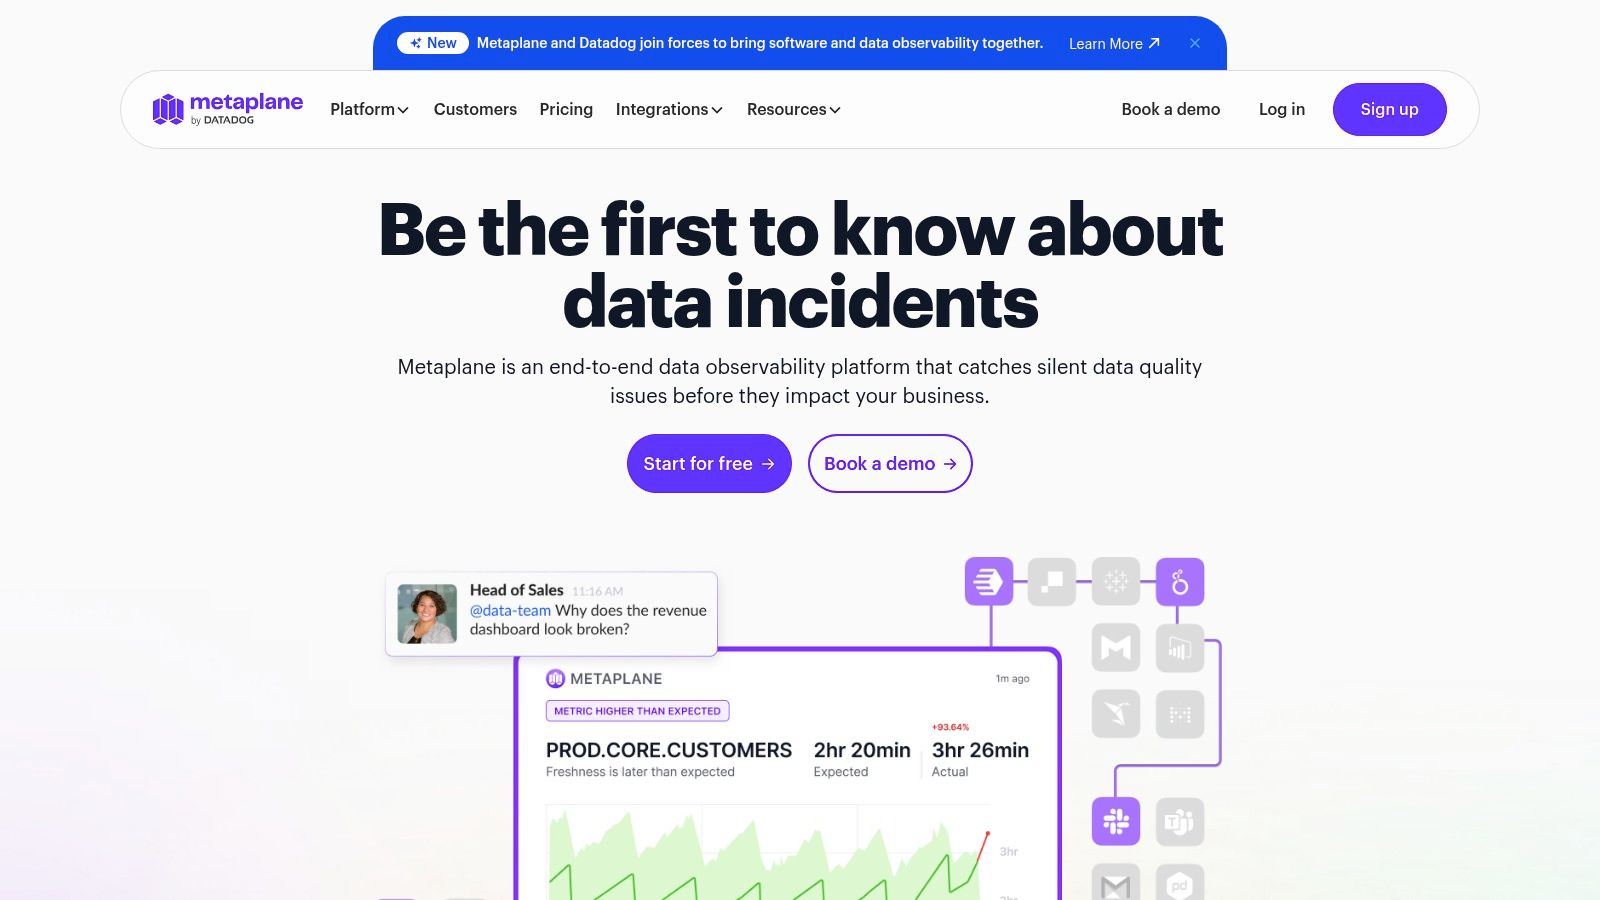
Metaplane stands out because the pricing model is easier to understand than most enterprise observability products. For smaller and mid-sized teams, that alone changes the buying motion. You can estimate cost, start with a free tier, and scale monitored tables without a large negotiation upfront.
The product is also built for modern data stack ergonomics. Freshness, volume, distribution, uniqueness, nullness, schema checks, custom SQL, dbt monitoring, and CI-oriented workflows make sense for teams that want observability embedded into day-to-day analytics engineering.
What to watch
Transparent pricing makes Metaplane a strong early choice, but it doesn't erase enterprise constraints. Advanced governance and security controls are stronger in the Enterprise plan, so regulated buyers still need to inspect the upper tier carefully.
There's also a market context worth remembering. Ramp's vendor analysis shows mid-market observability adoption is still led by broader infrastructure tools such as Sentry and Datadog, while pure data observability vendors remain earlier in their adoption curve (mid-market observability vendor adoption). That's one reason Metaplane works well as an accessible start. It meets teams where they are instead of assuming they already run a formal enterprise reliability program.
9. Kensu
Kensu fits a different buying scenario than warehouse-first observability tools. A team ships data through APIs, Python jobs, Spark pipelines, and internal applications, then spends hours tracing where a bad field was introduced. Kensu is built for that problem. Its agent-based approach gives you observability inside the flow of data, not only after the data lands in a warehouse.
That design has real trade-offs. You get finer-grained lineage and runtime visibility across application code and data movement, but you also take on instrumentation work. Engineering involvement is part of the operating model, so Kensu makes more sense for organizations that already treat data reliability as an engineering concern, not just an analytics concern.
Deployment is the story
Kensu is a serious option for enterprises running hybrid, multi-cloud, or on-prem estates where privacy and residency rules shape the shortlist before feature comparison starts. In those environments, the deployment model is one of the nine criteria that matters as much as anomaly detection or alerting. A polished SaaS experience is less useful if sensitive data paths cannot leave a controlled environment.
That is where Kensu earns its place in this list. It is better suited to buyers who need to inspect how observability is deployed, what metadata is collected, and how closely the product can align with internal security boundaries. For teams comparing tools through an enterprise-readiness lens, that distinction matters more than a long feature grid.
10. Lightup

Lightup earns its place because it spans both classic structured-data monitoring and newer GenAI-oriented quality needs. Not every team needs that today, but more teams are being asked to monitor unstructured data and AI-adjacent workflows with the same seriousness they apply to warehouse tables.
The platform combines prebuilt indicators, multi-column checks, custom rules, AI-based anomaly detection, incident workflows, and governance controls. Hybrid deployment for enterprise customers also makes it more relevant than cloud-only tools for sensitive environments.
Why it earns a spot
Lightup is one of the clearer examples of the category moving toward unified platforms. Buyers increasingly want anomaly detection, rule-based validation, and governance features in one operating surface instead of separate products stitched together by process.
That aligns with how anomaly detection itself is typically implemented. Common statistical approaches include Z-Score and Interquartile Range, where Z-Score identifies outliers by measuring distance from the mean and IQR highlights anomalies outside the middle spread of a dataset (anomaly detection methods in data quality monitoring). For teams evaluating vendor AI claims, the useful question isn't whether a platform says “ML-powered.” It's whether the detection quality is measurable and tunable for your workload.
Top 10 Data Observability Tools, Feature Comparison
Product | Core capabilities & quality | Unique selling points | Deployment & privacy | Target audience | Pricing & value |
|---|---|---|---|---|---|
digna | AI anomaly detection, historical analytics, timeliness, validation, schema tracker ★★★★ | ✨ In‑database execution + baseline learning; 🏆 no vendor access to production data | 👥 Private cloud / on‑prem, data stays in customer infra | 👥 Data engineers, analytics, ML teams, enterprise warehouses | 💰 Quote-based; fast time‑to‑value (install→insights <2h) |
Monte Carlo | End‑to‑end observability, column lineage, incident workflows ★★★★★ | ✨ Circuit Breakers & Agent Trust; 🏆 category pioneer | Cloud‑first integrations; enterprise SaaS focus | 👥 Large enterprises, platform teams, BI/ML owners | 💰 Sales‑led; cost scales with scope |
Bigeye | Automated monitoring (freshness, volume, schema), lineage, security ★★★★ | ✨ Agentless read‑only option; strong security posture | Agentless or hybrid; enterprise security controls | 👥 Regulated industries & enterprise data teams | 💰 Sales‑led; enterprise positioning |
Soda (Core + Cloud) | Metric monitoring, checks‑as‑code, alerts, collaboration ★★★★ | ✨ Open‑source Soda Core + managed Cloud workflow | OSS local + SaaS Cloud for teams (mixed privacy) | 👥 Devs & teams wanting OSS + managed UI | 💰 OSS free; Cloud = custom pricing |
Anomalo | Automated profiling, anomaly detection, validation, lineage ★★★★ | ✨ Agentic assistants (AIDA) & Databricks blueprints | SaaS / enterprise integrations; fast setup claims | 👥 Databricks users, analytics teams | 💰 Sales‑led; enterprise quotes |
Acceldata | Data & AI observability + pipeline infra + FinOps ★★★★ | ✨ Unified infra + cost + data views; metadata‑first | Cloud & enterprise deployments; scalable arch | 👥 Ops + data platform teams needing cost & reliability | 💰 Published tiers for ADOC; Pro/Enterprise quoted |
IBM Databand | Pipeline/run monitoring, dataset validations, lineage ★★★ | ✨ IBM ecosystem integration (watsonx), self‑learning detection | SaaS & self‑hosted options; enterprise procurement | 👥 Large enterprises, IBM customers, orchestration users | 💰 Sales‑led enterprise pricing |
Metaplane | Freshness, distribution, schema, lineage, Data CI/CD ★★★★ | ✨ Transparent usage pricing, free tier, fast setup | SaaS with broad connectors; Snowflake billing option | 👥 Modern data stack teams, startups scaling data ops | 💰 Pay‑as‑you‑grow; free tier available |
Kensu | In‑app agent observability, runtime lineage, profiling ★★★ | ✨ Edge/in‑code instrumentation for data in motion | Agent model; strong on‑prem & hybrid support | 👥 Regulated orgs, embedded apps, hybrid infra | 💰 Sales‑led; quotes required |
Lightup | AI anomaly detection, incident correlation, GenAI data checks ★★★★ | ✨ Structured + unstructured QA; BYO anomaly models; GenAI integrations | Cloud & hybrid (Enterprise); catalog/ITSM integrations | 👥 Teams with GenAI pipelines & enterprise governance | 💰 Annual subscription; quote‑based |
Decision Guide: Choosing Your Data Observability Tool
A failed dashboard refresh at 7:30 a.m. usually looks like a pipeline problem at first. By 9:00, the underlying issue may turn out to be a schema change, a delayed upstream table, or a bad business rule that no anomaly detector would have caught on its own. That is why choosing a data observability tool is not just a feature comparison. It is an operating model decision.
The strongest teams evaluate these products against rollout risk, not just demo quality. Fast SaaS setup matters. So do code-first workflows. But for enterprise buyers, deployment model, privacy controls, and security review often decide the shortlist before anyone scores the anomaly charts. A tool that looks strong in a trial can still fail procurement if it requires broad vendor access to production data or cannot run within your cloud boundary.
The nine criteria in this guide help separate those cases:
Anomaly detection quality: Does the system learn normal behavior well enough to cut alert noise and reduce threshold tuning?
Validation depth: Can teams enforce explicit business rules at the row, table, and pipeline level?
Timeliness coverage: Will it catch stale datasets, missed SLAs, and delayed deliveries before downstream users act on bad assumptions?
Schema monitoring: Does it detect structural changes early enough to protect models, dashboards, and dependent jobs?
Lineage context: Can engineers trace impact and root cause without reconstructing dependencies by hand?
Deployment model: Is the product SaaS-only, or can it run in private cloud, hybrid, or on-prem environments?
Privacy posture: Does the architecture keep sensitive data in your environment, or does metadata and sample data leave it?
Scalability: Can it support large warehouses, lakehouse patterns, and complex orchestration without adding another system to maintain?
Pricing clarity: Can the team estimate cost before usage grows across domains and environments?
AI claims need the same discipline. The useful question is whether detection quality holds up against your data patterns, your tolerance for false positives, and your incident process. Teams that want a more rigorous test framework can review common anomaly detection metrics such as precision, recall, F1-score, and AUC-ROC in this explanation of anomaly detection evaluation metrics.
Tool choice usually gets narrower in regulated environments. Private cloud support, in-database execution, and restricted data movement stop being secondary concerns and become selection criteria. That is one reason digna deserves a close look in enterprise evaluations. As noted earlier, its approach centers on running analysis inside the customer environment while covering anomaly detection, timeliness, schema monitoring, historical analysis, and record-level validation in one platform.
That design has a practical upside. Teams do not have to split observability and privacy requirements across separate products, and security review is easier when production data stays under internal control.
If your team needs data observability without sending production data to a vendor-managed environment, book a digna demo and evaluate the platform against your actual deployment, privacy, and validation requirements.
Frequently asked questions
What are data observability tools?
They monitor how data and pipelines behave over time, tracking freshness, volume, distribution, schema and lineage, and alerting when behaviour departs from the learned norm. They are designed to catch the failures that pass every explicit test.
What are the five pillars of data observability?
Freshness, whether data arrived when expected; volume, whether the amount is normal; distribution, whether values look like they usually do; schema, whether structure changed; and lineage, which connects a problem to its source and its downstream consumers.
How do you choose a data observability tool?
Decide first whether checks must run inside your database for governance reasons, since that rules several options in or out immediately. Then test detection against a real incident you have had, and examine how a finding routes to an owner.
Do observability tools replace data quality rules?
No. Observability detects unexpected behaviour; rules enforce known business constraints. A rule can state that an amount must never be negative, which no amount of behavioural learning will infer. The two layers are complementary and most teams run both.
Why do pipeline success alerts miss data problems?
Because they report on job execution, not on data meaning. The warehouse job ran, the dashboard loaded, and nobody was paged, yet revenue was wrong for hours because an upstream source changed shape. Only monitoring the data itself surfaces that.


