Automated Data Profiling for Reliable Platforms
|
7
min read

The dashboard still loads. The overnight jobs finished, and nobody has reported an error. Then a business analyst notices that a familiar customer category has almost disappeared from the underlying table. Your checks are green because they test whether the pipeline ran, not whether the data still behaves as expected.
Table of Contents
Why Manual Data Profiling Breaks at Scale
Consider a social-insurance warehouse where engineers maintain a large collection of hand-written checks. Some validate benefit records, others check delivery dates, and others enforce assumptions inherited from retired systems. This is an illustrative operating pattern, not a documented customer case.
Each check may have been sensible when someone wrote it. The difficulty is preserving its meaning as source systems, reporting requirements, and team ownership change.
An engineer leaves, but their SQL remains. A new feed arrives, and the team copies an existing rule set without knowing which assumptions apply. Analysts add checks after incidents, while obsolete checks continue producing alerts.
Rule coverage isn't data understanding
A static rule set answers questions someone already knew to ask. It doesn't necessarily reveal an unfamiliar category, a changed distribution, or a field whose apparent meaning differs from its name.
The operational symptoms are recognizable:
Partial coverage: Important tables have checks, but those checks cover selected failure modes rather than the table's observed behavior.
Unclear ownership: Engineers can locate the rule without finding anyone who can explain its business purpose.
Alert fatigue: Reviewers repeatedly encounter low-value notifications and become less likely to investigate the next one.
These are useful ways to frame operational data issues: not as bad values, but as gaps between what teams measure and what downstream users need.
Discover before prescribing
Automated data profiling starts with a different question: what is actually present in this dataset? It turns an unfamiliar table into a measurable object before analysts, statistical tools, or models depend on it.
That doesn't eliminate business rules. It reduces the amount of exploratory SQL engineers must write before they can decide which rules are justified.
Practical rule: Keep explicit business requirements, but don't make engineers anticipate every observable change before monitoring can begin.
The architectural choice matters too. For sensitive enterprise data, my recommendation is to learn and maintain those measurements inside the customer's environment. Discovery shouldn't require exporting production records to a hosted scanner.
The useful outcome isn't a larger inventory of checks. It's a maintained baseline, an accountable reviewer, and evidence that helps someone distinguish a meaningful change from routine variation.
What Automated Data Profiling Actually Measures
Start with an unknown warehouse table. You can read its schema, but the declared types won't tell you whether fields are populated, identifiers repeat, or text values follow consistent patterns.
The foundational paper Data Profiling Revisited, published in 2013, describes profiling as examining data characteristics such as column types, null-value counts, distinct-value counts, and frequent patterns. It also explains how profiling supports constraint checking and the configuration of later statistical or data-mining tools.
Learn the observable shape
Think of a profile as a building's floor plan and occupancy count. It describes the rooms and where people are, but it doesn't explain why they entered the building.
Similarly, a profile can show that a status column contains unfamiliar values. It can't establish whether those values represent an approved business change.

An initial inspection should establish:
Structure: Which columns exist and what data types their values support.
Population: Where values are missing and how many distinct values appear.
Shape: Which ranges, repeated formats, and frequently occurring values characterize the table.
These measurements give engineers a starting point for discovery. A date-like text field may deserve closer inspection; a frequently repeated customer identifier may be expected in transactions but suspicious in a customer master.
Store evidence, not just a report
The core measurements, completeness, uniqueness, type conformity, frequency, and distribution, apply across relational databases, warehouses, lakes, and analytical files. Storage technology changes the execution method, not the questions being asked.
Keep the resulting profile as a reference for subsequent observations. Record the source and conditions under which it was produced, rather than preserving only a chart that someone can't reproduce later.
For teams formalizing that traceability, Fetchin's guide to data provenance is a useful companion resource. Provenance belongs alongside the statistical output because reviewers need to understand where the evidence came from.
The practical boundary is important: observed behavior isn't automatically correct behavior. Profiling supplies evidence for a decision, not permission to convert every common pattern into an enforced requirement.
Profiling Techniques and Quality Metrics
A mature profiler needs more than a missing-value counter. In a systematic evaluation of 13 data-quality tools, basic profiling was widely supported, while advanced dependency and multi-column capabilities appeared only in isolated tools, as described in the Frontiers evaluation of data-quality tooling.
Match evidence to the question
Organize collection around these evidence classes:
Evidence class | Useful calculations and interpretation |
|---|---|
Single-column cardinalities | Distinct and duplicate counts reveal repetition and possible uniqueness. |
Value distributions | Quantiles, frequency histograms, and outlier rates describe concentration and spread. |
Data types and patterns | Inferred semantic types and format regularities distinguish storage representation from likely meaning. |
Domains | Observed value sets suggest candidate allowed values for review. |
Inter-column and multi-column relationships | Candidate keys and functional dependencies reveal possible integrity constraints. |
Include null and blank rates explicitly. An empty string and a database null may need different treatment, so document any decision to merge them.

Balance coverage against scan cost
Version measurements by table, column, partition, and observation time. Otherwise, reviewers can't reliably distinguish a persistent distribution shift from an isolated partition problem.
Exact distinct counts and exhaustive pairwise dependency tests can be expensive on large datasets. Approximate sketches, stratified samples, and incremental profiles are reasonable alternatives, but validate approximations against exact calculations on critical datasets.
The choice should follow the consequence of error. Exploratory discovery can tolerate uncertainty that a regulatory integrity check cannot.
The Queensland Health data-management policy includes accuracy, validity, reliability, timeliness, relevance, completeness, and uniqueness within its quality scope. That breadth is a useful corrective when selecting data-quality metrics: easy-to-compute statistics shouldn't define the entire program.
Convert findings into controls
An approved inferred domain can become a validation rule. A confirmed candidate key can become an integrity check, while a distribution baseline can supply anomaly-detection inputs.
Business reconciliation still requires domain logic. For example, teams that match bank entries with accounting records through Charter AI are addressing a business-level matching task, not merely counting distinct transaction references.
Keep that distinction clear. Profiling helps identify what deserves a control; business owners determine what that control must mean.
When More Profiles Create More Noise
Collecting every available statistic doesn't automatically improve decisions. If nobody can explain which deviations matter, engineers have automated notification production rather than reliable monitoring.
Normal behavior may differ by weekday, month-end, season, release cycle, or business event. Comparing every load with an undifferentiated historical average can make an expected change look defective.
Separate missing data from wrong data
The UK Government Data Quality Framework distinguishes completeness from accuracy. A dataset can contain all expected records and still contain incorrect values.
Measure row presence, field-level missingness, and value correctness separately. If a delivery hasn't finished, an apparent completeness problem may require pipeline investigation rather than record remediation.
A metric change is an observation. Calling it a defect requires context.
The 2025 findings collected in Atlan's State of Enterprise Data and AI illustrate that context problem: 97% of organizations reported gaps involving definitions, quality, and trust, while 52% cited security and sensitive-data access concerns. The same resource reports that executives rated organizational data maturity 12% higher than practitioners, while nearly 90% of data professionals struggled with scaling and complexity.
Those findings support a cautious operating stance: don't assume that additional measurements resolve disagreements about meaning or readiness.

Put time and impact into triage
Use time-aware baselines and adaptive thresholds where expected behavior varies. Review false positives explicitly, recording whether an alert led to a confirmed defect, an accepted business change, or an investigation with insufficient evidence.
Expected-arrival modeling helps distinguish incomplete observation windows from completed loads. Lineage-aware triage should connect the deviation with delivery delays, schema changes, and the downstream reports or models at risk.
Present those relationships in data-quality dashboards, rather than showing an unexplained red indicator. A reviewer should see what changed, who owns it, and what action is available.
AI readiness requires more than statistical normality. Without semantic definitions, ownership, and a remediation path, a technically detailed profile doesn't establish trustworthy training or operational data.
How to Choose In-Database Profiling
For sensitive enterprise workloads, make customer-controlled execution a design requirement. Decide where queries run, which identity executes them, and what evidence can leave before comparing interface features.
A 2025 enterprise AI survey reported by CIO Dive covered 1,050 business leaders and identified privacy and compliance constraints, duplicates, and inefficient integration among leading data problems. Fewer than half believed their AI goals were attainable.
Where Automated Profiling Should Run
Decision question | In-database in the customer environment | Externally hosted scan |
|---|---|---|
Where are values examined? | Inside the controlled database boundary. | In the hosted scanning environment if records are transferred there. |
What may leave? | Define an explicit policy for calculated metrics and metadata. | Assess exported records, retained samples, and derived metadata. |
Whose access applies? | Use a dedicated, least-privileged execution identity. | Review connector permissions and the hosted service's access model. |
How is load managed? | Schedule queries against database capacity. | Account for extraction workload, transfer, and external processing. |
What must be audited? | Database execution plus profiling decisions. | Extraction, external access, retention, and profiling decisions. |
A hosted control plane isn't necessarily a hosted scanner. Ask specifically where records are processed rather than relying on a deployment label.
Test the authorized view
Can the work stay inside a bank, hospital, telecom, or public-sector environment? Which metadata may leave, and who approves that decision?
Test encrypted, masked, tokenized, and row-level-authorized inputs separately. A changed tokenization policy or restricted row view mustn't be misclassified as a source-data defect; the profiler can only describe the representation its identity is authorized to observe.
Require audit evidence for scope, identity, timestamp, rule version, access decision, and remediation history. In-database execution doesn't remove the need for access controls or resource management.
An in-environment option
digna's in-database processing is one option for this execution pattern. Checks and metric computation stay in the customer database, deployment is private cloud or on-premises, and the vendor doesn't access production data.
Its modules cover learned anomaly baselines without hand-building every check, historical metric trends, expected delivery time, record-level validation, and added, removed, or retyped columns. The initial module includes a shared dashboard, scheduler, catalog, integrations, and collaboration.
The commercial model is a base fee plus a charge per active table per module, without API-call, scan, or alert-volume fees. The publisher describes initial insights as available in under two hours; treat that as an onboarding claim to verify against your connectivity, permissions, and workload during evaluation.
Enterprise Workflows for Profiling and Monitoring
Begin with a reference profile, not an empty rule editor. In a peer-reviewed 2022 study of reference-profile monitoring, researchers implemented DQ-MeeRKat and evaluated it on six real-world telematic-device data streams.
The method automatically learned collections of profiling statistics to model target quality. It supported initialization through continuous monitoring without requiring domain experts to write every rule beforehand.
Route each observation to the right review
Initialize the reference, ask a domain expert to assess its suitability, and compare incoming loads with the approved version. Keep the comparison and the operational response connected.
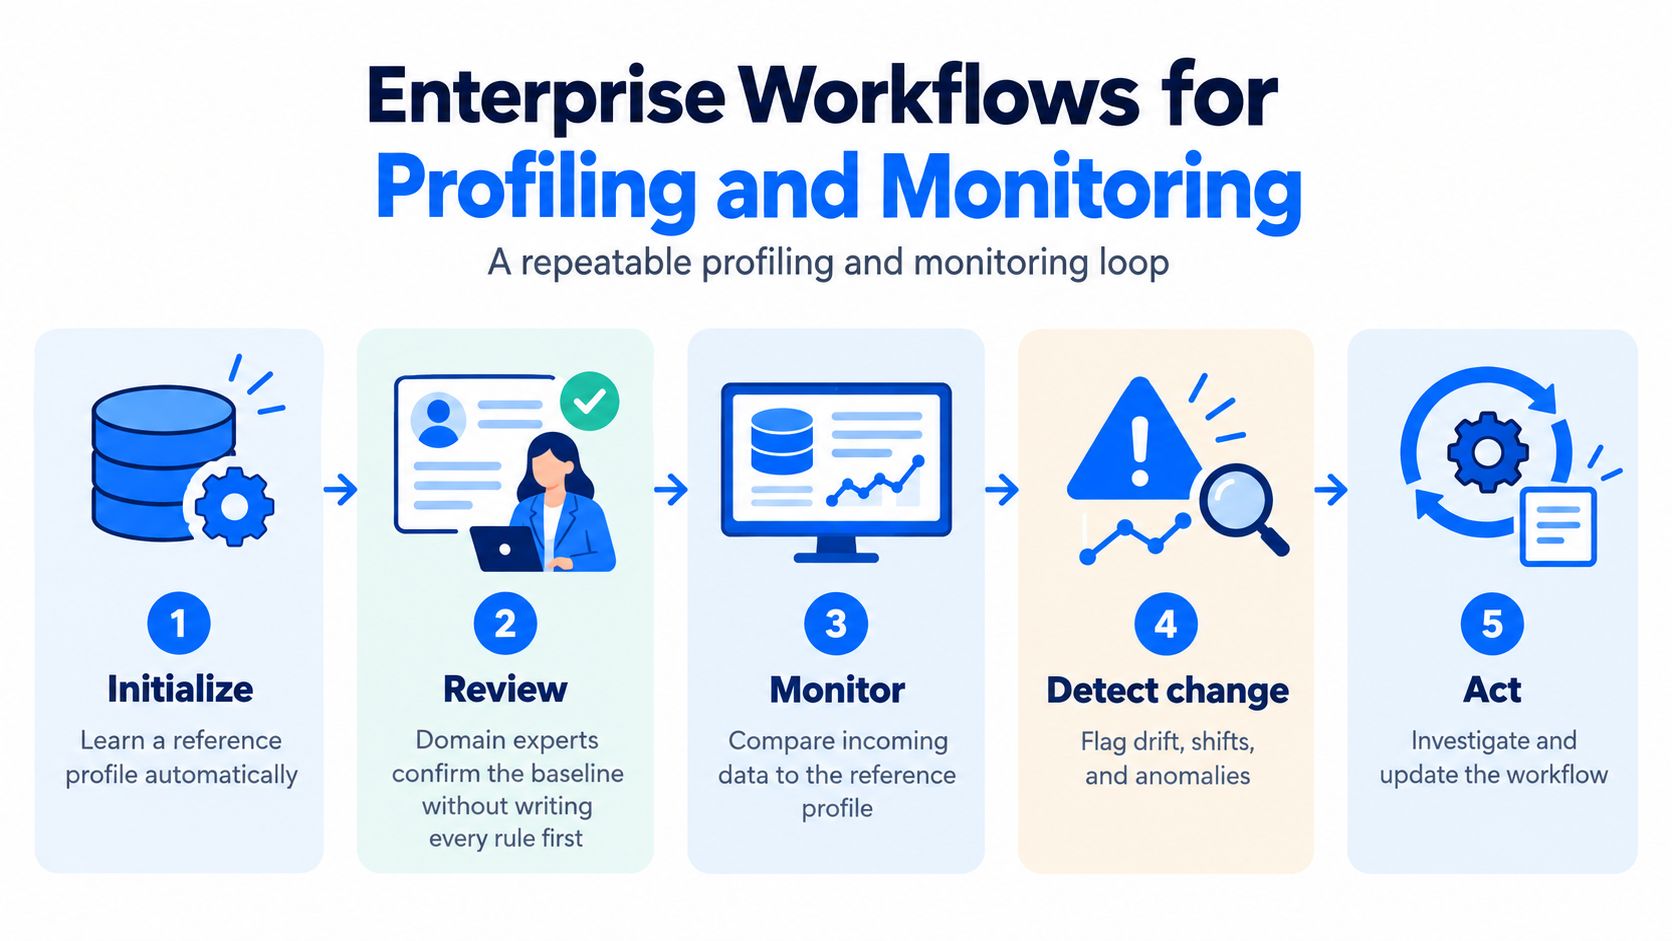
Use distinct handoffs rather than sending every observation to the same queue:
Distribution deviation: Assign anomaly review to determine whether the business changed or the pipeline introduced a defect.
Missing or early delivery: Route to timeliness review with the expected delivery time and actual arrival evidence.
Suspected business-rule failure: Run record-level validation to identify the affected records.
Added, removed, or retyped columns: Open schema review before dependent transformations proceed.
Industry requirements determine escalation. In financial services, prioritize risk and regulatory feeds before reporting; in healthcare, distinguish clinical and operational delivery needs.
Telecommunications teams should connect high-volume customer-data deviations with pipeline delay. Public-sector teams should preserve traceable decisions and audit-ready evidence.
Keep uncertainty visible
Missing values can produce false functional dependencies. Research on automated schema and dependency discovery also reports an evaluation in which exact-and-complete generated schemata increased from 60% to 72% when the system returned the top five candidates rather than a single result.
That supports ranked hypotheses, confidence scores, and human approval, not automatic acceptance of whichever answer appears first. Reviewers need to see plausible alternatives when names, types, keys, or relationships are uncertain.
Approval boundary: Let automation propose the interpretation. Make an accountable person approve consequential constraints.
An integrated platform can host this flow without becoming the owner of business meaning. Establish monitoring and reporting responsibilities so engineers handle execution, domain owners assess meaning, and governance reviewers can reconstruct decisions.
Close an incident only when someone records the cause, action, and baseline decision. An accepted business change may justify updating the reference; a pipeline defect should not be absorbed into normal behavior.
Start Automated Data Profiling on Critical Tables
Choose a critical table whose failure would break a report, model, or regulatory output. Prefer a table with an identifiable business owner and an engineer who understands its delivery path.
Write down the decision it supports and what failure would mean. That gives reviewers a concrete basis for prioritizing findings instead of treating every deviation as equally urgent.
Define the first operating boundary
Profile the table in place and preserve the evidence needed to repeat the inspection. Keep the snapshot, source query or sampling policy, algorithm version, confidence, and approval decision together.
Don't promote a low-confidence key, type, or dependency directly into production enforcement. Have the owner explain whether the proposed constraint reflects a requirement or merely a pattern in the observed sample.

Make the review repeatable
Give the pilot a small, explicit operating agreement:
Name the reviewers: Assign the data engineer and business owner before enabling notifications.
Define the response: Specify who investigates an observation and who can approve a baseline change.
Protect downstream use: Decide which schema changes require review before dependent jobs consume the table.
Retain the outcome: Record whether the incident was a delivery problem, defective data, or an accepted change.
Compare each new load with the approved reference. Separate late arrival from genuine distribution change, and investigate structural changes before treating them as harmless.
Review the first explainable incident together. The engineer should be able to show what happened in the pipeline, while the business owner should be able to describe the consequence for the consuming process.
Expand module by module only after that loop works. More coverage is useful when the team can investigate and act, not just when it can generate more observations.
For a bounded rollout, install the platform inside the existing cloud, VPC, or data center, inspect the selected table, and review anomalies, timeliness, and schema status in the shared dashboard. Keep that review narrow enough that the team can make and document a decision.
digna offers in-environment baseline learning, anomaly monitoring, timeliness checks, record validation, and schema tracking for this operating model. Visit digna to evaluate the platform on a critical table, then review the initial findings with your data engineer and business owner before expanding coverage.
Once a reference profile exists, the next step is keeping it current without writing a rule for every column: digna's Data Anomalies module learns each table's normal volumes, distributions, and null rates and flags deviations as new loads arrive, so the baseline becomes continuous detection rather than a one-off report.
Frequently asked questions
What is automated data profiling?
Automated data profiling is the systematic measurement of what a dataset actually contains - column types, null counts, distinct values, frequent patterns, ranges, and distributions - before analysts or models depend on it. The result is a stored baseline that later loads are compared against, instead of a one-off report nobody can reproduce.
Why do hand-written data quality rules stop working at scale?
Static rules only answer questions someone already thought to ask. As sources, reports, and owners change, teams end up with partial coverage, SQL nobody can explain after its author leaves, and alert fatigue from obsolete checks, while unfamiliar categories or shifted distributions pass unnoticed because no rule was written for them.
Which metrics should a data profile include?
A useful profile covers completeness, uniqueness, type conformity, frequency, and distribution, plus explicit null and blank rates, since an empty string and a database null may need different treatment. Mature profilers add domains, candidate keys, and functional dependencies, versioned by table, column, partition, and observation time.
How can I reduce false alerts from data profiling?
Use time-aware baselines and adaptive thresholds, because normal behaviour differs by weekday, month-end, season, or release cycle. Separate missing data from wrong data, model expected arrival so incomplete loads are not flagged as defects, and record whether each alert led to a confirmed defect, an accepted change, or an inconclusive investigation.
Should data profiling run inside the database or in a hosted scanner?
For sensitive enterprise data, running profiling in-database inside the customer environment is the safer default. Values stay within the controlled boundary, a least-privileged identity executes the queries, and only calculated metrics leave under an explicit policy, whereas an external scanner requires assessing exported records, retained samples, and connector permissions.