10 Observability Best Practices for Data Platforms in 2026
|
7
min read

Beyond Dashboards: Why Data Platforms Demand Deeper Vision
The CEO's most critical dashboard is showing last week's numbers. An ML model just produced nonsensical predictions. A compliance audit is looming. None of that looks like a classic application outage, yet each problem can trace back to data that arrived late, drifted subtly, changed shape, or violated a business rule without anyone noticing.
That's where many teams get stuck. Traditional monitoring is built to tell you whether systems are up, whether jobs ran, or whether infrastructure crossed a threshold. It's much less effective at telling you whether the data inside those systems is still trustworthy. Silent null spikes, delayed loads, malformed records, and schema edits don't always trigger obvious operational alarms, but they still break forecasts, dashboards, and decisions.
Good observability best practices for data platforms start from a different premise. You're not trying to watch everything. You're trying to ask better questions about reliability, freshness, structure, and meaning, then collect the right signals to answer them. In 2026, universal adoption of OpenTelemetry is recognized as a critical best practice for observability because it supports vendor-neutral instrumentation and standardized telemetry collection across distributed systems, while strong observability also depends on high-cardinality and high-dimensionality data plus clear SLOs defined before collection begins, according to Motadata's observability best practices overview.
For data platforms, that foundation has to go further. You need anomaly detection, in-database execution, privacy-first governance, and interfaces that business users can work with. If you're trying to sharpen that operating model, these digital product performance insights connect well with the same reliability mindset.
Table of Contents
1. Implement AI-Powered Anomaly Detection with Baseline Learning
2. Execute Observability Computations In-Database to Reduce Data Movement
4. Implement Record-Level Data Validation Rules for Business Logic Enforcement
5. Track and Alert on Schema Changes and Structural Modifications
6. Analyze Historical Observability Metrics to Surface Trends and Patterns
7. Establish Unified Observability Dashboards Accessible to Multiple Stakeholder Groups
8. Enforce Data Governance Through Private Cloud and On-Premises Deployment
9. Integrate Observability Across Data Warehouses, Lakes, and Pipeline Ecosystems
10. Reduce Specialist Overhead by Operationalizing Observability for Business Users
1. Implement AI-Powered Anomaly Detection with Baseline Learning
Static thresholds fail fast in real data environments. A payment dataset behaves differently on payroll days than it does midweek. Hospital admissions shift by season and by local events. Inventory feeds swing around promotions. If you hard-code limits for every one of those patterns, you spend your time tuning alerts instead of investigating the few signals that matter.
AI-powered anomaly detection works better because it learns expected behavior from history and dynamically defines boundaries for volume, value distributions, and logical relationships, adapting to time-of-day and seasonal patterns rather than forcing teams to maintain manual thresholds, as described in digna's overview of data anomalies. That's the right fit for high-volume platforms where subtle drift is often more dangerous than obvious failure.
Why baseline learning beats static thresholds
A useful anomaly system doesn't just say “something changed.” It gives enough context to decide whether the issue belongs with data engineering, analytics engineering, or the business owner of the dataset. That's why I prefer models that score anomalies at the dataset and column level, then let stewards validate whether the change is expected or harmful.
Use it to prioritize, not to auto-remediate everything. If a financial institution sees an unusual transaction distribution, the fraud team and the platform team may both need to look, but they need different context. The same applies in healthcare when admission patterns move unexpectedly, or in e-commerce when inventory counts drift because a pipeline duplicated records upstream.
Practical rule: Let baseline learning settle before you treat anomaly scores as operational truth. Teams that skip this step usually confuse normal seasonality with incidents.
A few practices help:
Pair scores with ownership: Route column-level anomalies to the steward or engineer who understands that field's business meaning.
Tune for risk tolerance: A finance platform may want tighter sensitivity than an internal marketing mart.
Review pattern changes, not just incidents: A persistent shift can signal a source-system redesign, not a one-off defect.
If you want a concrete example of how learned baselines work in time-series monitoring, this guide to detecting anomalies in time series is a useful reference. The same logic also matters in adjacent use cases such as ethical internal threat prevention, where unusual patterns need context before teams act.
2. Execute Observability Computations In-Database to Reduce Data Movement
If your observability architecture starts by exporting large volumes of warehouse data to another platform, you've already created a governance and cost problem. That model can work for application traces. It becomes much harder when the signal you need sits inside customer-controlled databases, regulated environments, or very large analytical stores.
The gap is especially obvious in hybrid environments. The AWS observability best practices guide notes an underserved challenge around the cost and complexity of data observability versus application observability, especially when teams need baselines and anomaly detection without moving sensitive data to a vendor-controlled cloud. That distinction matters in finance, healthcare, and public sector settings where the data platform itself is the regulated surface.
Where in-database execution changes the economics
In-database execution shifts the work to where the data already lives. Metric computation, baseline learning, and statistical analysis run inside the warehouse or lakehouse instead of shipping raw records out for external processing. That reduces movement, simplifies access control, and avoids building another copy of sensitive operational data.
This approach also forces discipline. You can't monitor every column in every table at the same level forever without affecting workload management. Work with your DBA or platform team to decide which domains need continuous checks, which can run on schedules, and which metrics should be summarized rather than persisted at raw granularity.
Keep the raw data in place, move the questions to it.
Practical trade-offs show up quickly:
Schedule around production load: Run heavier profiling during quieter windows if the warehouse serves business-critical analytics.
Use native analytical functions: Warehouses are already optimized for aggregation, distribution analysis, and historical comparison.
Document metric logic: Auditability matters when an executive asks why a dataset was flagged.
A useful implementation pattern is to start with the highest-impact tables first, then expand. Platforms built for in-database data quality execution follow that architecture directly, which is often the cleanest fit when privacy and scale are both essential.
3. Monitor Data Timeliness and Expected Delivery Patterns

A pipeline can be green and still be operationally useless. The orchestration tool says the job succeeded, but the sales dashboard still shows yesterday's bookings. A feature table loaded after the model scoring window closed. The data arrived, just too late to matter.
That's why timeliness deserves its own layer of observability. One of the key data quality dimensions for anomaly detection is timeliness, defined as the lag between event time and capture, in Monte Carlo's discussion of data quality anomaly detection. Treating freshness as a first-class quality measure changes how teams design alerts and incident response.
Treat freshness as a business contract
The right question isn't “Did the job finish?” It's “Did the data land in time for the decision it supports?” A retail stock feed that lands after replenishment planning has already happened is a failure, even if every upstream task completed successfully. The same goes for delayed market data, late patient records, or missed ETL windows before executives open a morning dashboard.
Expected-delivery monitoring works best when you model normal arrival patterns and then compare each run against those learned schedules. Teams often miss timezone effects, source-system batch windows, and known processing dependencies. Those details matter more than elegant alerting logic.
Use escalation instead of a single binary alarm:
Warn on drift: Notify owners when arrival starts slipping from its normal window.
Escalate on decision impact: Page the incident channel when a missed arrival threatens a reporting, trading, or care workflow.
Tag downstream dependencies: Show which dashboards, models, or reconciliations now carry stale inputs.
Fresh data is only useful if it arrives before the business question gets asked.
This is one area where product and business teams should help set expectations. Engineers know what's technically feasible. Stakeholders know what “late” means in the context of trading, inventory planning, claims processing, or executive reporting.
4. Implement Record-Level Data Validation Rules for Business Logic Enforcement
Schema checks catch structural issues. They don't catch business impossibilities. A row can satisfy the table definition and still violate the rules that keep operations, reporting, and compliance aligned.
That's why record-level validation belongs alongside anomaly detection. The statistical layer tells you something changed. Rule-based validation tells you whether a specific record, transaction, or event is unacceptable under the business logic you've agreed to enforce. Those are different jobs, and mature teams use both.
Validate what the business actually cares about
Start with rules that map directly to operational or regulatory risk. In banking, an account balance moving below an allowed threshold may be valid only under approved overdraft conditions. In healthcare, a treatment event without the matching consent status creates a compliance problem even if the row is otherwise well-formed. In telecom, billing records may require specific tax identifiers before invoicing can proceed.
The common mistake is building a giant rule catalog before ownership is clear. Don't do that. Ask which rule failures would force finance to restate a report, delay a close process, trigger an audit issue, or create customer harm. Those belong first.
A practical rollout usually follows this order:
Structural checks: Required fields, format expectations, and referential consistency.
Business checks: Cross-field logic such as totals matching line items plus taxes and shipping.
Audit checks: Evidence-oriented rules that prove required controls were applied.
The discipline matters because automated anomaly systems won't always know that a state transition is illegal in your domain. A customer order marked refunded before settlement, or a patient record updated without a valid encounter sequence, may look statistically rare but not inherently wrong to a model. A validation rule can reject or flag it immediately.
Field lesson: If a business stakeholder can describe the failure in one sentence, you can usually encode it as a record-level rule.
Track violations over time, not just pass or fail results. Repeated breaches often point to a source workflow, training issue, or integration contract that needs to be fixed upstream.
5. Track and Alert on Schema Changes and Structural Modifications
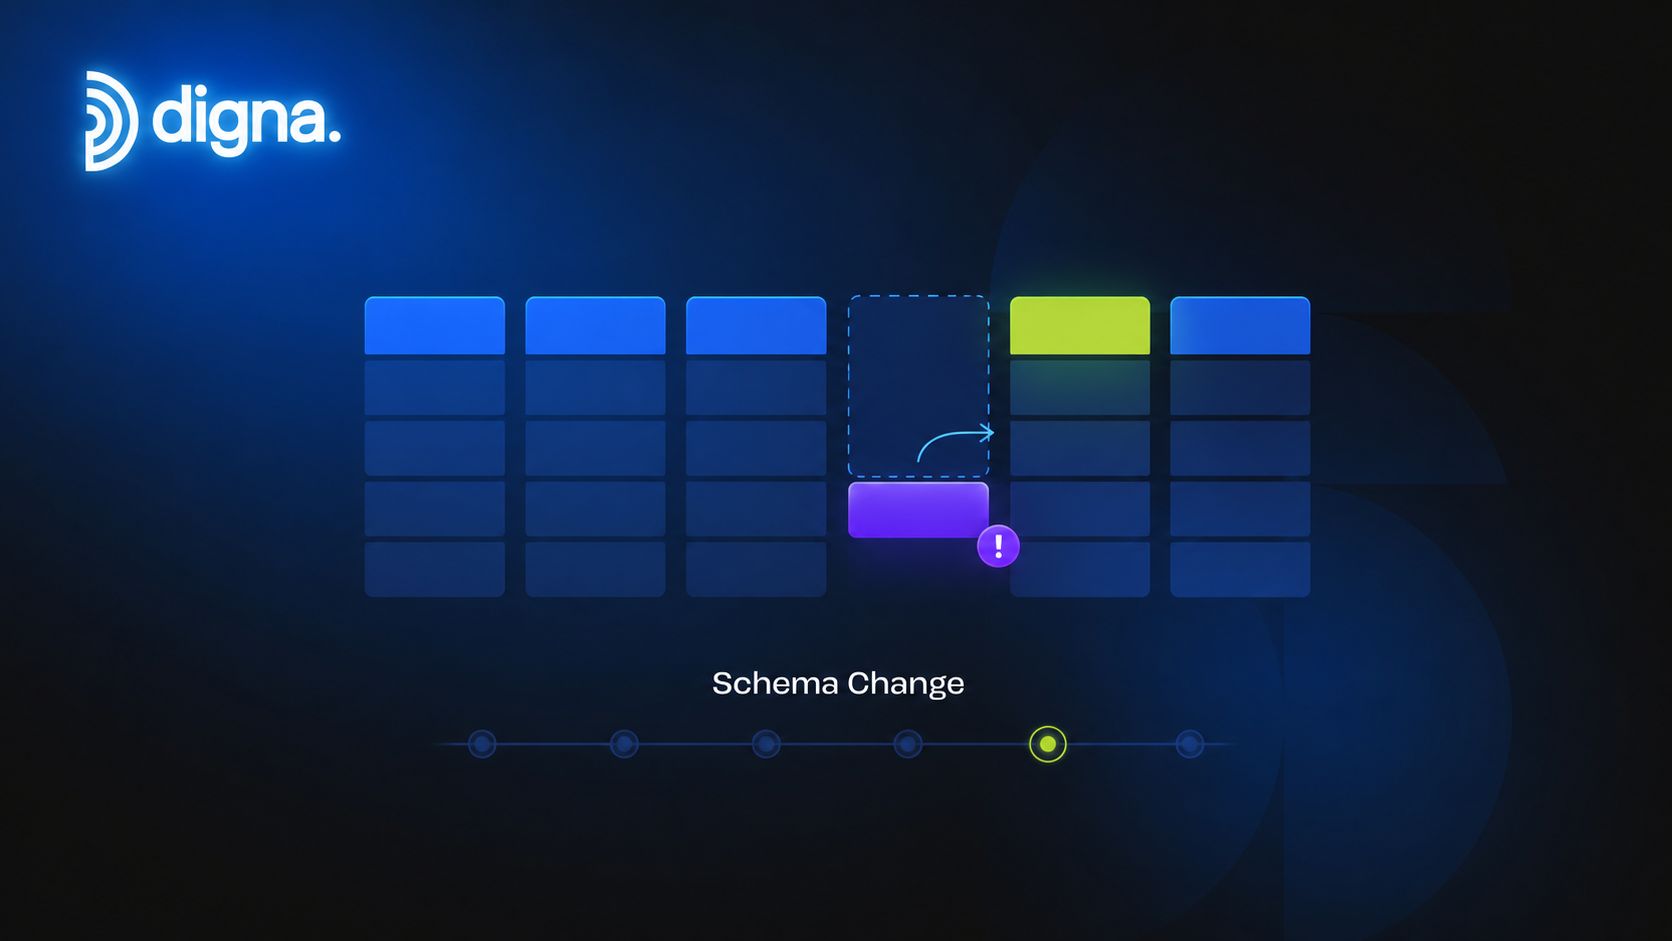
Many data incidents start as “small” structural edits. A source team renames a column. A field's type changes during an app release. A new nullable attribute appears and breaks an assumption inside a dbt model, BI semantic layer, or feature engineering job. Nobody notices until a dashboard looks wrong or a model starts misbehaving.
Schema tracking gives you early warning before that damage spreads. It's one of the simplest observability best practices to explain, and one of the easiest to underfund until teams get burned by a silent change in production.
Separate controlled evolution from silent breakage
Not every schema change is bad. Mature data platforms evolve constantly. The issue is whether downstream consumers know the change is coming, understand the impact, and can adapt in sequence. A planned field addition with coordinated rollout is normal. An unannounced type change in a shared table is not.
I've found the most effective approach is to classify schema events by intent and blast radius. Added columns in an append-only raw layer may be informational. Dropped or renamed fields in a curated model should trigger immediate review. Type changes on ML features deserve special treatment because they often surface only when inference or training fails later.
The alerting logic should reflect that reality:
Flag additive changes separately: New columns aren't equivalent to deleted ones.
Map dependencies: Show which transformations, dashboards, or models reference the affected field.
Require production approvals: Especially for shared serving layers and contract-bound datasets.
Teams also need a history of structural changes. That record helps when analysts ask why a report changed, when auditors ask how a control failed, or when engineers need to pinpoint when a contract drift began. The value isn't just detection. It's traceability.
If your environment includes dbt, Airflow, feature stores, and BI tools, schema tracking becomes the bridge between platform engineering and downstream consumers who otherwise discover the issue last.
6. Analyze Historical Observability Metrics to Surface Trends and Patterns
Current-state alerts are necessary. They're not enough. If you only look at today's anomaly, you miss whether the platform has been degrading for weeks, whether a delay always appears around the same business cycle, or whether a drift pattern consistently precedes a larger failure.
Historical analysis is where observability starts supporting strategy instead of incident triage. The strongest teams don't just ask what broke. They ask what's been changing slowly enough that nobody treated it as an incident yet.
Use history to distinguish noise from deterioration
A practical framework for this is a three-step anomaly process: metric profiling over time, AI-powered forecasting using signature-based methods, and autothreshold optimization using conformal inference, as outlined in digna's TDWI roundtable summary on data quality anomaly detection. That matters because trend analysis works best when the platform continuously profiles missing values, averages, unique counts, and other behavioral signals instead of only checking snapshots.
Historical observability helps in concrete ways. Data engineers can spot null-rate increases that always appear after a weekend processing path. Analytics teams can connect reporting issues to quarter-end volume changes. ML teams can inspect whether feature behavior shifted gradually before model output became unreliable.
A few habits make this useful instead of decorative:
Compare like periods: Don't compare a peak trading day to a routine weekend batch and call it drift.
Keep trend views visible to non-engineers: Business context often explains recurring variation faster than technical logs do.
Investigate repeated “minor” anomalies: Small recurring deviations often reveal an upstream design flaw.
The teams that get the most value from historical analytics treat it as evidence for prioritization. If one dataset produces frequent low-severity anomalies that never affect decisions, it may not deserve immediate engineering work. If another shows a slow deterioration pattern tied to finance close or patient-care workflows, it should move up the queue quickly.
7. Establish Unified Observability Dashboards Accessible to Multiple Stakeholder Groups
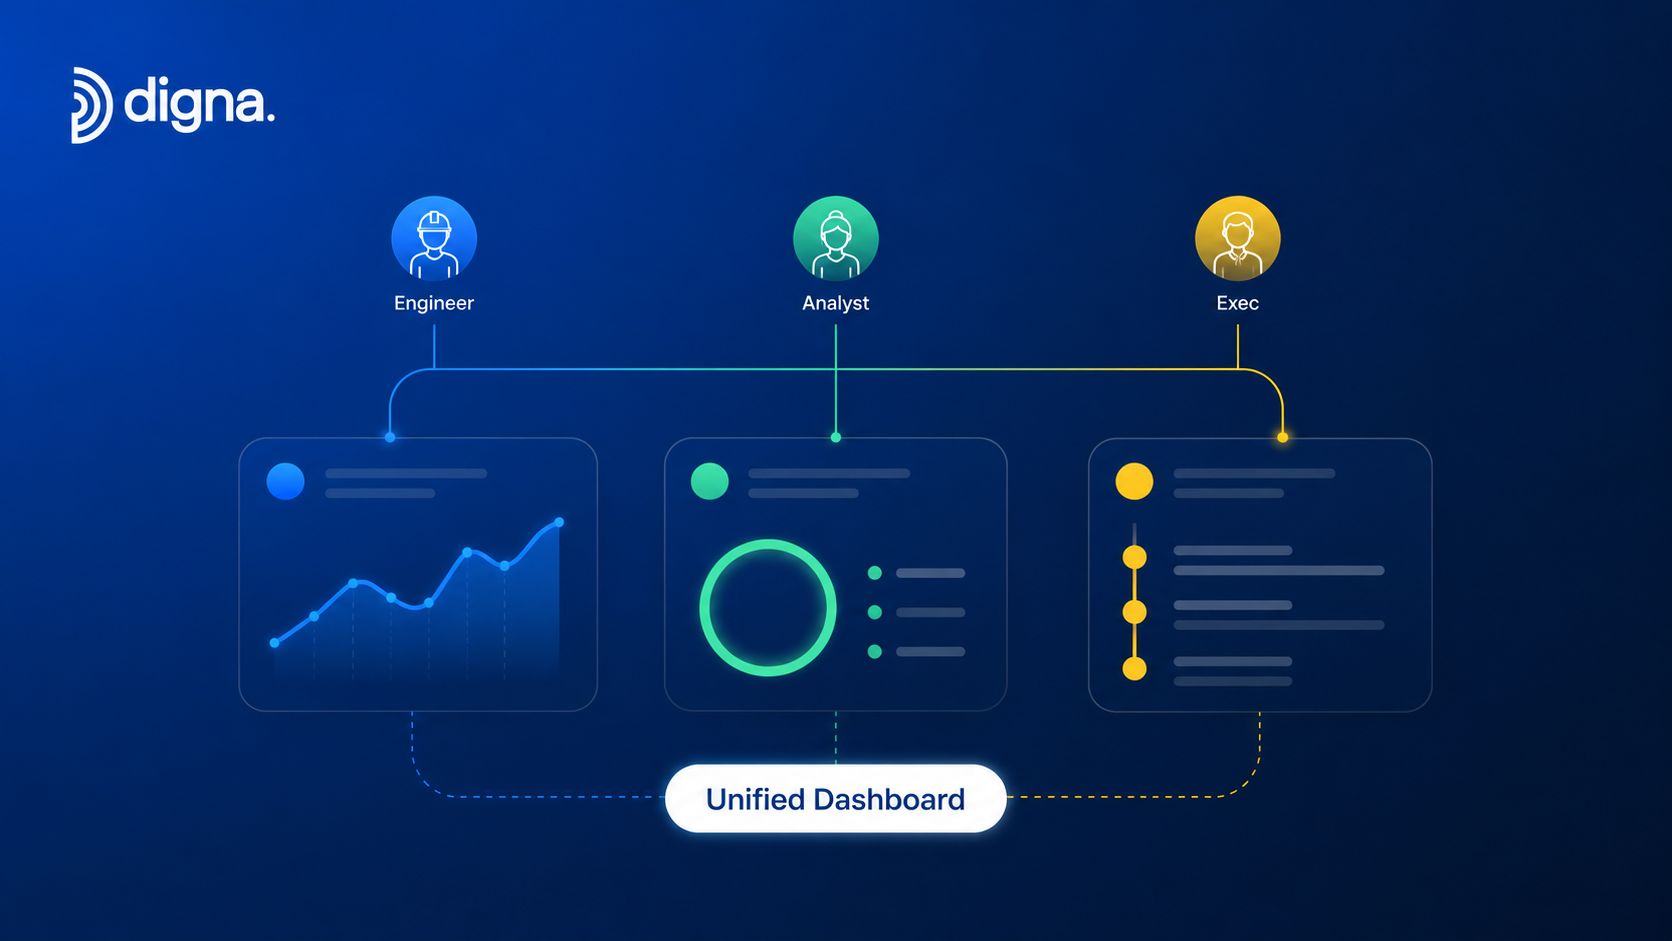
A single dashboard can still create silos if it only makes sense to engineers. Executives need to know whether a data issue affects bookings, claims, or regulatory reporting. Analysts need to know whether they can trust the table behind today's board deck. Data engineers need enough technical depth to isolate the problem without clicking through five systems.
Unified dashboards work when they share a common source of truth but present different levels of detail. Otherwise, “single pane of glass” becomes a slogan for a screen nobody really uses.
One dashboard layer won't serve everyone
Design this like an operational hierarchy. The top layer should answer whether core data products are healthy, fresh, and structurally stable. Team views should show domain-specific issues, ownership, and investigation status. Technical drill-downs should expose the actual metrics, anomalies, delays, validation failures, and schema events behind the summary.
That structure matters because multiple actors participate in a data incident. A BI developer might first notice a stale dataset. A platform engineer may confirm the timeliness breach. A business stakeholder may decide whether to pause a report or proceed with caveats. If each group sees a different truth, the response slows down.
Good dashboard design usually includes:
Business impact framing: Show which reports, models, or workflows depend on the affected data.
Tiered navigation: Summary first, then domain view, then technical detail.
Alert consolidation: Group related symptoms so one root issue doesn't flood every stakeholder.
I'd also avoid stuffing logs, traces, and quality metrics into one equally weighted view. Observability should support the question the viewer needs answered right now. For an executive, that's often trust and impact. For an engineer, it's evidence and next action. For an analyst, it's whether they can use the dataset at all.
When teams get this right, issue triage becomes a shared process instead of a specialist bottleneck.
8. Enforce Data Governance Through Private Cloud and On-Premises Deployment
For many data leaders, the hardest observability question isn't technical. It's governance. Can you monitor sensitive data without exposing it to a third party? Can you keep telemetry, profiling, and anomaly detection inside the same control boundary as the data itself? In regulated environments, that answer often determines whether a platform is even eligible for adoption.
In certain situations, generic observability patterns break down. Sending everything to a vendor cloud may be acceptable for some app telemetry. It can be a nonstarter for patient data, financial records, government datasets, or region-bound enterprise data.
Keep observability inside the control boundary
Private cloud and on-premises deployment solve a real operational problem. They allow teams to enforce their own access controls, retention policies, residency requirements, and security procedures while still gaining visibility into data quality, timeliness, and structural changes.
The trade-off is responsibility. Once the platform runs inside your environment, your team owns capacity planning, backup strategy, access reviews, and operational hardening. That's often worth it, but it isn't free. Governance-first architecture works best when platform engineering and security are involved from the start, not after a proof of concept already assumes data export.
A few implementation priorities matter:
Define compliance boundaries early: Know which datasets, regions, and user groups are restricted before rollout.
Align permissions with governance models: Access to observability detail can itself reveal sensitive business information.
Plan retention intentionally: Historical metrics may need to stay long enough for audit, trend analysis, or incident review.
This model is especially important when observability includes dataset profiling and anomaly analysis rather than only infrastructure metadata. The richer the signal, the more carefully teams need to control where it is computed and who can inspect it.
In practice, privacy-first deployment is often what makes holistic observability viable for finance, healthcare, telecom, and public sector teams instead of just technically attractive.
9. Integrate Observability Across Data Warehouses, Lakes, and Pipeline Ecosystems
Most enterprises don't have one data platform. They have a warehouse, a lake, orchestration, transformation layers, reverse ETL, BI tools, and at least a few teams that still operate side systems. If your observability stops at one layer, it creates false confidence.
That's why integration is one of the more practical observability best practices. A model issue in Databricks may originate from a type change in a warehouse landing table. A stale executive dashboard may begin with an orchestration delay in Airflow or a failed transformation in dbt. You need line-of-sight across the ecosystem, not excellence in one isolated tool.
Integration matters more than feature depth in one tool
Start by mapping the full path of critical data products. For example, a customer-risk score might originate in application events, land in a lake, transform in dbt, materialize in Snowflake, and feed a BI dashboard plus a model-serving workflow. Observability should follow that path through each handoff.
I'd prioritize integrations by business dependency rather than by technical neatness. It's better to observe the handful of flows that support trading, patient care, revenue reporting, or regulatory submissions than to aim for theoretical coverage everywhere and finish nowhere. Heterogeneous stacks are normal now. Your approach should assume Snowflake, BigQuery, Redshift, Databricks, Airflow, and dbt may all be part of the same operating model.
A strong rollout usually includes:
Critical-path mapping: Identify systems that directly support key reports, ML features, and operational decisions.
Dependency documentation: Make handoffs visible so teams know where to investigate first.
Standardization opportunities: Use shared observability to expose inconsistent contracts between teams.
This topic also overlaps with AI operating models. If your pipelines feed governed AI use cases, an enterprise AI governance framework guide is useful context for deciding where controls and accountability should sit across the stack.
10. Reduce Specialist Overhead by Operationalizing Observability for Business Users
A lot of observability programs fail for a simple reason. Only specialists can use them. The data engineer understands the metrics. The analyst sees a broken chart but can't tell whether it's a freshness issue, a schema change, or a rule violation. The business team files a ticket and waits.
That model doesn't scale. Routine observability has to be usable by analysts, BI developers, governance teams, and operational stakeholders who don't live inside pipeline internals every day.
Make routine investigation self-service
A good self-service model doesn't expose every technical detail. It translates system behavior into business-relevant signals. “This dashboard is stale because the customer_orders dataset missed its expected delivery window” is actionable. “Task failure in upstream ingestion pod” usually isn't for the analyst who just needs to decide whether to trust a metric.
The underlying methods can still be statistically advanced. The National Law Review summary of digna's deployment approach describes distribution-free anomaly detection and adaptive prediction intervals that learn behavioral baselines over time without manual threshold configuration. That kind of automation matters because business users shouldn't be expected to tune thresholds for every table and column.
To make observability operational outside engineering, build around a few principles:
Clear issue labels: Separate freshness, anomaly, validation, and schema events so non-specialists know what kind of problem they're seeing.
Defined escalation paths: Users should know when they can investigate, when they should pause reporting, and when engineering must take over.
Usable interfaces: Trend views, status indicators, and guided investigation screens reduce ticket churn.
The payoff isn't just convenience. It changes team economics. Engineers spend less time answering basic trust questions. Analysts catch issues earlier. Business users gain enough visibility to stop acting on obviously compromised data. That's a meaningful shift in how the whole platform operates.
10-Point Observability Best Practices Matrix
Item | Implementation Complexity 🔄 | Resource Requirements ⚡ | Expected Outcomes 📊 | Ideal Use Cases 💡 | Key Advantages ⭐ |
|---|---|---|---|---|---|
Implement AI-Powered Anomaly Detection with Baseline Learning | Moderate–High, ML models, warm-up period, integration work. | Requires historical data, model compute for training & scoring, storage for baselines. | Continuous detection of subtle deviations; fewer false positives over time. | High-volume time-series, fraud detection, production metrics monitoring. | Detects subtle drift; adapts to seasonality; reduces alert fatigue. |
Execute Observability Computations In-Database to Reduce Data Movement | High, DB access, SQL pushdown, engine-specific optimization. | Uses database CPU/memory; reduces network and external infra needs. | Lower latency, no data egress, simpler governance and faster queries. | Regulated environments, petabyte-scale analytics, latency-sensitive detection. | Keeps data in place; reduces transfer costs; improves performance. |
Monitor Data Timeliness and Expected Delivery Patterns | Low–Moderate, schedule learning and alerting setup. | Historical load logs, light compute, integration with orchestration tools. | Early alerts for late/missing loads; prevents stale downstream reports. | ETL pipelines, SLA monitoring, scheduled reporting systems. | Prevents cascading failures; supports SLA tracking and stakeholder alerts. |
Implement Record-Level Data Validation Rules for Business Logic Enforcement | Moderate, rule definition, stakeholder alignment, maintenance. | Compute for row-level checks, business SME involvement, audit storage. | Immediate detection of business-rule violations and compliance evidence. | Financial controls, regulatory compliance, referential integrity checks. | Enforces business logic; provides audit trails; reduces downstream fixes. |
Track and Alert on Schema Changes and Structural Modifications | Low–Moderate, schema diffing, policy/configuration work. | Metadata storage, lightweight monitoring processes, alerting system. | Timely detection of structural breaks; history for impact analysis. | ML feature stability, BI dashboards, evolving source systems. | Prevents silent pipeline breaks; enables rapid root-cause analysis. |
Analyze Historical Observability Metrics to Surface Trends and Patterns | Moderate, time-series analytics and correlation tooling. | Long-term metric storage, analytics compute, visualization tooling. | Identification of trends, early warnings, and prioritization evidence. | Capacity planning, model drift detection, long-term reliability studies. | Reveals gradual degradation; informs strategic remediation and planning. |
Establish Unified Observability Dashboards Accessible to Multiple Stakeholder Groups | Moderate, role-based views, UX design, access controls. | Dashboard platform, curated metrics, user management and training. | Faster investigations and aligned cross-team situational awareness. | Enterprise reporting, cross-functional incident response, exec summaries. | Centralizes insights; reduces communication delays; supports role-tailored views. |
Enforce Data Governance Through Private Cloud and On-Premises Deployment | High, deployment, security hardening, compliance configuration. | Customer-managed infrastructure, ops/IT resources, backup/DR planning. | Full control over data residency, access, and regulatory compliance. | GDPR/HIPAA-regulated orgs, government agencies, data sovereignty needs. | Eliminates vendor data access risk; meets residency and audit requirements. |
Integrate Observability Across Data Warehouses, Lakes, and Pipeline Ecosystems | High, many connectors, coordination across platform teams. | Integration engineering, multiple connectors/APIs, ongoing maintenance. | End-to-end visibility, reduced blind spots, consolidated metrics. | Heterogeneous modern data stacks (Snowflake, Databricks, Airflow, dbt). | Single pane of glass; consistent observability across systems. |
Reduce Specialist Overhead by Operationalizing Observability for Business Users | Moderate, UX, templates, no-code rule builders, governance controls. | Investment in UX, training, templates, and support materials. | Broader ownership of monitoring; faster detection by domain teams. | Organizations pursuing data democratization and self-service analytics. | Lowers specialist burden; empowers business users; speeds routine investigations. |
From Insight to Action Building a Culture of Observability
The biggest shift in data observability isn't technical. It's organizational. Teams stop treating data issues as isolated pipeline defects and start treating them as reliability events with business impact. That changes what they instrument, how they prioritize incidents, and who gets included in the response.
The practices above work best as a system. AI-driven anomaly detection catches changes that fixed thresholds miss. Timeliness monitoring protects decisions from stale data. Record-level validation enforces domain logic that statistical methods can't infer on their own. Schema tracking catches structural edits before they ripple into reports and models. Historical analytics show whether today's issue is noise, seasonality, or a slow-moving pattern that deserves architectural attention.
Architecture matters just as much as detection. If observability depends on shipping sensitive data into an external platform, many enterprises won't be able to use it where it matters most. In-database execution, private cloud deployment, and on-premises support aren't side features in those environments. They're what make broad observability operationally and legally workable. This is especially true in hybrid estates where application telemetry and data-platform telemetry have very different privacy, scale, and cost characteristics.
The cultural side is where many teams still underinvest. Observability can't stay trapped inside platform engineering. Analysts need dashboards that tell them whether a dataset is usable. Business stakeholders need to understand the impact of freshness and quality failures on reporting and operations. Governance leaders need evidence that controls are running and violations are visible. Engineers still need detailed technical views, but they shouldn't be the only people who can interpret the state of the platform.
That's also why starting with SLOs and business outcomes matters. If teams don't define what healthy, fresh, valid, and trustworthy mean for a given data product, they end up collecting too much telemetry and still missing the decisions that matter. The strongest programs ask a simple question first: what failure would hurt the business here? Then they instrument for that outcome and build workflows around it.
If you're deciding where to begin, don't try to deploy every capability across every domain at once. Pick the data products that support executive reporting, regulated workflows, critical customer journeys, or ML outputs already under scrutiny. Add anomaly detection where drift is hard to define manually. Add timeliness where stale data creates immediate decision risk. Add validation where business rules are explicit and auditable. Add schema tracking where contracts change often. Then expand once the operating model is working.
A platform like digna fits naturally into that approach because it combines anomaly detection, historical analytics, timeliness monitoring, record-level validation, and schema tracking while executing analysis inside customer-controlled environments. That combination is useful when the goal isn't just more monitoring, but a practical data observability layer that supports governance, privacy, and day-to-day operations.
The end state is straightforward. People trust the platform because they can see when data is healthy, when it isn't, and what to do next. That trust improves decisions, reduces reactive firefighting, and lets teams use data products with more confidence across the business.
If you're building a privacy-first observability model for modern data platforms, digna is worth evaluating. It focuses on data anomalies, record-level validation, timeliness, schema tracking, and in-database execution, which makes it relevant for teams that need observability inside customer-controlled environments.
To see expected-delivery monitoring applied to real tables, digna Timeliness learns normal arrival patterns and flags late or missing loads before stale data reaches a morning dashboard.
Frequently asked questions
What are the best practices for data platform observability?
The article lists ten: AI-powered anomaly detection with baseline learning, in-database computation, timeliness monitoring, record-level validation rules, schema change tracking, historical trend analysis, dashboards for multiple stakeholder groups, private cloud or on-premises deployment, integration across warehouses and pipelines, and self-service observability for business users.
Why do static thresholds fail in data observability?
Static thresholds break because data behaves differently by day, season and business event, such as payment volumes on payroll days or inventory swings around promotions. Baseline learning adapts boundaries for volume, distributions and relationships automatically, but the article advises letting baselines settle before treating anomaly scores as operational truth.
Why run observability computations in-database?
Running metric computation, baseline learning and statistical analysis inside the warehouse avoids exporting large volumes of sensitive data to another platform. That reduces data movement, simplifies access control and avoids another copy of regulated data. The article advises starting with the highest-impact tables and scheduling heavier profiling around production load.
How should data freshness be monitored?
Treat freshness as a business contract and ask whether data landed in time for the decision it supports, not whether the job finished. Model normal arrival patterns, then warn owners when arrival starts slipping, escalate when a missed load threatens reporting or trading, and tag the affected dashboards and models.
Where should a team start with data observability?
Begin with the data products behind executive reporting, regulated workflows, critical customer journeys or scrutinized ML outputs, not every domain at once. Add anomaly detection where drift is hard to define, timeliness where stale data creates decision risk, validation where rules are explicit, and schema tracking where contracts change often.


