Build the platform observability solution your organisation needs.
Modern data platforms evolve continuously. Workloads change, data volumes grow, queries become more complex and resource consumption shifts.
digna is a data observability platform that gives you modular capabilities to monitor, analyse and understand how your data platforms behave over time.
digna Data Anomalies →
Detect unexpected changes in platform and workload behaviour.
digna Data Analytics →
Understand trends and how platform behaviour evolves over time.
Monitor whether required platform data arrives according to expected delivery patterns.
Define a consumption limit and get alerted when usage exceeds the threshold you set.
Combine these and other digna capabilities to build the observability solution that fits your environment. Monitor what matters. Detect unexpected changes. Understand how your platform is evolving before issues become operational problems.
Why Data Platform Observability Matters
Data platforms rarely become inefficient overnight. Enterprise platforms such as Databricks, Snowflake and Teradata are designed to scale — but scaling also introduces complexity.
Growing complexity
New workloads, growing data volumes and more complex queries.
Changing resources
Evolving usage patterns and compute requirements alter platform behaviour.
Gradual risk
Cost drift and runtime instability may emerge without a system failure.
Change without failure
Cost drift, runtime instability, longer query duration and resource inefficiencies can emerge gradually without a system failure.
Beyond point-in-time health
Traditional monitoring reports whether a system or job is healthy. Observability explains how platform behaviour changes over time.
From Metrics to Behavioural Understanding
Raw metrics tell you what happened. Behavioural analysis helps you understand what changed.
A single metric value provides limited context. A query took 18 minutes. Is that a problem? It depends on what normally happens.
If the same query normally takes 3 minutes, the change is significant. If it normally takes 20 minutes, it may be completely normal. digna Data Anomalies identifies unexpected deviations; digna Data Analytics shows how the underlying metric evolves over time.

Consumption
Compute consumption, DBU consumption, credits and resource utilisation.
Performance
Job runtimes, query duration and query execution characteristics.
Workload
Workload volumes, data volumes, concurrency and other platform-specific metrics.
POINT-IN-TIME METRICS
What happened?
A metric shows an event: a query took 18 minutes, compute rose, or a job finished. On its own, that value has limited context.
BEHAVIOURAL ANALYSIS
What changed?
digna establishes normal behaviour, finds unexpected deviations and reveals whether a change is isolated, recurring or part of a long-term trend.
What Can You Observe?
Monitor the signals that matter to your platform.
Workload Performance
Understand how job and query execution times evolve. Use digna Data Analytics to analyse runtime trends and digna Data Anomalies to identify unusual execution behaviour. Identify workloads that become slower, less predictable or increasingly variable.
Resource Consumption
Monitor compute and resource usage over time. Use digna Data Analytics to understand consumption trends and digna Data Anomalies to identify unexpected increases. Find workloads where resource consumption changes without a corresponding change in business or technical requirements.
Cost Behaviour
Track platform-specific cost metrics. Use digna Data Analytics to understand cost development and digna Data Anomalies to identify unexpected spikes or deviations. Identify gradual cost drift as well as sudden changes.
Workload Stability
Monitor the consistency of workload execution. Use digna Data Analytics to understand how runtime variability develops and digna Data Anomalies to identify unusual execution behaviour.
Platform Utilisation
Understand how platform usage changes as workloads and data volumes grow. Analyse utilisation trends and identify unexpected changes with digna capabilities.
Data Volume and Workload Growth
Monitor data volumes and workload activity that may explain changes in performance or cost. Distinguish legitimate platform growth from unexpected changes.
Platform Data Delivery
Use digna Timeliness to monitor whether essential platform data arrives as expected and detect missing data, unexpected delays or changing delivery patterns.
Consumption Limits
Use digna Data Validation to define acceptable consumption thresholds and get alerted when platform usage exceeds the limits you set.
Common Data Platform Observability Scenarios
Detect changes before they become operational issues.
Detecting Cost Drift
A workload that costs €500 per month may gradually increase to €700, then €900, without generating any system failure. Use digna Data Analytics to track platform consumption over time, then digna Data Anomalies to detect unexpected changes or deviations from the established pattern.
Monitoring Runtime Stability
A job may continue to complete successfully while its execution time becomes increasingly variable. Use digna Data Analytics to understand how runtime behaviour evolves and digna Data Anomalies to identify unusual execution patterns.
Identifying Inefficient Workloads
Some workloads consume disproportionately high resources compared with their historical behaviour or expected workload. Compare resource consumption over time and detect unusual consumption patterns.
Performance Degradation, Growth & Anomalies
A gradual increase in execution time can signal changing workload behaviour, data growth or resource pressure. As datasets, pipelines, users and workloads grow, digna Data Analytics establishes the underlying trend while digna Data Anomalies identifies deviations — helping separate legitimate growth from unexpected platform behaviour.
Monitoring Platform Data Delivery
Use digna Timeliness to get alerted when required platform data is missing, delayed or arrives outside its expected delivery pattern. This helps teams identify upstream delivery issues before incomplete or stale data affects downstream workloads, reports and decisions.
Setting Consumption Guardrails
Use digna Data Validation to define a consumption limit and get alerted when usage exceeds the threshold you set. Use it to establish operational guardrails for key workloads and respond before unexpected consumption turns into avoidable cost.
Why Traditional Monitoring Is Not Enough
A successful job does not necessarily mean a healthy workload. Traditional monitoring focuses on uptime, job success or failure, point-in-time resource utilisation and threshold alerts.
These controls matter, but can miss behavioural change, gradual cost increases, runtime variability, hidden inefficiencies, workload drift and changing performance patterns. Data Analytics shows how behaviour evolves; Data Anomalies identifies when it becomes unexpected.
TRADITIONAL MONITORING
System uptime · Job success or failure · Resource utilisation at a point in time · Alerts when thresholds are exceeded
DIGNA OBSERVABILITY
Behavioural change over time · Gradual cost increases · Runtime variability · Hidden inefficiencies · Workload drift · Changing performance patterns
One Platform.
Build Your Own Observability Solution.
Use the modules you need. Combine them when you need them. Every organisation has different data platforms, workloads and operational priorities. You may focus on cost, performance, or the relationship between workload growth, resource consumption and platform behaviour.
digna Data Anomalies detects unexpected changes. Data Analytics explains trends. Timeliness monitors data availability. The Python SDK extends workflows and applications. Use individual modules independently or combine them into a broader observability solution.
Data Platform Observability connects platform behaviour, data quality and business impact — from workloads and resource consumption to data rules and business KPIs.
Detect unexpected changes.
Understand trends and behaviour.
Monitor data availability.
Extend your workflows.
Explore Platform Observability Whitepapers
Practical insights for modern data platforms. Learn how to identify cost anomalies, workload drift and changing performance patterns across the technologies you use.
Databricks Cost Anomaly Detection
Understand how cost anomalies emerge and how digna Data Anomalies detects spikes, gradual cost drift and unstable workloads.
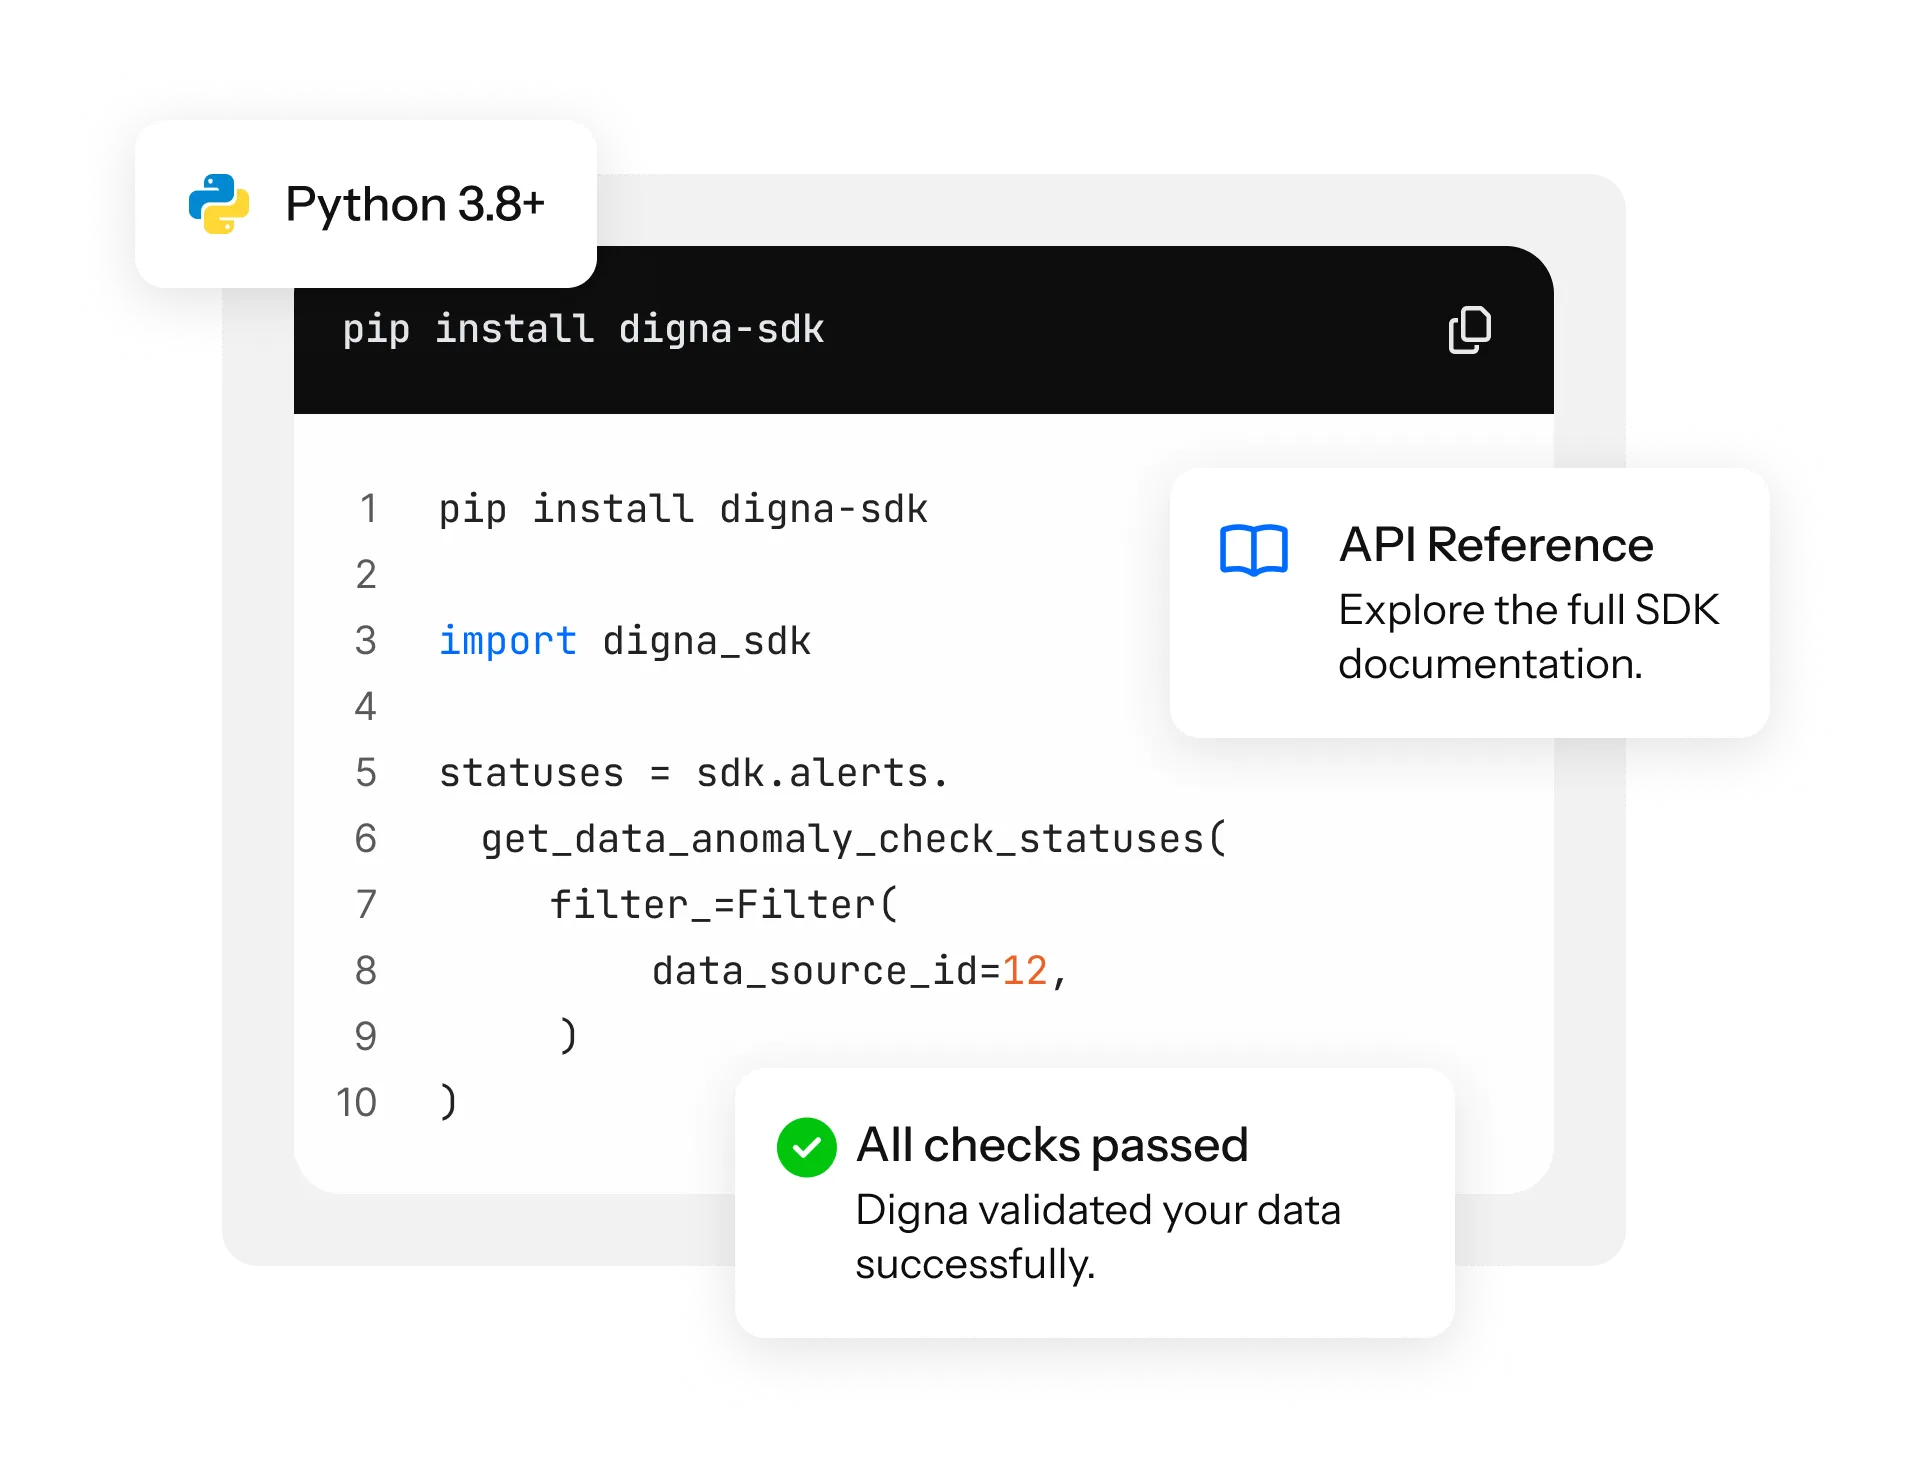
Integrate platform observability into your own workflows. The digna Python SDK lets teams work with digna programmatically in applications, pipelines and operational workflows.
Automate interactions, build custom monitoring and automation, incorporate digna into Python-based applications, and extend your data and engineering processes.
Understand How Your Data Platform Behaves
Move from reactive monitoring to proactive control. As data platforms scale, digna helps teams understand how workloads, performance and resource consumption change over time.
Use digna Data Analytics to understand trends and digna Data Anomalies to detect unexpected behaviour. Combine digna capabilities and the digna Python SDK to build the observability solution that fits your environment.