Data Observability Architecture Explained Simply
|
8
min read

A dashboard can be green while the decision behind it is already wrong. The pipeline completed, the warehouse is available, and every scheduled job reports success, yet a source system delivered late data, an upstream team changed a column type, or a partial load removed records. The finance team sees yesterday's revenue, an operations team misses a developing issue, and an AI feature consumes inputs that no longer match the assumptions used during training.
Teams often start by adding more alerts. This approach helps until an alert fires without ownership, context, or a clear view of downstream impact. The deeper problem is architectural: where does observability compute run, where does metadata live, and how does the system connect a technical signal to the people and business processes affected by it?
Data observability architecture answers those questions. It extends traditional infrastructure monitoring with continuous visibility across data pipelines, warehouses, lakes, dashboards, and machine learning inputs. The commercial category has expanded rapidly. One 2026 industry estimate values the data observability market at USD 3.51 billion and projects USD 6.03 billion by 2031, with an 11.42% CAGR across 2026 to 2031 (Mordor Intelligence market estimate). Another 2026 report values the market at USD 3.4 billion in 2026, up from USD 2.94 billion in 2025 (Spherical Insights market report).
The practical lesson is simple. A reliable architecture shouldn't only tell you that a table changed. It should show what changed, whether the change is expected, which downstream assets depend on it, and whether the signal affects reporting, operations, governance, or AI. Teams that want a structured way to think about reliability can also use this guide to measure data reliability.
Table of Contents
Introduction Why Data Observability Architecture Matters Now
From Technical Signals to Business Impact With Real Examples
Your Roadmap to Implementing Data Observability Architecture
Introduction Why Data Observability Architecture Matters Now
A typical incident starts subtly. An ingestion job receives fewer records than usual, but it exits successfully. A transformation continues to run because the schema is technically valid. The dashboard refreshes on schedule, so its status indicator stays green. Nobody notices until a leader asks why a business metric has moved unexpectedly.
Traditional monitoring is good at answering operational questions such as whether a server is available, a job finished, or a process returned an error. Data systems need more context. Data changes shape, volume, distribution, timing, and meaning while moving through ingestion, transformation, storage, and consumption. A pipeline can be operationally healthy while producing data that's incomplete, stale, or structurally incompatible with downstream use.
The blind spot is usually architectural
Modern data observability architecture emerged because basic infrastructure metrics and application performance monitoring couldn't explain these failures. As pipelines became more distributed, teams added checks for data quality, lineage, anomalies, and real-time behavior. The discipline now functions as an architectural layer for reliability and governance, not merely as an incident-response dashboard.
That distinction matters to several groups:
Data engineers need to find the source of a failure without searching across disconnected tools.
Analytics engineers and BI developers need confidence that transformations and dashboards reflect current, structurally valid inputs.
Governance leaders need evidence that controls apply continuously across warehouses, lakes, and pipelines.
AI teams need traceability from source records through features, training data, and model inputs.
The architecture determines whether those groups share one context or assemble it manually during an incident. A central metadata layer can connect ownership, lineage, historical behavior, and usage. Distributed execution can keep checks close to the systems that hold the data. Alerting can then route a meaningful event instead of sending an isolated metric to a generic operations channel.
What good architecture enables
A well-designed system detects both known and unexpected failure modes. Deterministic checks can enforce explicit rules, while statistical methods can identify unusual behavior without requiring someone to predict every possible problem. The result isn't perfect data by definition. It's a feedback system that gives teams earlier evidence, better diagnosis, and a clearer basis for prioritizing remediation.
The architecture also affects governance, portability, and bill control. Moving data into an external service may simplify some analysis, but it can introduce additional access, movement, and infrastructure concerns. Executing checks within an existing warehouse or lake environment can preserve data locality, although it requires careful planning around permissions, workloads, and supported engines. Those trade-offs deserve as much attention as the list of metrics being monitored.
What Data Observability Architecture Really Means
A useful analogy is a car dashboard. Traditional monitoring might tell you whether the engine is running and whether the vehicle has power. Observability gives you a richer view: speed, fuel level, temperature, warning indicators, and enough context to understand why the car isn't behaving as expected.

Apply that analogy to a data platform. The data plane is where data is generated, moved, transformed, and stored. The control plane defines schedules, policies, thresholds, workflows, and responses. The metadata layer explains what each asset is, who owns it, how it connects to other assets, and how it has behaved over time.
Build the definition in three steps
First, identify the observable system. It includes source applications, ingestion jobs, transformation tools, warehouses, lakes, dashboards, and model inputs. Observability must follow the data across that path, not stop at the first successful job.
Second, identify the signals. Metrics describe measurable behavior such as arrival timing, volume, or distribution. Logs record events and errors. Predictive signals highlight deviations from expected patterns. Lineage and metadata add the context that turns a warning into an investigation path.
Third, identify the decision loop. The platform collects or computes signals, evaluates them against rules or learned baselines, enriches events with context, and routes actions to owners or incident workflows. That loop is what separates observability from a static quality report.
Why quality tools alone aren't enough
A data quality tool may validate that values conform to known rules. That's valuable, but it doesn't automatically explain whether a delayed table affects a regulatory report, which team owns the upstream source, or whether the same behavior is normal for a particular delivery schedule. Observability combines validation with timeliness, anomaly detection, lineage, and operational context.
The architecture should also remain independent from the pipelines it observes. Practical guidance separates the observability platform from the observable data system, allowing the platform to monitor new and legacy environments without forcing architectural rewrites (academic architecture guidance). This independence lets teams add coverage incrementally rather than redesigning every warehouse, lake, or orchestration workflow first.
In plain language, data observability architecture is the arrangement of execution, collection, metadata, analysis, and action that lets a team understand the current and expected state of data across its full lifecycle.
Core Layers and Components of a Modern Architecture
A modern architecture works best as a set of specialized layers. Each layer owns a different responsibility, but all layers share enough metadata and event context to support diagnosis.

Source systems and the data plane
Business data originates and transformations execute within this plane. It may include operational databases, SaaS applications, streaming systems, cloud storage, warehouses, and lakes. The data plane should remain responsible for the work of moving and processing data.
An important design choice is whether observability computations run here. In-database execution can calculate metrics and perform checks inside compatible data sources, while an external design extracts information for analysis elsewhere. Keeping execution close to the data can reduce unnecessary movement and preserve existing security boundaries, but teams still need to manage permissions and workload isolation.
Collection and ingestion
The collection layer gathers telemetry and metadata from the data plane. It can capture table statistics, pipeline events, schema changes, query behavior, delivery times, validation results, and lineage updates. The purpose isn't to copy every record into the observability system. It's to collect the signals and references needed to understand behavior.
A strong collection layer supports both scheduled and event-driven patterns. Scheduled checks are useful for known delivery windows. Events are useful when a schema changes, a pipeline completes, or a source emits a relevant state transition.
Centralized orchestration and metadata
The control layer schedules checks, applies policies, stores configuration, and coordinates alerts. The metadata layer enriches each signal with ownership, definitions, lineage, usage, environment, and historical context. Together, they answer the questions that raw metrics can't answer.
This layer should also support legacy and heterogeneous environments. A platform that only understands one warehouse leaves blind spots around on-premises systems, multiple clouds, or older orchestration tools. The architectural objective is a shared context model, not forced uniformity in every underlying system.
Observability and action
The top layer presents health status, trends, anomalies, incidents, and impact. It should help a responder move from a signal to a decision:
Detection: What behavior changed?
Diagnosis: What upstream event or transformation may explain it?
Impact: Which datasets, dashboards, models, or processes depend on it?
Action: Who owns the fix, and how should the event be tracked?
This structure aligns with broader data system architecture guidance, where boundaries between processing, orchestration, metadata, and consumption need to remain explicit.
Architecture rule: Keep execution close to the data when governance and cost demand locality, but keep context centralized enough that responders can understand impact across the whole platform.
The Five Pillars That Detect Silent Data Failures
The five-pillar model gives teams a practical starting point: Freshness, Quality, Volume, Schema, and Lineage. Each pillar addresses a different failure mode. Mature implementations combine deterministic validation with statistical anomaly detection because explicit rules catch known violations while behavioral analysis can surface unexpected shifts.
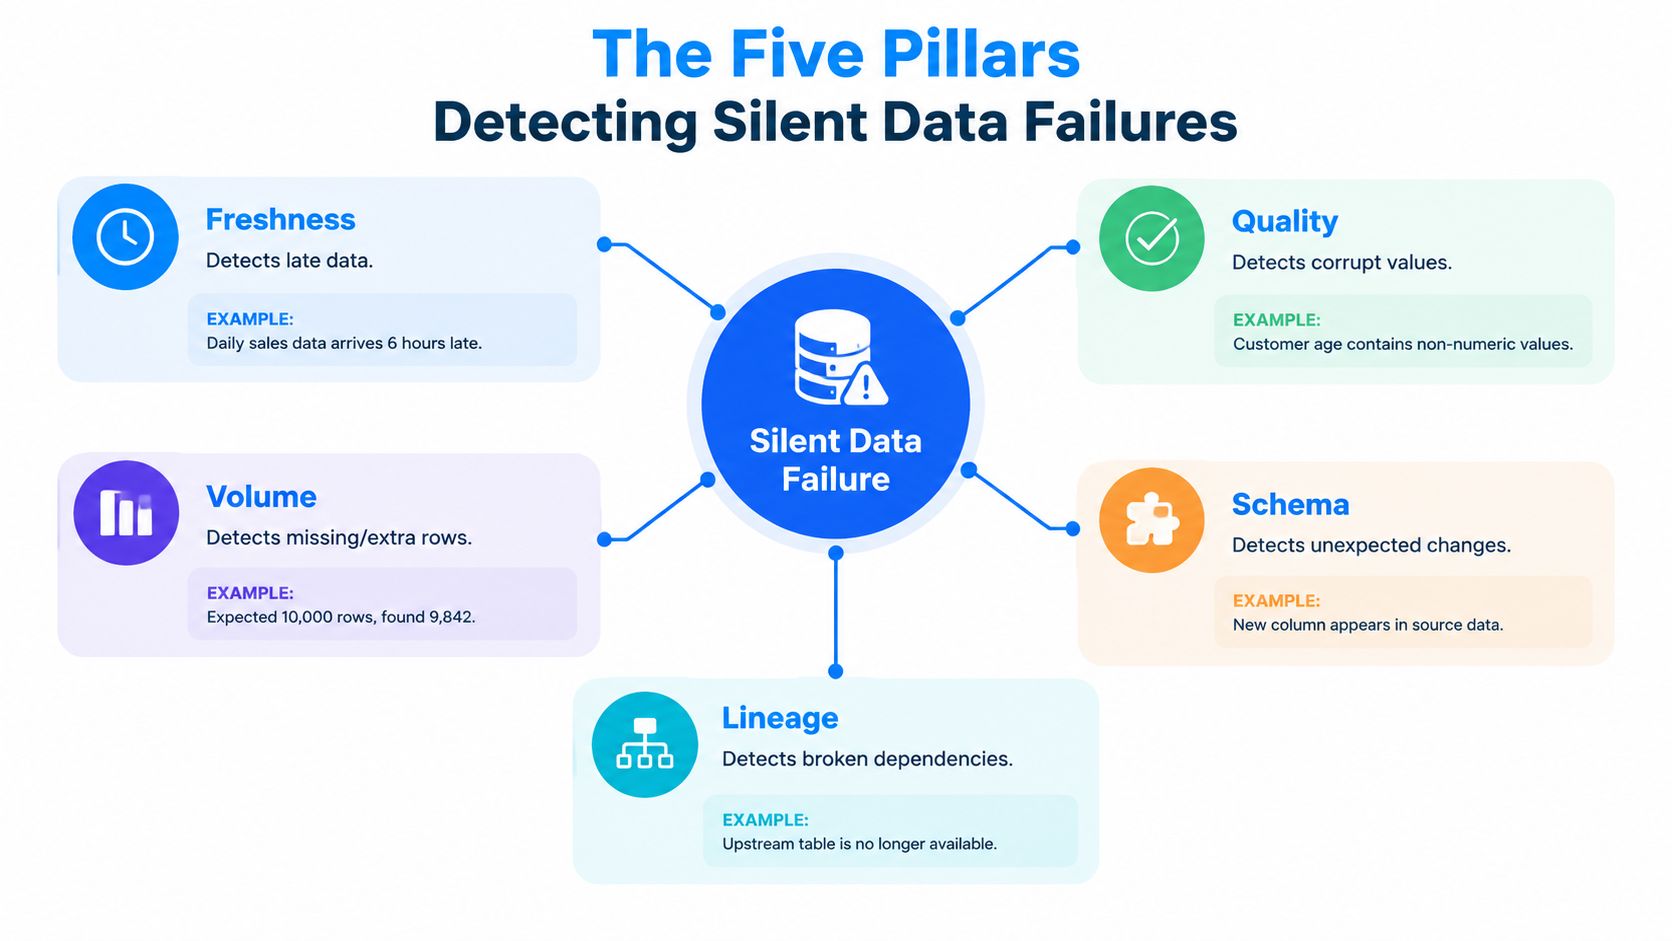
Freshness
Freshness asks whether data is current enough for its intended use. It isn't limited to checking whether a job ran. A successful job can still deliver data late, miss a partition, or publish an incomplete extract.
Freshness means timeliness. Monitor arrival and processing against historical behavior or an explicit service expectation, then treat delays as potential source or ingestion failures.
A useful check compares actual arrival time with the expected schedule. The system should also distinguish late delivery from early delivery when that distinction matters. An early file may indicate a source process changed, even if the data appears available.
Quality
Quality checks validate records and values against business or technical expectations. Examples include required fields, valid ranges, referential relationships, permitted categories, and consistency between related datasets. These rules are especially important for regulated reporting and critical operational workflows.
Quality isn't a single score. Teams should define which dimensions matter for each use case, then connect failed checks to the affected asset and owner. A rule for a financial transaction table may differ from one for an exploratory dataset. More detail on organizing these dimensions appears in digna's guide to the dimensions of data quality.
Volume
Volume checks look for missing, duplicated, or unexpectedly expanded data. A row-count change may indicate an incomplete load, a source outage, a join problem, or a legitimate business event. The check becomes more useful when it considers historical patterns and downstream dependencies rather than applying one universal threshold.
Schema
Schema monitoring tracks structural changes such as added or removed columns, renamed fields, and changed data types. It often provides an early warning because structural changes can break transformations, dashboards, contracts, or model features before anyone notices a visible reporting error.
Teams should classify expected and unexpected changes. A controlled migration may add a column intentionally, while an upstream API may alter a type without notice. The same event needs different routing depending on ownership, environment, and downstream usage.
Lineage
Lineage shows how data moves from source to transformation to consumption. It turns an isolated alert into an impact map. If a source table changes, lineage can reveal which derived tables, reports, metrics, or AI inputs depend on the affected field.
End-to-end observability connects source events with downstream impact across ingestion, transformation, storage, and consumption (pipeline observability research). Without lineage, teams may detect a problem quickly but still spend too long deciding where to start.
Where Observability Should Run and How to Deploy It
A pipeline can detect a failed quality check and still create governance, cost, or portability problems. The most consequential architecture decision concerns where computation, metadata, and alerting should live, more than which checks to enable. In-database designs calculate compatible checks inside the warehouse or data platform. External designs extract data or metrics into a separate service for processing.
In-database execution can run jobs inside systems such as Databricks, SAP HANA, or Snowflake, keeping processing within the SQL warehouse instead of moving data out for analysis (pushdown observability guidance). This approach resembles inspecting goods at the factory: the data stays near its source, while the platform absorbs the workload. External execution creates a centralized operating model, but it may require broader permissions, connectors, and data movement. Teams building their data platform engineering practice should treat this placement decision as part of platform design.
Criterion | In-Database Execution | External Execution |
|---|---|---|
Governance | Checks operate within existing data access boundaries and policies. | A separate service may need permissions to extract or inspect data. |
Data movement | Metrics and validation can be computed where the data resides. | Data or profiling results move to an external processing layer. |
Cost control | Uses warehouse or platform compute, so workload governance matters. | Adds separate infrastructure or service costs, while reducing some in-platform work. |
Portability | Works well when supported engines and SQL patterns are consistent. | Can centralize logic across heterogeneous systems, but may create service dependency. |
Security | Supports data locality and minimizes exposure of production records. | Requires careful controls for extraction, storage, encryption, and retention. |
Performance | Benefits from local data access and engine optimization. | May introduce transfer, scheduling, or serialization overhead. |
Operations | Teams manage workload impact inside each platform. | Teams manage connectors, extraction reliability, and external capacity. |
Match deployment to the environment
Private cloud, VPC, and on-premises options matter when data residency, network, or access rules restrict deployment. A regulated organization may install the observability system inside its own cloud account, VPC, or data center, keeping production data within an approved boundary.
Portability deserves the same attention. Open and interoperable approaches, including OpenTelemetry adoption, observability-as-code, and tool consolidation, appear as priorities in recent observability trend coverage (IBM observability trends). For data teams, portability means retaining metadata, policies, lineage, and operational history when platforms change. Exporting dashboards alone does not preserve that operating context.
Before choosing, ask three questions:
Can the platform observe every critical environment without forcing data relocation?
Who pays for the compute used by profiling and anomaly detection?
Can governance teams audit the checks, permissions, outputs, and retention model?
A technically accurate alert is insufficient if the architecture increases access risk or produces an unpredictable bill. Choose the design that balances detection quality with data locality, portability, and operational control.
From Technical Signals to Business Impact With Real Examples
A freshness alert becomes more useful when it connects to a business process. A schema alert becomes urgent when it identifies a field used by a regulatory report or an AI feature. A platform workload signal becomes actionable when it explains which team, query pattern, or data product is consuming resources.
That connection comes from combining lineage, usage metadata, ownership, business definitions, and observability signals into a contextual dependency graph. The graph doesn't replace technical checks. It gives each check a place in the operating model.

Financial services
A transaction dataset may pass a basic pipeline completion check while failing a business rule or arriving after a reporting window. Data Quality Management combines validation, anomaly detection, timeliness tracking, and schema monitoring to identify the issue. Lineage then shows whether the affected records feed risk calculations, regulatory reporting, or downstream reconciliation.
The response priority should reflect that impact. A deviation in an unused analytical table isn't equivalent to a structural change in a dataset used by a critical financial process.
Healthcare
Healthcare teams often need reliable clinical, operational, and regulatory data across systems with different ownership and delivery patterns. A late extract may delay an operational view, while a changed field type may break a downstream integration. Freshness, validation, schema tracking, and lineage provide different evidence for the same investigation.
The architecture should keep sensitive data within approved environments while exposing enough metadata for authorized teams to understand status and responsibility.
Telecommunications and public sector
A telecommunications platform may monitor customer and operational data for unusual volume, availability, or distribution behavior. A public-sector organization may prioritize traceability, consistency, and audit-ready evidence across long-running data processes. In both settings, the important design choice is to connect technical events to service obligations and accountable owners.
Business Monitoring can also evaluate KPIs directly on underlying data. Data Platform Observability adds a related view of workloads, consumption, availability, and platform behavior. Observability is increasingly part of cost management and open standards strategy, not just a dashboard layer.
AI readiness
AI teams need more than a clean table at training time. They need lineage from source data through transformations, features, training inputs, and model outputs. If a source schema changes or a freshness delay affects a feature pipeline, the dependency graph should reveal which model inputs may be stale or structurally incompatible.
The useful question is no longer only, “Did the check pass?” It's, “Which business outcome, operational process, or AI input depends on this signal, and who can act on it?”
Your Roadmap to Implementing Data Observability Architecture
Start with a narrow scope and a clear owner. A broad rollout without priorities produces noise before the team understands how to respond.
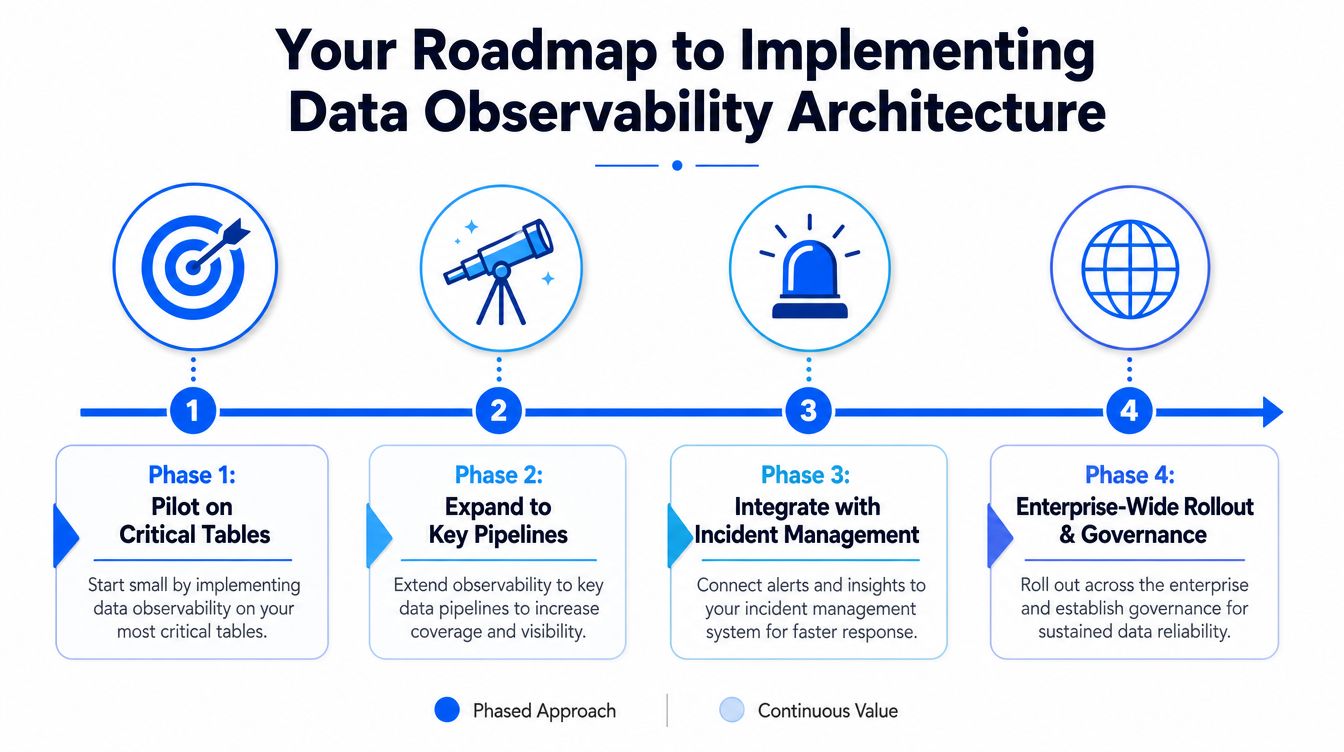
Phase one, pilot critical tables
Choose datasets that support important reporting, operations, governance, or AI workflows. Establish expected delivery behavior, basic volume patterns, schema expectations, and a small set of business validations. Assign an owner for every alert before enabling notifications.
Phase two, expand to key pipelines
Add upstream and downstream coverage so the team can trace failures rather than seeing isolated table symptoms. Include lineage, usage, and ownership metadata, then compare in-database and external execution for the environments in scope.
Phase three, connect incident management
Route alerts to the teams responsible for remediation. Record the affected assets, suspected cause, business impact, status, and resolution. Review recurring incidents to identify architectural fixes instead of repeating manual recovery.
Phase four, establish enterprise governance
Standardize policies for freshness, schema changes, validation, access, retention, and escalation. Expand across warehouses, lakes, pipelines, and on-premises environments while reviewing portability and compute consumption. A modular implementation can begin with one capability and grow through a base fee plus per active table per module model, rather than requiring every use case at the outset.
A user-centric dashboard should serve engineers, analysts, and governance stakeholders with different views of the same underlying context. Teams looking for practical guidance can use this data quality implementation framework to define ownership, controls, and rollout priorities.
The strongest architecture treats detection quality, governance, portability, and bill control as one design problem. Start with a critical data product, measure how well the team can detect and explain failures, then expand only when the operating model is ready.
digna provides an enterprise data quality and observability platform with in-database execution, anomaly detection, timeliness monitoring, validation, schema tracking, and business and platform monitoring. Visit digna to see how an architecture that keeps data in place can support reliable analytics, governance, and AI across your data environment.
Frequently asked questions
What is data observability architecture?
The arrangement of execution, collection, metadata, analysis and action that lets a team understand the current and expected state of data across its full lifecycle. The useful analogy is a car dashboard: not more gauges, but the arrangement that makes a driver act correctly.
Why isn't traditional monitoring enough?
Because it answers operational questions such as whether a server is available, a job finished or a process returned an error. None of those explain a table that arrived on time, completed successfully and still carries the wrong values, which is the failure that reaches a decision.
Where should observability computations run?
That is the key design choice in the data plane. Running checks where the business data already originates keeps context close to the failure, avoids unnecessary movement, and matters most where privacy and operational load constrain what can leave the environment.
Who benefits from good observability architecture?
Four groups with different needs: data engineers locating a failure without searching disconnected tools, analytics engineers needing confidence in structurally valid inputs, governance leaders needing evidence that controls apply continuously, and AI teams needing traceability from source records through features and model inputs.
How large is the data observability market?
One 2026 industry estimate values it at USD 3.51 billion, projecting USD 6.03 billion by 2031 at an 11.42% CAGR across 2026 to 2031. The growth reflects governance, reliability and operational accountability increasingly overlapping rather than a passing tooling trend.


