8 Data Observability Use Cases for Reliable Data
|
9
min read

The first failure in a data environment often isn't a crashed pipeline. It's a dashboard that refreshes successfully with incomplete data, a model that receives structurally valid but behaviorally changed inputs, or a KPI that moves outside its normal pattern without an assigned investigator. A widely cited survey found that monthly data incidents increased from 59 in 2022 to 67 in 2023, while 68% of respondents said data incidents took at least four hours to detect in 2023, up from 62% in 2022. The same survey reported a 166% increase in average time to resolution, reaching 15 hours per incident (Business Wire coverage of the Monte Carlo survey).
That evidence clarifies the purpose of data observability. Teams need to monitor data behavior, delivery, structure, business meaning, and platform operations, then connect each signal to a named owner and a response path. The following eight data observability use cases organize reliability work by the failure a team needs to prevent. Each one identifies the responsible role, the signal, a representative incident, relevant digna modules, and the next action. digna runs inside the customer's environment and combines anomaly detection, timeliness, validation, schema tracking, business monitoring, and platform observability without moving production data.
Table of Contents
1. Stale and Broken Dashboard Detection
A dashboard can be available while its decisions are already unsafe. The visual layer may load, but an upstream table might contain a missing partition, a delayed delivery, or a metric distribution that no longer reflects current operations. That makes stale dashboard detection one of the most direct data observability use cases for analytics and business teams.
The primary owner is usually the analytics engineer or BI developer, with the data engineer responsible for the upstream pipeline. The signal combines freshness, volume, completeness, and distribution. A dashboard alert should identify which dataset is late or incomplete, which metric changed, and which downstream reports depend on it.
A financial institution might detect that a daily risk dashboard didn't refresh because an upstream ETL process delivered late. A healthcare operations team could identify missing patient-volume data before staffing decisions rely on an incomplete view. A retail analytics team might catch partial sales data before executives review daily KPIs.

Detection must lead to diagnosis
digna's Data Anomalies and Timeliness modules can learn expected arrival patterns and metric behavior, then flag missing loads, delayed deliveries, and unusual values. Its in-database execution keeps analysis within the customer's databases, while the shared dashboard gives engineers and stakeholders a common incident view. Teams can use digna's guide to data timeliness to define the delivery signals that matter most.
Start with the dashboards that influence risk, care operations, revenue, or executive decisions. Route alerts to pipeline owners rather than sending every notification to a broad data group. Review baseline behavior during initial deployment, because a useful alert reflects the dataset's actual cadence rather than an arbitrary schedule.
Practical rule: A dashboard alert should state whether the failure is late delivery, incomplete volume, or changed metric behavior. Those conditions need different investigations.
2. Undetected Data Shift and Model Drift Prevention
A pipeline can run without errors and still deliver data that no longer represents the behavior a model or decision process expects. Distribution changes are especially difficult to catch with job-status monitoring because the infrastructure reports success while the content has shifted.
The responsible roles are the data scientist, ML engineer, and data engineer. They should monitor feature distributions, category frequencies, null behavior, transaction patterns, and other signals that describe the input population. The incident might be an e-commerce platform seeing a change in purchase behavior that weakens demand forecasting, or a telecom provider noticing a shift in churn patterns before a model becomes unreliable.
Healthcare teams may see an unexpected change in admission rates that requires operational investigation. Financial services teams may detect unusual transaction patterns that could reflect a pipeline issue, a genuine business event, or a fraud signal. Observability doesn't decide which explanation is correct. It shortens the path from unusual behavior to the person who can test the explanation.
Use baseline learning before manual thresholds
digna's Data Anomalies module applies continuous baseline learning to dataset behavior, while Data Analytics helps teams review historical patterns, volatility, and recurring changes. The digna model drift detection resource is relevant when teams need to connect data changes with model monitoring rather than treating them as separate incidents.
A practical alert should include the affected dataset, the model or decision process that consumes it, the changed signal, and the escalation owner. Engineers can then compare the anomaly with model performance, deployment history, source-system changes, or seasonal behavior. If alerts are sent into an ML monitoring platform, the team can investigate input drift and output degradation through one incident path.
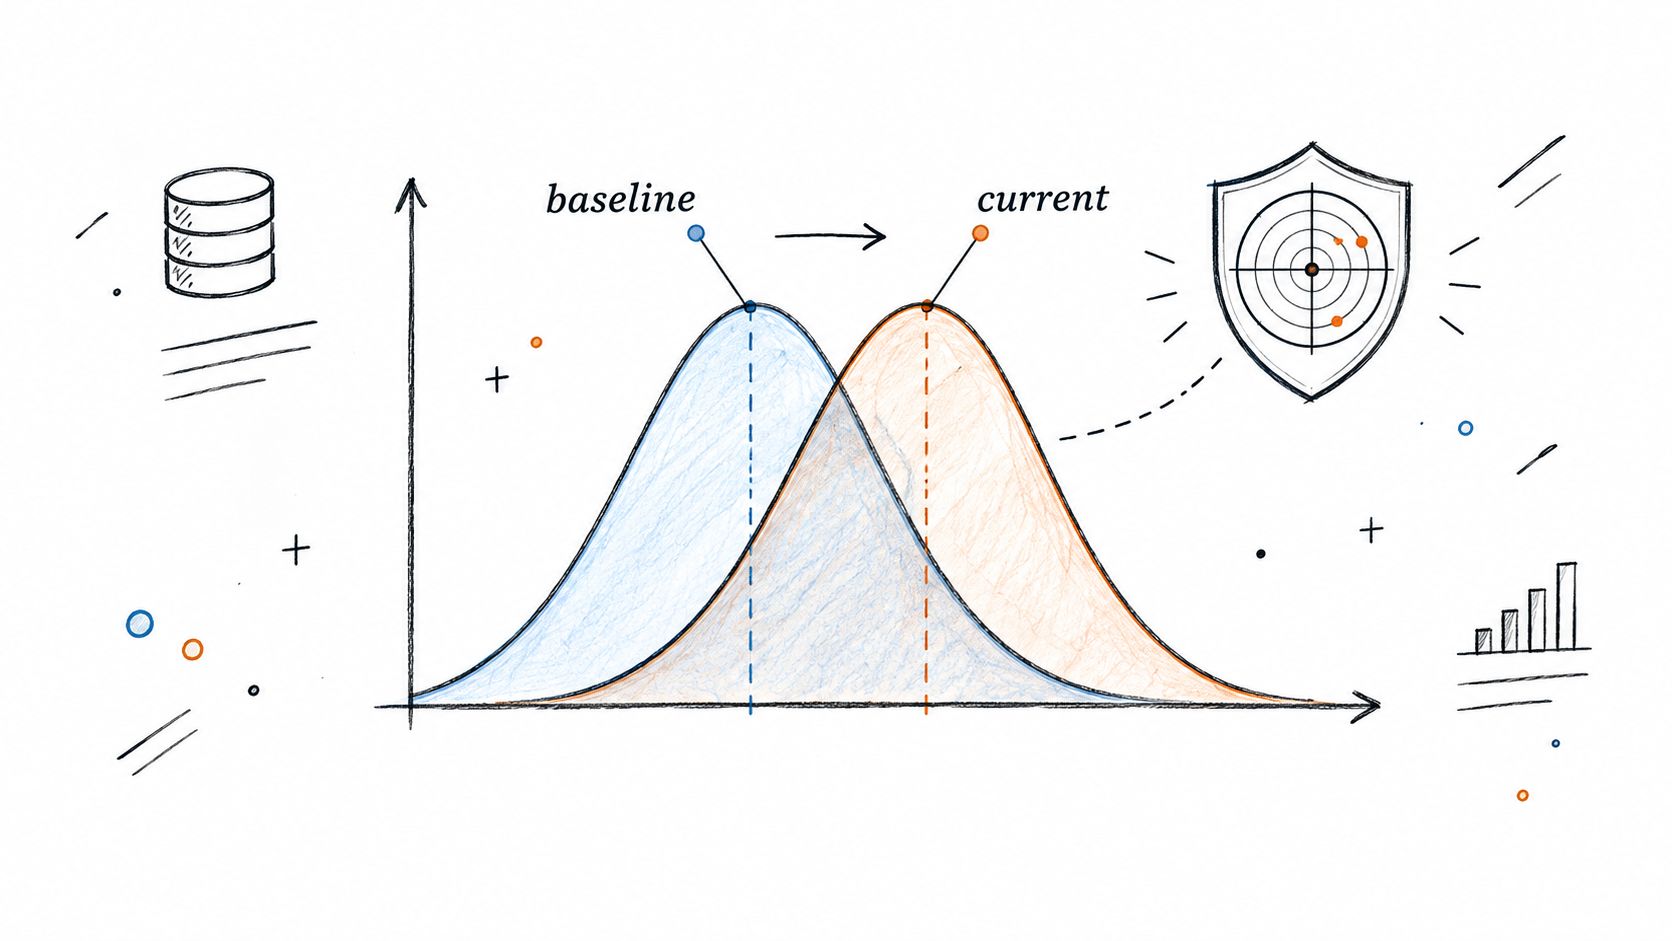
The strategic risk is not just model accuracy. A changed input can alter forecasts, prioritization, fraud review, care planning, or customer treatment before anyone labels the event a model incident.
3. Pipeline Delivery Delay and SLA Monitoring
Late data creates a different failure from bad data. A transformation may be correct, and the source may be available, but the table arrives after the business process needs it. That makes timeliness a business control, not only an engineering metric.
The owner is the data platform engineer or pipeline owner. The signal is expected delivery time compared with actual arrival, supported by load presence, execution duration, and historical cadence. For example, a table expected to refresh hourly can trigger an alert when it hasn't updated for more than 2 hours, turning a vague late-data complaint into a defined incident threshold (DataDriven's data observability explanation).
A bank might need nightly risk data before a risk committee meeting. A healthcare provider may depend on daily patient data for operational dashboards. A telecom company could monitor high-volume customer loads that support provisioning, while a retailer may require sales data before morning reporting.
Treat delivery as an operational contract
digna's Timeliness module learns schedules and expected delivery windows, then flags delays, missing loads, and early deliveries. Teams can use digna's AWS data pipeline monitoring resource when they need to align timeliness monitoring with cloud pipeline operations.
The next action should be explicit. Configure escalation when the expected delivery time is exceeded, send the incident to the pipeline owner, and integrate the alert with incident management. Trend expected delivery times as well as individual misses. A gradual deterioration may reveal capacity or dependency problems before a complete failure occurs.
A delivery SLA is useful only when someone owns the breach, understands its downstream impact, and knows when to escalate it.
Detection identifies the missed window. Diagnosis checks the orchestrator, source system, dependency chain, and load state. Response may involve rerunning a job, contacting a source owner, or marking downstream outputs as temporarily untrusted.
4. Schema Change Detection and Breaking Change Prevention
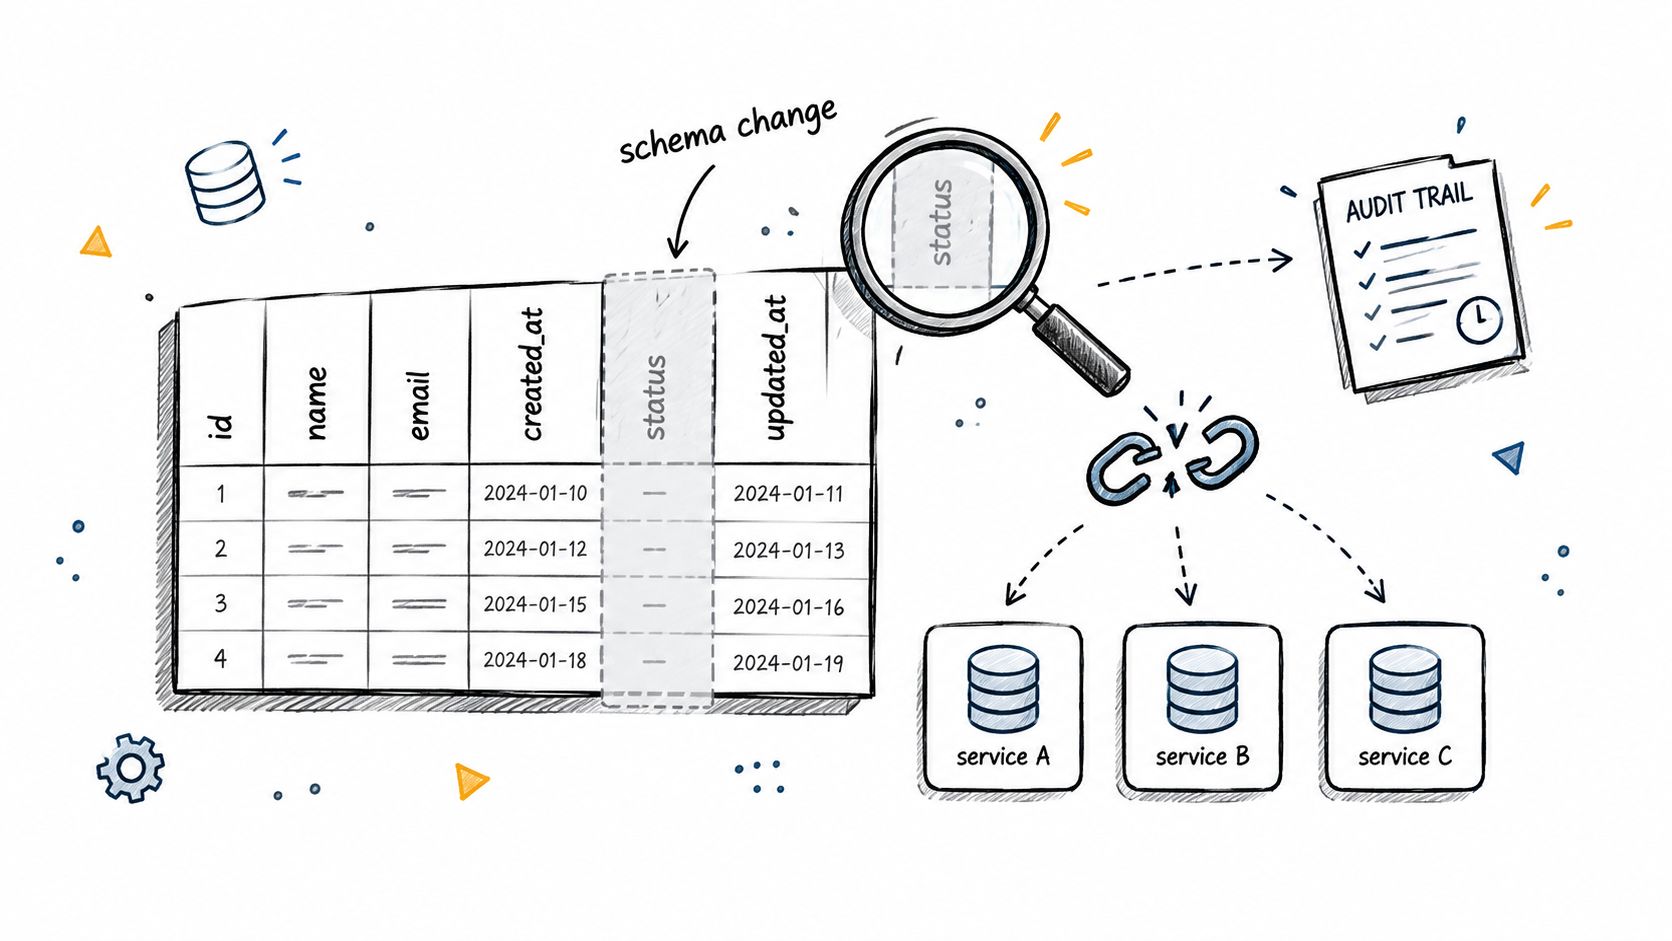
Structural changes are dangerous because they can break consumers without looking like operational failures. Added columns, dropped columns, renamed fields, type changes, and nullable or non-nullable flips can cause missing values, type coercion, failed transformations, or incorrect joins even when a pipeline reports successful execution (Ataccama's explanation of schema and data observability).
The data engineer or analytics engineer owns the response, while source-system owners should approve intentional changes. The signal is a comparison between the current schema and the expected structure. A representative incident could involve a source application adding an unannounced column, changing a customer identifier from string to integer, or removing a field used in a risk calculation.
Healthcare IT teams face an additional control problem when clinical data structures evolve without clear communication. The immediate technical issue may be a failed transformation, but the wider risk is loss of traceability over which version of the data supported a report.
Detect change before consumers discover it
digna's Schema Tracker continuously monitors structural properties and alerts teams when schemas drift. The digna Schema Tracker module can support a workflow in which teams document expected schemas, route alerts to downstream owners, and review whether a change was intentional.
Diagnosis requires more than confirming that a column changed. Engineers should identify affected tables, transformations, dashboards, models, and regulatory outputs. The next action may be to update a contract, restore compatibility, revise a transformation, or formally approve the change. Link schema alerts with catalog and governance processes so structural decisions don't remain in private messages or undocumented tickets.
A schema alert is therefore an impact-control signal. It tells the team not only that a structure changed, but that a downstream dependency may now require review.
5. Business KPI Monitoring and Anomaly Alerting
Technical checks can pass while the business outcome looks wrong. A warehouse may receive data on time, preserve its schema, and complete every transformation, yet revenue, order value, customer volume, churn, or treatment outcomes may move outside expected behavior.
The responsible owner is the business analyst or operational stakeholder, supported by analytics engineering. The signal is a business metric compared with its historical behavior, seasonality, volatility, and relevant data conditions. A retail organization could detect an unusual revenue drop and begin investigating before the issue reaches a formal performance review. A telecom team might notice abnormal churn, while a financial services group investigates a transaction-volume change that could reflect fraud or a system issue.
Put business meaning beside technical context
digna's Business Monitoring solution applies anomaly detection to metrics stored in the warehouse or lake. Its Data Analytics module helps teams understand historical KPI patterns, trends, and volatility, while the digna business monitoring system provides a focused path for monitoring business behavior.
Start with KPIs that have a clear decision owner. Define what action follows an alert, such as checking source completeness, validating a promotion, reviewing transaction controls, or contacting an operational team. Avoid treating every movement as an incident. Sensitivity should reflect the metric's normal variation and the consequence of a missed anomaly.
Ownership test: If nobody can name the decision that changes after a KPI alert, the metric probably isn't ready for continuous monitoring.
Diagnosis connects the business movement to data quality, source events, product changes, or genuine market behavior. Response then belongs to the team that can correct the underlying condition, not necessarily the team that maintains the dashboard.
6. Business Rule Enforcement and Compliance Validation
Anomaly detection asks whether data behaves differently from its baseline. Validation asks whether each record satisfies a known business, logical, or compliance rule. Both are necessary because a dataset can look statistically normal while violating a required condition.
The owner is usually the head of data quality, data steward, compliance team, or domain subject-matter expert. Signals include required-field presence, valid segments, value ranges, date sequences, referential integrity, and other deterministic constraints. A financial services team might validate that transactions contain mandatory fields and remain within compliance thresholds. Healthcare teams may check that records satisfy reporting requirements before submission. Telecom providers can validate billing records against rate-plan rules, while public agencies can test audit and traceability conditions.
Make validation evidence operational
digna's Data Validation module performs record-level checks against documented business rules. Teams should start with regulated or high-risk domains, involve subject-matter experts when designing rules, and record which datasets passed or failed. The data catalog can provide a shared view of validation status and help analysts distinguish data that is fit for use from data that requires review.
Detection identifies records that violate a rule. Diagnosis determines whether the rule, source, transformation, or business process caused the failure. Response may involve quarantining affected records, correcting the source, approving an exception, or documenting remediation for audit review.
Independent guidance on pipeline observability emphasizes that monitoring must assess output quality, including record counts, field-distribution changes, and schema changes, rather than relying only on job success (guidance on data-level pipeline monitoring and controls). That distinction matters in compliance-sensitive environments, where a completed job isn't sufficient evidence that the output is reliable or auditable.
7. Data Platform Observability and Consumption Monitoring
Data platform teams can inherit reliability problems from resource behavior rather than from data content. A workload spike, inefficient query, runaway pipeline, unused table, or unexpected storage trend can reduce availability and make downstream delivery less predictable.
The responsible role is the data platform engineer. Signals include workload patterns, query volume, processing capacity, pipeline execution time, availability, storage growth, and consumption changes. A cloud warehouse team might find unused tables that complicate storage management. An analytics engineer could identify queries consuming excessive resources and optimize the SQL. A platform team might detect an abnormal consumption pattern caused by a runaway pipeline.
Monitor the infrastructure behind the data
digna's Data Platform Observability solution focuses on platform health, behavior, consumption, and operational changes. Its Data Analytics module can help teams trend platform metrics and distinguish a one-off spike from a developing capacity issue. Share platform dashboards with data consumers so engineers aren't the only people who can see the consequences of inefficient usage.
The next action depends on the signal. A query anomaly may require SQL optimization. A storage trend may require lifecycle management or ownership review. A pipeline execution change may require capacity analysis, dependency investigation, or schedule adjustment. Establish normal workload baselines, route severe alerts to platform owners, and use consumption trends to inform infrastructure planning.
This use case also exposes a prioritization problem. A 2025 observability survey found that only 13% of collected telemetry was actively used for monitoring, alerting, or troubleshooting, while 84% of companies used less than a quarter of what they collected (Sawmills AI observability report). More telemetry doesn't automatically create more reliability. Teams need to select signals that lead to a decision.
8. Regulatory Compliance and Audit-Ready Data Governance
Regulated organizations need more than a clean dashboard on the day an auditor asks for evidence. They need continuous oversight of critical data quality, validation, timeliness, structural changes, ownership, and control history.
The responsible roles are the data governance lead, compliance officer, internal auditor, and domain data owner. The signals combine validation outcomes, delivery status, schema history, data quality anomalies, and evidence that controls operated as designed. A bank may need to show that regulatory reporting data met defined requirements and arrived on time. A healthcare organization may need traceability for sensitive clinical data. A government agency may need to demonstrate that critical data remained subject to documented controls within the required environment.
Connect control monitoring to evidence
digna combines Data Validation, Schema Tracker, Timeliness, and in-database execution for this purpose. Its private-cloud or on-premises deployment options keep sensitive data inside the customer's cloud, VPC, or data center. That architecture supports governance requirements where moving production data to an external monitoring service isn't acceptable.
Compliance teams should identify the data domains requiring continuous oversight, document rules in the governance platform, and establish recurring review cycles. The next action for each alert should specify whether the issue requires remediation, exception approval, evidence retention, or escalation. The resulting record should help an auditor understand what was checked, when it was checked, what failed, who investigated it, and how the organization responded.
The market context shows why this has become a platform concern rather than a narrow quality task. Research estimates the data observability market at USD 2.94 billion in 2025 and projects USD 6.02 billion by 2030, representing a 15.4% CAGR, with North America commonly identified as the largest market and Asia Pacific as the fastest-growing region (The Business Research Company market report). Adoption is spreading because governance, reliability, and operational accountability increasingly overlap.
For additional perspective on building privacy and compliance controls, see Insights from Nexus IT Group.
Data Observability: 8 Use Cases Compared
Feature | 🔄 Implementation Complexity | ⚡ Resource & Speed | ⭐ Expected Effectiveness | 📊 Key Outcomes / Impact | 💡 Ideal Use Cases |
|---|---|---|---|---|---|
Stale and Broken Dashboard Detection | Moderate, AI baseline tuning period required | Moderate resources; in-database execution; real-time alerts | ⭐⭐⭐⭐ | Reduce dashboard outages; shorter time-to-resolution for stale data | Critical dashboards, executive reports, finance, retail, healthcare |
Undetected Data Shift and Model Drift Prevention | High, needs historical data and sensitivity tuning | Moderate–high compute for distribution analysis; continuous monitoring | ⭐⭐⭐⭐ | Early detection of drift; protects ML model performance | Forecasting, fraud detection, churn models, ML pipelines |
Pipeline Delivery Delay and SLA Monitoring | Moderate, learns schedules and EDTs | Low–moderate resources; fast detection; reduces MTTD ⚡ | ⭐⭐⭐⭐ | Enforce SLAs; timely delivery alerts; fewer missed loads | Nightly jobs, time-sensitive reporting, regulated deadlines |
Schema Change Detection and Breaking Change Prevention | Low–Moderate, establish baseline schema then continuous checks | Low resources; immediate detection of structural changes | ⭐⭐⭐⭐⭐ | Prevent silent failures; reduce debug time; schema audit trail | Dynamic sources, ETL pipelines, analytics engineering |
Business KPI Monitoring and Anomaly Alerting | Moderate, requires KPI definition and seasonality baselines | Moderate resources; user-facing dashboards; timely alerts | ⭐⭐⭐⭐ | Detect business-impacting anomalies; reduce alert fatigue | Revenue monitoring, product metrics, operational KPIs |
Business Rule Enforcement and Compliance Validation | High, upfront rule definition and ongoing maintenance | Moderate–high resources for record-level checks; audit logging | ⭐⭐⭐⭐⭐ | Continuous rule enforcement; audit-ready evidence; fewer downstream errors | Regulated domains (finance, healthcare), billing, compliance reporting |
Data Platform Observability and Consumption Monitoring | High, integrates platform metrics, workload baselines | Moderate resources; ongoing telemetry; enables cost optimization | ⭐⭐⭐⭐ | Capacity planning; cost savings; detect performance bottlenecks | Cloud warehouses, platform teams, chargeback models |
Regulatory Compliance & Audit-Ready Data Governance | Very High, cross-module integration and governance alignment | High resource and process effort; in-database & private deployments | ⭐⭐⭐⭐⭐ | Audit-ready evidence; reduced compliance risk; data sovereignty | Banks, healthcare, public sector, regulated reporting workflows |
Turn Alerts Into a Reliability Operating Model
The eight data observability use cases become useful when a team adopts them in an order that matches business risk. Start with critical datasets and delivery signals. If teams don't know whether essential tables arrived, or whether dashboards are complete, anomaly and KPI monitoring will produce confusing symptoms instead of actionable incidents.
Next, add behavioral anomaly detection and schema monitoring. These controls address failures that job-status checks miss, including distribution shifts, missing values, and structural changes. For AI-dependent environments, this foundation is increasingly important. In 2025, AI monitoring adoption rose from 42% to 54% of organizations, while 73% still lacked full-stack observability and the average number of observability tools fell from 6 to 4.4 as teams consolidated platforms (Databahn's observability survey findings). The practical implication is clear. Teams need one investigation workflow that relates dataset health, feature behavior, model signals, and business outcomes.
Then extend coverage into validation, business KPIs, platform consumption, and regulatory evidence. Validation protects known rules. Business monitoring protects decisions. Platform observability protects the infrastructure that delivers and serves data. Governance monitoring turns operational activity into evidence that compliance and audit teams can review.
Every alert should have five attributes:
Named owner: Identify the person or team responsible for investigation.
Severity: Connect priority to business impact, not only technical deviation.
Detection signal: State whether the trigger concerns freshness, volume, distribution, schema, validation, KPI behavior, or platform consumption.
Investigation path: Link the alert to the source, pipeline, table, metric, model, or downstream consumer that needs examination.
Escalation route: Define when the owner must involve platform, business, compliance, or incident-response teams.
digna supports this operating model through modular licensing, allowing organizations to start with one module and expand across active tables and monitoring needs. Its in-database execution and private-cloud or on-premises deployment options keep production data in the customer's environment. The platform includes a scheduler, data catalog, integrations, and collaboration features from the initial module selection, giving engineering and governance teams a shared place to review incidents and trends.
Choose the first assets by asking practical questions. Which tables feed the most consequential dashboards or models? Which deliveries have the strongest time dependency? Which schemas change without reliable communication? Which records carry regulatory or financial risk? Which KPIs trigger operational decisions? Which platform workloads threaten availability or resource control?
Monitor those tables and metrics first. Assign the owner before enabling the alert. Define the response before measuring coverage. Reliability improves when observability signals become managed work, not another stream of telemetry that nobody has time to use.
digna offers in-environment data observability through anomaly detection, timeliness monitoring, schema tracking, record-level validation, business monitoring, and platform observability. Visit digna to evaluate how its modular, in-database platform can connect these data observability use cases to named owners and actionable response paths.
For the measurement layer underneath these use cases — freshness, completeness, schema stability, validity and distribution drift, and the thresholds that belong in a delivery contract — see data quality reliability.
Frequently asked questions
What are the main data observability use cases?
Eight cover most reliability work: stale dashboard detection, data shift and model drift, pipeline delivery delays, schema change detection, business KPI anomalies, business rule validation, platform and consumption monitoring, and audit-ready governance. Each pairs a signal with a named owner and a defined response path.
How is data observability different from pipeline monitoring?
Job-status monitoring reports that a pipeline ran; observability asks what it delivered. A transformation can succeed on three missing partitions, and a renamed column can pass through a compatibility path while its null rate climbs. The dashboard refreshes successfully in both cases.
Which data observability use case should a team start with?
Start with critical datasets and delivery signals. If nobody knows whether essential tables arrived or whether dashboards are complete, anomaly and KPI monitoring produce confusing symptoms instead of actionable incidents. Behavioral anomaly detection and schema monitoring come next, then validation, KPIs, platform consumption and regulatory evidence.
Why do schema changes cause silent failures?
Added, dropped, renamed or retyped columns rarely stop a pipeline. They cause missing values, type coercion and incorrect joins while execution still reports success. A schema alert is an impact-control signal, so it should name the affected tables, transformations, dashboards, models and regulatory outputs, not only the column.
What makes a data observability alert actionable?
Five attributes: a named owner, a severity tied to business impact, the detection signal, an investigation path to the source or consumer, and an escalation route. Volume alone does not help. One 2025 survey found that only 13% of collected telemetry was actively used for monitoring or troubleshooting.


