How to Audit Data Quality in Enterprise Pipelines
|
8
min read

Your risk dashboard looks normal until someone notices that the latest figures haven't changed since Friday. The pipeline is green, warehouse queries still run, and no alert has fired. In another team, a source application adds a column, downstream logic accepts the altered structure, and a patient-volume metric becomes incomplete. The failure isn't dramatic. It appears as a plausible number that nobody has challenged.
That's the operational reality of audit data quality in enterprise pipelines. Static checklists can confirm that documentation exists, but they often miss delayed loads, schema drift, invalid business states, and gradual data changes that degrade analytics or AI models. A useful audit has to connect measurable quality dimensions with the way data moves, changes, and gets consumed.
Table of Contents
Why Data Quality Audits Fail in Modern Pipelines
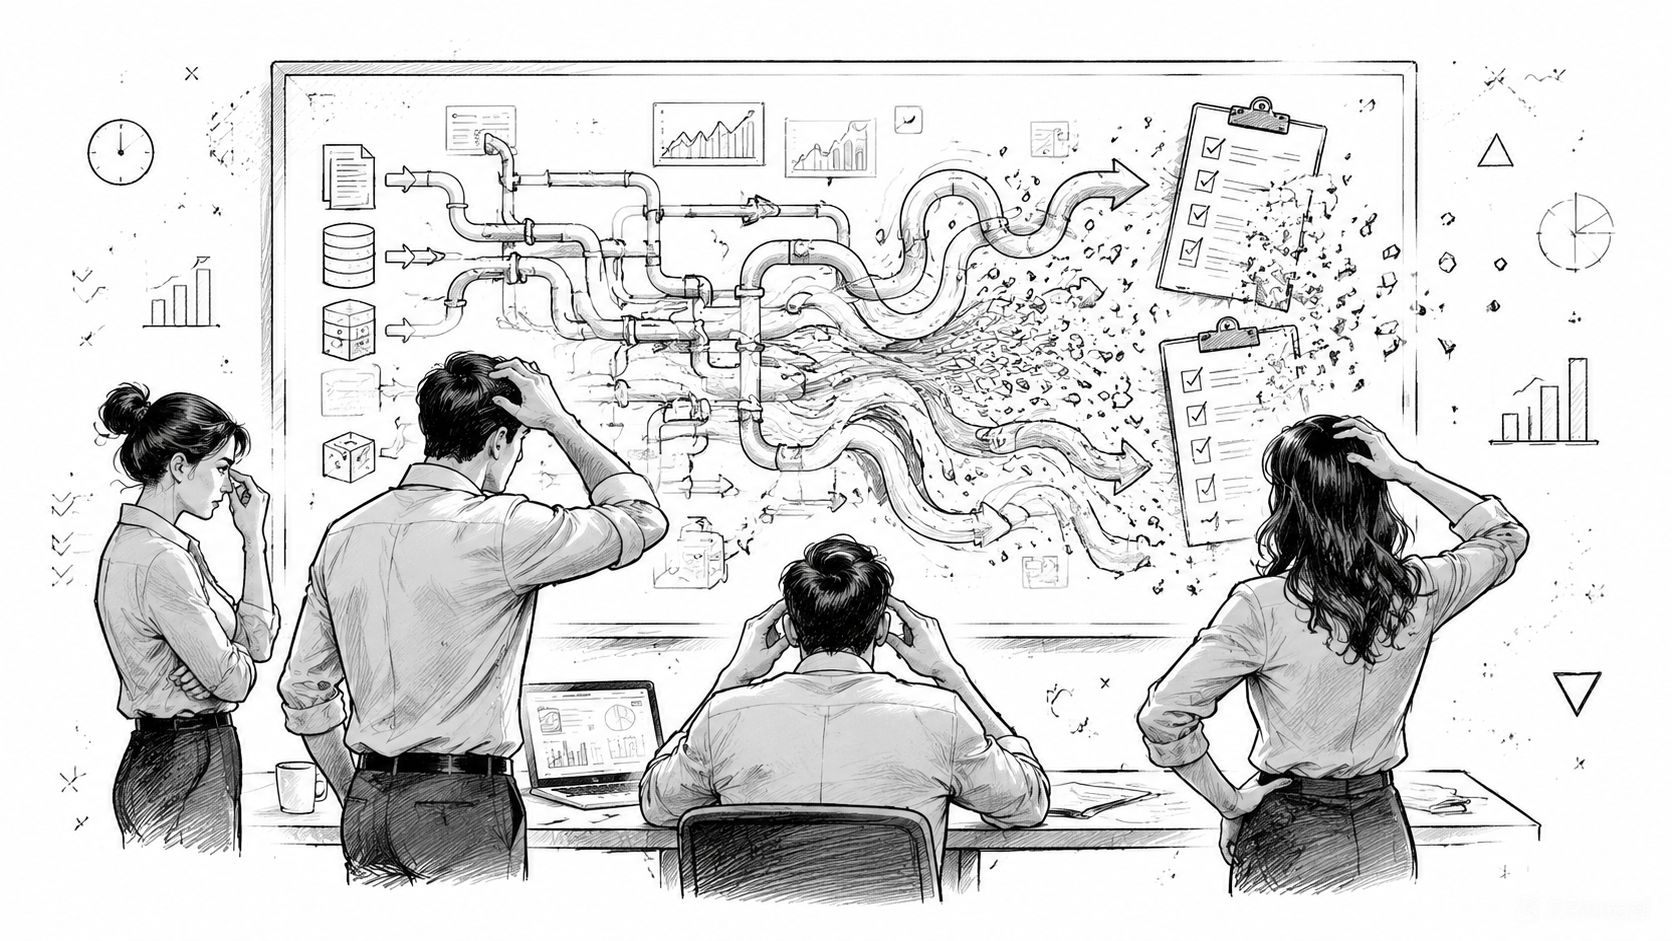
Traditional audits often begin with a warehouse snapshot. The team checks whether required fields are populated, reconciles selected totals, and samples records against a policy document. That approach can work for a stable reporting table. It breaks down when the underlying pipeline changes hourly, when multiple consumers interpret the same field differently, or when an upstream system delivers yesterday's data without declaring a failure.
A finance team may discover that its risk dashboard has been stale for several days because the ingestion job completed successfully with no new records. A healthcare analytics team may find that a source-system change altered a field type, leaving downstream transformations technically executable but semantically wrong. In both cases, the records can look valid in isolation. The defect lives in timeliness, structure, lineage, or business meaning.
The gaps static checklists leave behind
High-level completeness checks won't tell you whether a critical load arrived late, whether a new column bypassed governance, or whether a transaction violates a rule while still matching the expected data type. Independent audit guidance stresses the need to verify reported data, assess the systems that produce it, and preserve evidence-based traceability so teams can identify missing loads, schema drift, and logic failures before they affect reporting or compliance evidence (independent guidance on data verification and audit traceability).
That traceability matters because poor data quality has a material operational cost. Monte Carlo cites an average cost of USD 12.9 million per year for poor data quality, alongside recurring incidents, a reported average detection time of 4 hours, resolution time of 9 hours, and more than 793 hours of data downtime per month on average (Monte Carlo's audit data quality guidance). Those figures make detection speed and recovery performance audit concerns, not merely engineering preferences.
Practical rule: If your audit can't show when a dataset changed, when it was expected, who consumed it, and what happened after an exception, it's documenting a snapshot rather than auditing a pipeline.
A repeatable workflow closes that gap. IBM describes a sequence that starts with scope and objectives, profiles the data, defines explicit rules, tests records, analyzes issue patterns, prioritizes remediation, and continues through monitoring and reporting (IBM's data quality assessment workflow). Teams also need to understand why quality initiatives fail structurally, not just record individual defects. The structural fixes for failed data quality projects provide useful context when an audit keeps finding symptoms without changing the pipeline that creates them.
For organizations balancing technical controls with broader governance obligations, an audits and compliance Australia 2026 resource can help frame the compliance context. The engineering test remains the same: can the organization prove that important data was delivered, transformed, validated, and acted upon as expected?
Defining Scope and Objectives for Your Audit
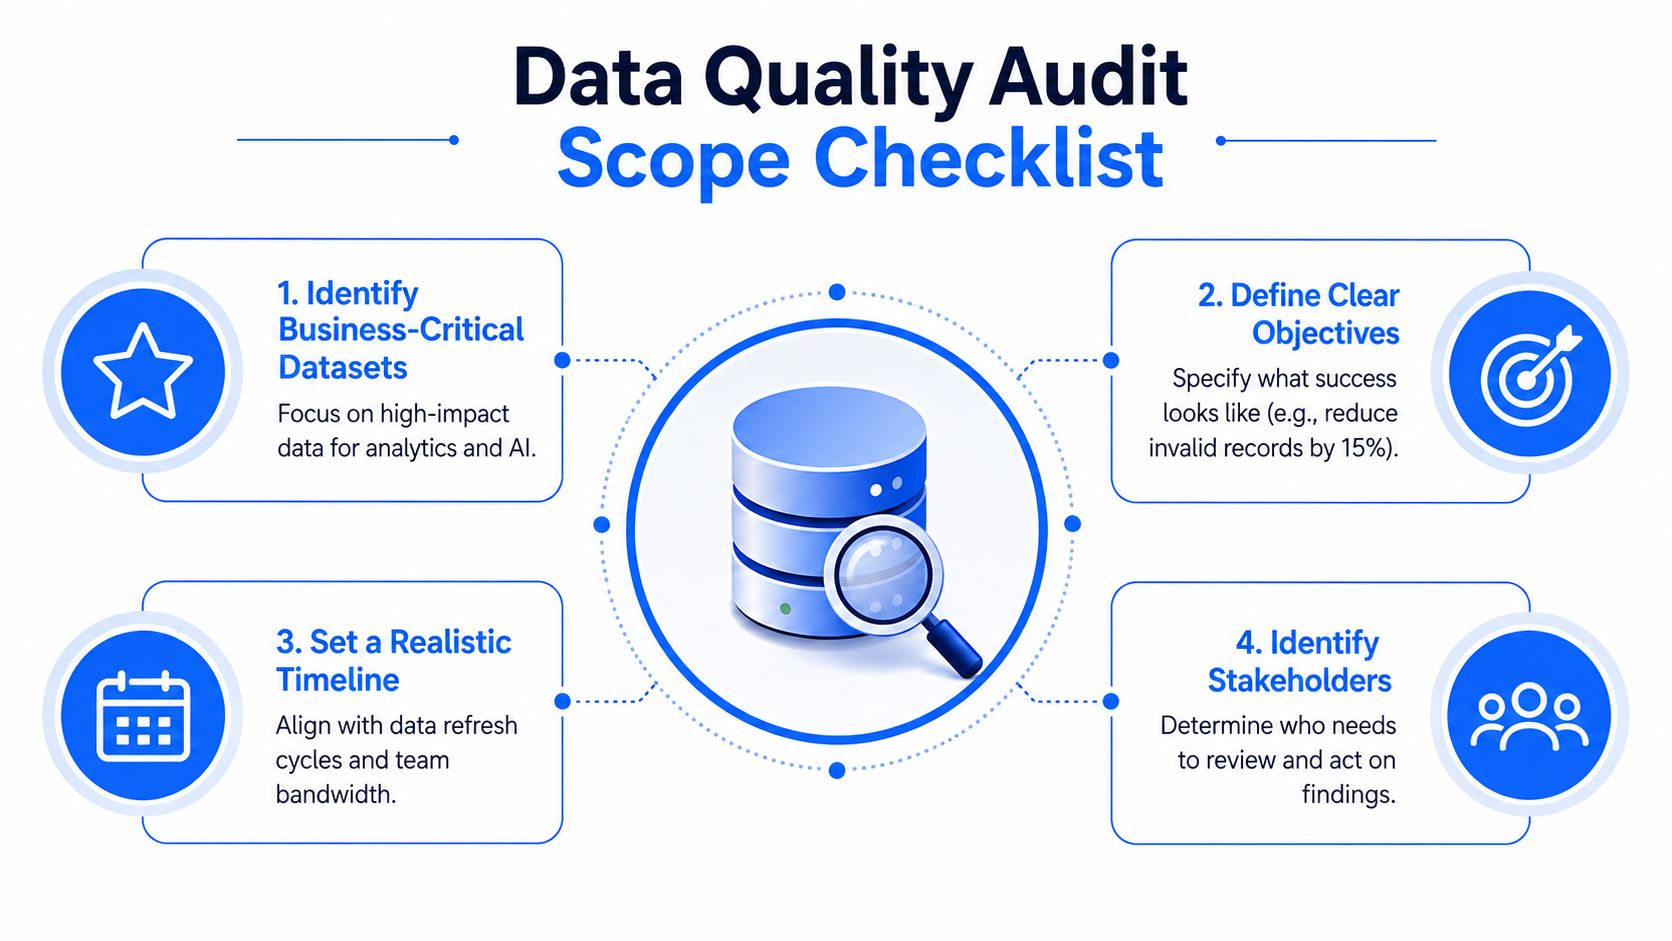
A data quality audit that includes every table usually produces a long issue list and little accountability. Start with business impact, then work backward through the data supply chain.
Select the data that can cause real damage
List the reports, regulatory submissions, operational decisions, and AI workflows that depend on enterprise data. For each output, identify the tables, pipelines, transformations, and source systems involved. A customer table supporting identity controls deserves a different level of scrutiny from an exploratory dataset used by one analyst.
Use a simple prioritization score based on qualitative categories:
Business criticality: Would an error affect revenue, risk decisions, patient operations, service delivery, or executive reporting?
Regulatory dependency: Does the dataset contribute to evidence, mandated reporting, or controlled processes?
Consumer count: Do many dashboards, models, and applications depend on the same table?
Failure detectability: Would a broken load be obvious, or could it produce plausible but stale output?
Change frequency: Does the source schema or business logic change regularly?
Your inventory should identify critical data elements, their owners, definitions, allowed values, and downstream consumers. A practical reference for organizing those elements is digna's critical data elements guidance.
Turn business concerns into testable objectives
“Improve data quality” isn't an audit objective. “Confirm that regulatory reporting fields are complete and valid at submission time” is. Other useful objectives include verifying the integrity of model training data, preventing dashboard outages, confirming that transaction feeds meet delivery expectations, or proving that a schema change cannot reach production without review.
Write each objective with four parts:
Asset: the dataset, pipeline, report, or model input.
Risk: the failure that matters.
Evidence: the checks and lineage needed to prove control.
Decision: the action taken when the check fails.
This structure prevents teams from collecting metrics that nobody uses. It also makes stakeholder review easier because business owners can see how a technical exception maps to an operational consequence.
Choose baseline coverage or a focused deep dive
A baseline audit profiles a broad domain and identifies the largest gaps. It's useful when ownership is unclear or the organization lacks a shared inventory. A targeted audit goes deep on one high-risk flow, such as payments, clinical encounters, identity records, or model features. It's faster to act on, but it can miss systemic problems elsewhere.
Run a baseline when you need a map. Run a deep dive when a known failure threatens a decision or control. In both cases, assign a data owner, a technical owner, and a business reviewer before testing begins. For questions about independence, scope, and review responsibilities, an internal audit outsourcing guide for finance leaders offers useful governance considerations.
Core Data Quality Dimensions to Measure
A defensible audit measures quality through explicit dimensions rather than a general judgment that data “looks right.” A 2014 review of public health data quality assessment methods found that completeness, accuracy, and timeliness were the three most-used attributes among 49 total data quality attributes studied (data governance and data quality audit review). The same body of practice uses descriptive statistics and percentage-based reporting, which makes results comparable and reviewable.

Measure the record and the meaning
Completeness asks whether required data is present. Measure null rates, missing keys, absent files, and incomplete field combinations. A non-null customer email may still be incomplete if the associated consent status is missing, so completeness rules should reflect the record's purpose.
Accuracy asks whether a value represents the real-world entity or event. A populated address can still be inaccurate, and a transaction amount can be syntactically valid while disagreeing with a trusted source. Accuracy testing often requires comparison with source records, reference data, reconciliation totals, or controlled business processes.
Consistency checks whether the same entity, definition, or measure agrees across systems. Conflicting customer identifiers, different currency conventions, or mismatched metric logic create inconsistent outputs even when every individual table passes a local null check.
Validity tests whether values conform to defined formats and business rules. That includes accepted status values, date relationships, numeric ranges, referential integrity, and conditional requirements. A record can be complete but invalid if it contains a value outside the permitted domain.
Treat timeliness and structure as operational controls
Timeliness isn't just a preference for fresh data. Established guidance defines it as availability within a specified timeframe or service-level expectation, including delivery latency, late arrivals, missing loads, and whether data meets the agreed SLA window (data governance and data quality management guidance). Record the expected arrival pattern, actual arrival time, load completeness, and downstream availability separately. A dataset may be accurate and complete yet unusable because it arrived after the decision window.
Schema validation forms the structural layer beneath these dimensions. Validate required columns, data types, nullability, naming conventions, and permitted structural changes at ingestion. Guidance on data quality checks identifies schema and datatype enforcement as controls that catch unauthorized additions, deletions, and type modifications before downstream systems fail (schema and datatype validation guidance).
For document-heavy workflows, upstream image quality can affect extraction accuracy before warehouse checks begin. Teams working with scanned financial records can consult guidance on image quality for data extraction. For a broader dimension framework, digna's data quality dimensions reference connects these measures to operational monitoring.
Sampling Strategies and Testing Methods
Full-table scans are appropriate when the dataset is small enough, the control is safety-critical, or the rule is cheap to evaluate. They're often the right choice for schema, primary-key uniqueness, required-column presence, and delivery checks because those controls examine structure or metadata rather than every business value.
Large fact tables require more judgment. Sample across time periods, source systems, geographic or product segments, null patterns, and known change windows. A random sample can estimate general behavior, but it can miss concentrated failures. Stratified sampling gives each important segment representation, while targeted sampling focuses on records created during deployments, migrations, late loads, or source-system changes.
Match the test to the failure mode
Use record-level validation for business logic. Check that dates follow permitted relationships, statuses match allowed transitions, amounts fall within sensible ranges, and reference values exist. High-level aggregates can confirm that a total moved unexpectedly, but only record-level evidence can show which rows violated the rule and why.
Use anomaly detection when the expected pattern is complex or changes over time. A fixed threshold may catch an impossible count, but it can miss gradual drift in distributions, unusual category mixes, or a sudden change in a model feature. Combine statistical signals with deterministic rules rather than treating one as a replacement for the other.
digna's data profiling techniques provides a useful starting point for understanding distributions, missingness, uniqueness, and structural patterns before setting thresholds.
Audit testing methods by quality dimension
Dimension | Testing Method | Full Scan or Sample |
|---|---|---|
Completeness | Null, missing-key, file-arrival, and required-combination checks | Full scan for critical fields, stratified sample for broad exploration |
Accuracy | Reconciliation with trusted sources, reference checks, and domain review | Targeted sample, with full reconciliation where control risk is high |
Consistency | Cross-system comparisons, duplicate detection, and definition checks | Full scan for keys and aggregates, sample for semantic review |
Validity | Format, range, reference-list, and conditional business-rule validation | Full scan for inexpensive rules, sample for complex logic |
Timeliness | Arrival timestamps, latency, missing-load, and SLA checks | Full monitoring of delivery events |
Schema | Column, datatype, nullability, and structural-change validation | Full scan of metadata at ingestion |
For scoring, calculate the issue rate as (number of data issues identified ÷ total data points reviewed) × 100, a formula described by KPI Depot's audit data quality framework (audit data quality issue-rate formula). That source classifies 90%+ as excellent, 80%–89% as good, 70%–79% as fair, and below 70% as poor. Treat those bands as a benchmarking model, not a universal control limit. A low issue rate in a low-impact table may matter less than one invalid record in a critical regulatory field.
Documenting Findings and Prioritizing Remediation
An audit report should let an engineer reproduce the finding and let a business owner understand the consequence without reading SQL. Every issue needs evidence, ownership, severity, and a decision.
Record findings so another team can verify them
Capture the dataset and column, rule tested, execution time, source version, affected records or sample definition, observed result, expected result, lineage, and supporting query or artifact. Include whether the issue is new, recurring, or linked to a known deployment. This creates an evidence trail instead of a screenshot that loses context as soon as the pipeline runs again.
A useful finding format is:
Finding: State the defect in one sentence.
Evidence: Identify the rule, population, execution context, and representative records.
Impact: Explain which report, control, model, or process could be affected.
Owner: Name the person or team responsible for correction.
Disposition: Record the fix, accepted risk, exception expiry, or escalation path.
Rank risk before engineering effort
Severity should reflect business impact, not how technically interesting the defect is. A missing load feeding a risk report may outrank a larger set of cosmetic formatting issues. A schema change that affects several downstream models deserves rapid containment even if the initial record count looks small.
Use a remediation queue with separate tracks:
Containment: Stop publication, quarantine invalid records, or notify consumers.
Correction: Repair affected data and rerun dependent transformations.
Structural fix: Change ingestion, contracts, ownership, or validation so the defect won't recur.
Verification: Re-run the failed test and confirm downstream outputs.

A practical report for non-technical stakeholders can use this sentence pattern: “The customer-risk feed arrived outside its agreed delivery window, so the dashboard may represent an earlier operating position. The data platform team owns the source schedule, the risk team owns the consumption decision, and both teams must confirm the next successful delivery before publication.”
A finding without an owner is an observation. A finding with an owner, deadline, evidence, and verification test becomes a control.
High-level summaries still have a place, but they shouldn't be the only evidence. Record-level validation shows the actual defect, while structural monitoring explains whether the pipeline changed. Keep both in the audit record, then link the remediation ticket to the test result that proves closure.
Moving from Periodic Audits to Continuous Monitoring
Periodic audits are useful for establishing a baseline, reviewing controls, and challenging assumptions. They're poorly suited to failures that occur between review dates. A pipeline can deliver late, change shape, or begin producing unusual distributions immediately after an audit has finished.
Continuous monitoring turns the audit workflow into an operating control. Track delivery latency against expected schedules, alert on missing loads, validate critical records as they arrive, and record schema additions, removals, and datatype changes. Automated watchdogs should notify the responsible team when metrics move outside acceptable thresholds, while ingestion checks should stop breaking structural changes from reaching downstream consumers (continuous data quality monitoring framework).
The monitoring design should separate signal types. Timeliness signals identify whether data arrived when expected. Validation signals identify records that violate explicit rules. Anomaly signals surface unexpected changes in distributions or behavior. Schema signals catch structural drift. Combining them gives engineers enough context to distinguish a late source from a transformation defect or a legitimate business event.
Monitoring also needs audit-grade evidence. Store the rule or baseline, execution time, affected dataset, observed value, threshold, alert recipient, acknowledgement, and resolution. That record supports incident response and later control review without moving production data into a separate inspection environment.
digna's data quality monitoring capability is one option for this operating model. Its platform runs inside the customer's environment, supports record-level validation, timeliness tracking, anomaly detection, historical quality analysis, and schema-change monitoring, with in-database execution so data remains in place. The modular approach lets teams begin with a specific monitoring need and expand across critical tables, pipelines, and business processes.
A mature program doesn't eliminate periodic audits. It uses them to test whether continuous controls remain appropriate, whether ownership still matches the business, and whether the monitoring portfolio covers new consumers and risks.
digna helps enterprise teams monitor data behavior, validate records, track delivery timeliness, detect schema changes, and preserve audit-ready evidence inside their own infrastructure. Visit digna to see how its modular data quality and observability platform can support reliable analytics and AI across your critical pipelines.
Frequently asked questions
Why do traditional data quality audits fail?
Because they begin with a warehouse snapshot. High-level completeness checks will not tell you whether a critical load arrived late, whether a new column bypassed governance, or whether a transaction violates a rule while still matching its expected data type.
What separates an audit from a snapshot?
Traceability over time. If your audit cannot show when a dataset changed, when it was expected, who consumed it and what happened after an exception, it is documenting a snapshot rather than auditing a pipeline.
How do you scope a data quality audit?
By excluding most tables. An audit covering everything produces a long issue list and little accountability. Score candidates on business criticality, regulatory dependency, consumer count, failure detectability and change frequency, then inventory the critical data elements with owners, definitions, allowed values and downstream consumers.
How should audit objectives be written?
In four parts, because "improve data quality" is not an objective. Name the asset, the risk that matters, the evidence needed to prove control including checks and lineage, and the decision taken when the check fails.
What does poor data quality cost operationally?
Monte Carlo cites an average of USD 12.9 million per year, alongside an average detection time of 4 hours, resolution time of 9 hours, and more than 793 hours of data downtime per month on average. Detection time is the part an audit can actually change.


