What Is a Data Pipeline and Why It Matters
|
5
min read

A data pipeline is an end-to-end system that automates ingesting, transforming, validating, and loading data so it can be reliably used for analytics, AI, and operational decisions. In modern production, that usually means a pipeline has to move data through storage or consumption layers without losing freshness, structure, or trust.
You've probably seen the opposite happen. A dashboard turns green, a team assumes the numbers are safe, and then someone discovers the underlying feed was stale for hours because an upstream system changed without warning.
Table of Contents
What a Data Pipeline Actually Does in Production
Why the textbook definition isn't enough
The Four Core Components of Every Pipeline
Ingestion and transformation
Storage and consumption
Choosing Between ETL ELT and Streaming Architectures
Where each pattern fits
How to make the choice
Silent Failure Modes That Break Pipelines
Schema drift and late arrivals
Quality regressions and blind monitoring
The Business Cost of Unreliable Pipelines
How the damage spreads
Why this is a business risk, not a tech annoyance
How to Know If Your Pipeline Is Production Ready
A practical readiness check
Questions every review should answer
Building Pipelines You Can Trust
What a Data Pipeline Actually Does in Production
A revenue dashboard can look perfectly healthy while the data behind it is already old enough to mislead the business. A source API changes its response format, a scheduled job still completes, and the reporting layer keeps rendering, so nobody notices that the numbers are 18 hours stale until someone compares them with the transactional system.
That's why a data pipeline is more than boxes and arrows. It's the operational backbone that automates ingesting, transforming, validating, and loading data from source systems into storage or consumption layers, so analysts, models, and business users can rely on what they see. Historical accounts show that the field grew from manual batch scripts in the 1970s and 1980s into more formal ETL systems around 1992, then into cloud-native ELT, streaming, and real-time architectures in the 2010s and 2020s (BytePlus).
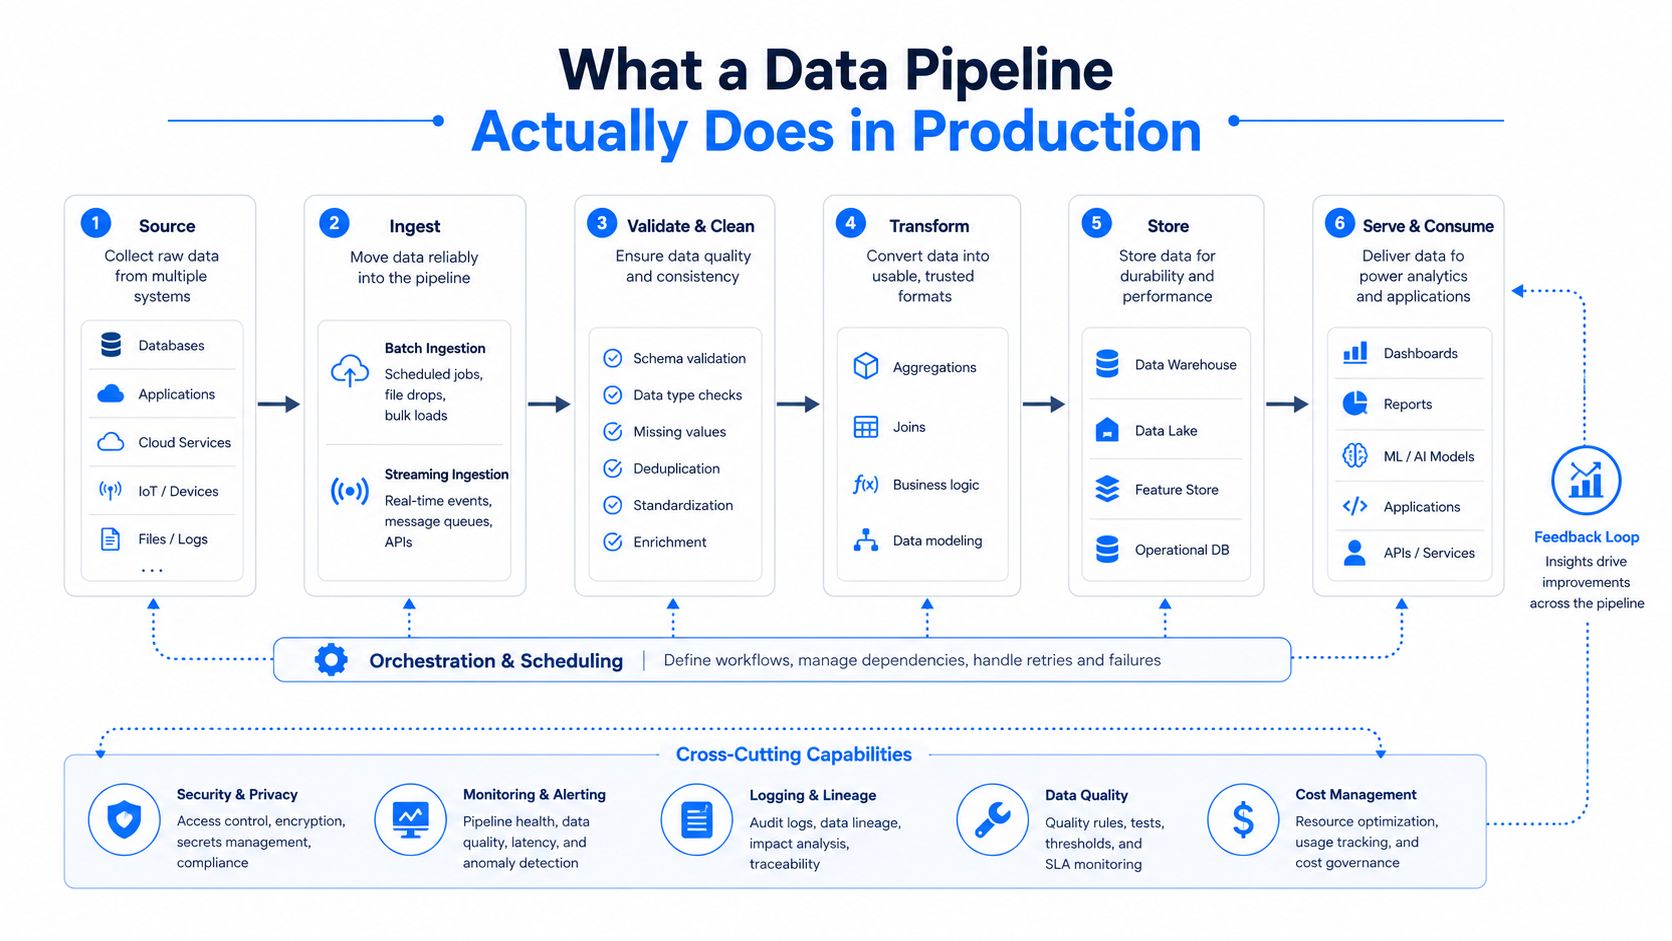
Why the textbook definition isn't enough
The simple definition sounds tidy, but production systems rarely are. Upstream APIs change without notice, databases evolve, files arrive late, and downstream teams still expect fresh data on a predictable schedule. The pipeline has to absorb those changes without turning every small variation into a broken dashboard or an angry Slack thread.
Practical rule: if a pipeline only succeeds when nothing changes, it isn't production-ready, it's just lucky.
That's the reason modern teams think about observability, retry logic, dependency management, and fault tolerance as part of the pipeline itself, not as add-ons. A production pipeline has to protect the business from invisible failures, not just move bytes from one system to another.
The Four Core Components of Every Pipeline
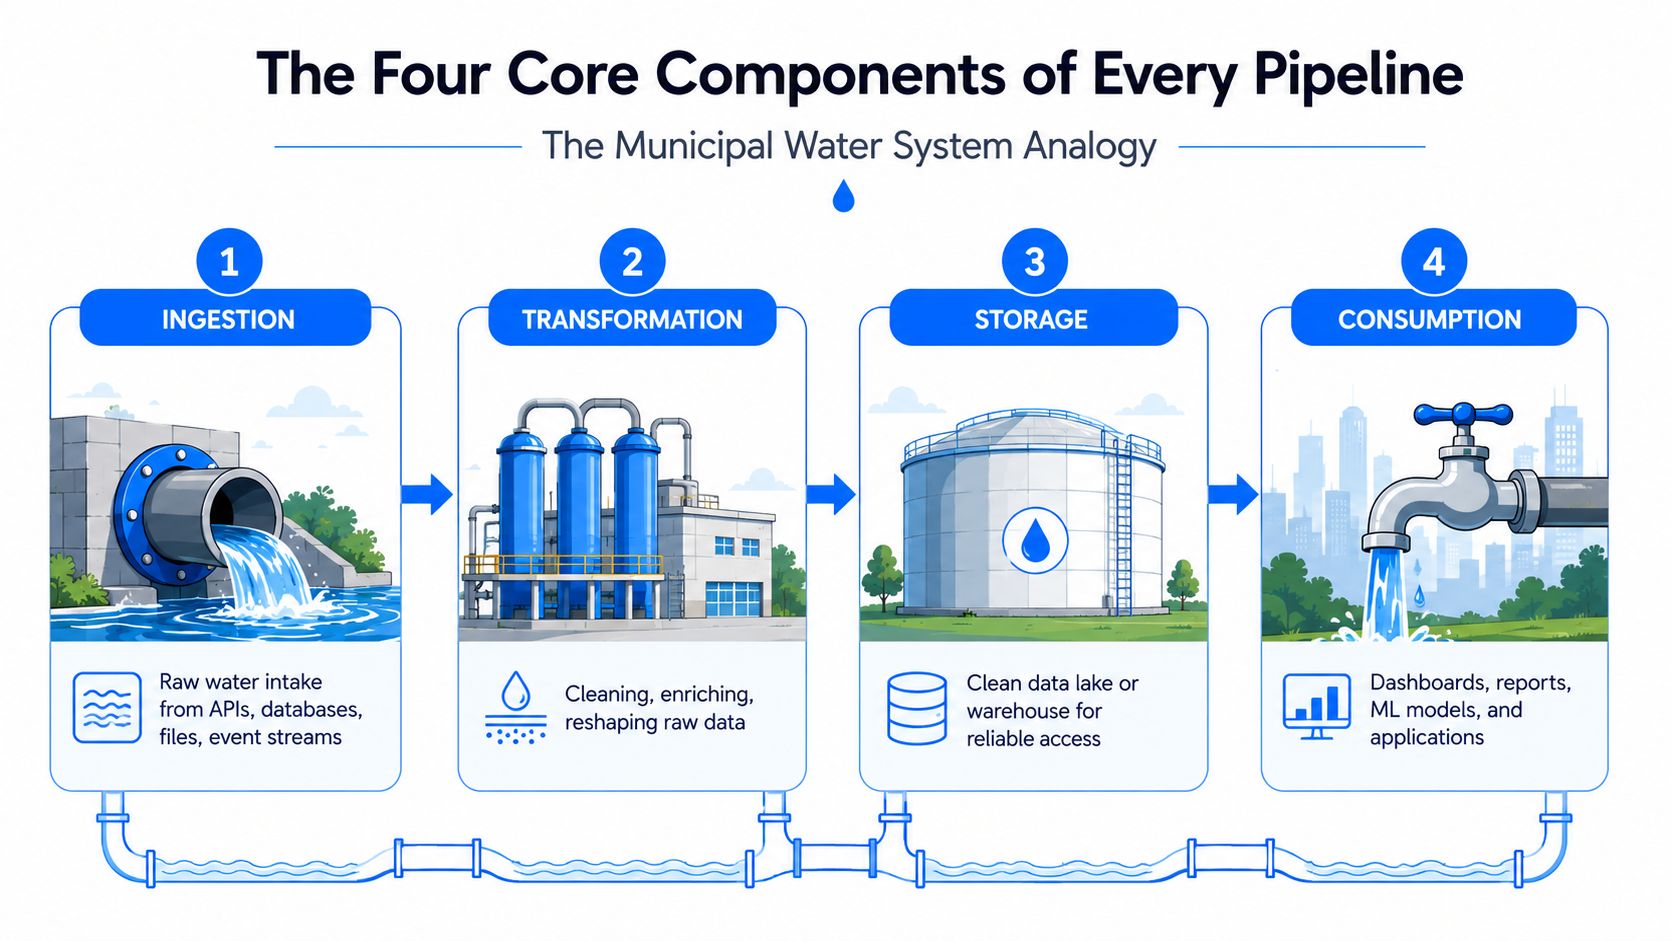
A useful way to understand pipeline design is to compare it to a municipal water system. Raw water comes in, gets cleaned, stored, and then delivered to homes. A data pipeline follows the same basic pattern, just with APIs, databases, files, event streams, warehouses, and dashboards instead of pipes and tanks.
Ingestion and transformation
Ingestion is the raw-water intake. Teams pull data from APIs, SQL databases, SaaS apps, files, and event streams, often through tools like CDC connectors, webhook listeners, or scheduled file drops. This stage breaks first when rate limits kick in, pagination is mishandled, or an upstream system starts returning fields in a different shape.
Transformation is the filtration plant. Engineers clean records, standardize formats, enrich events, and aggregate facts into business-ready outputs. The trade-off is simple but unforgiving, more transformation can improve quality, but it also burns compute and creates more places for logic to drift out of sync with the source.
Storage and consumption
Storage is the reservoir. That may be a warehouse, a lake, or a lakehouse, and the decision usually comes down to how teams want to organize formats, partitions, and downstream reuse. If storage is modeled poorly, teams end up paying for repeated scans, slow queries, and awkward reprocessing.
Consumption is the tap at the end of the line. BI tools, ML models, and operational apps all depend on this stage, and each one has a different freshness expectation. A dashboard that refreshes nightly can tolerate delay, but a customer-facing application or fraud workflow can't.
For a more detailed architectural view, the digna data pipeline architecture guide is useful if you want to map these stages to a broader operating model.
The stage that looks simplest in a diagram is usually where production pain starts, because storage and consumption decisions determine whether the rest of the pipeline stays useful.
Choosing Between ETL ELT and Streaming Architectures
ETL, ELT, and streaming are not competing buzzwords. They're different answers to the same question, how fast does the data need to move, and how much control do you need before anyone sees it?
Where each pattern fits
ETL transforms data before loading it. That works well in governed environments where the team wants strict quality gates before data lands in the target system, and where warehouse compute is limited or expensive.
ELT loads raw data first and transforms it inside the warehouse. That fits cloud-native stacks better because storage and compute are easier to scale independently, and the same raw data can be reused for multiple models or reporting layers.
Streaming processes events continuously as they arrive. It's the right fit for event-driven systems, real-time fraud detection, and personalization where stale information is a business problem, not a minor inconvenience.
Factor | ETL | ELT | Streaming |
|---|---|---|---|
Transformation timing | Before load | After load | Continuously as events arrive |
Best fit | Governed, batch-heavy environments | Cloud-native analytics stacks | Low-latency operational use cases |
Operational complexity | Moderate | Moderate | High |
Freshness profile | Scheduled | Faster than classic batch, still scheduled | Near real time |
Governance posture | Strong pre-load control | Strong warehouse-side control | Requires careful monitoring and event discipline |
How to make the choice
Use ETL when quality gates matter more than flexibility. Use ELT when the business wants reuse, scale, and faster iteration inside the warehouse. Use streaming when latency drives revenue, risk, or customer experience.
If you want a practical comparison from an implementation angle, the digna ETL data pipeline overview is a good reference point for the ETL side of the decision.
Decision rule: optimize for the slowest acceptable freshness, not the fastest possible technology.
That sounds obvious until teams choose streaming for everything, then spend months paying for complexity they didn't need. The best architecture is the one that matches latency, governance maturity, cost constraints, and the team's ability to operate it.
Silent Failure Modes That Break Pipelines
The most dangerous pipeline failures don't throw a bright red error. They let the job finish, keep the dashboard alive, and distort the numbers that leaders trust.
Schema drift and late arrivals
Schema drift happens when an upstream source adds, removes, or renames fields without telling the data team. One common source defines it as an unannounced structural change relative to the schema the pipeline was built against, and another notes that it's one of the most frequent causes of failure when application databases change without notifying the data team (DataThere). The result can be nulls where values should be, or aggregations that exclude fields no one realized had gone missing.
Late-arriving data creates a different kind of problem. A batch window closes before every record lands, so the daily metric looks complete even though it undercounts actual activity. A batch-processing study describes this as data that arrives after the expected time window has closed but still within a predefined grace period (IJSAT).
A payment processor changing timestamp formats or a CRM export dropping custom fields can break downstream logic without breaking the job itself. The report still renders, which is exactly why people trust it too early.
Quality regressions and blind monitoring
Quality regressions are slower and harder to spot. Duplicate records creep in, format inconsistencies spread, and basic validation still passes because the data is technically present, just less trustworthy than before. Traditional job-level monitoring misses that completely because it only asks whether the pipeline ran, not whether the output still makes sense.
For teams trying to think beyond freshness alone, IamVera.AI's note on data freshness and AI answers is a useful reminder that stale inputs don't just affect reports, they affect downstream reasoning too.
The production answer is to monitor structure, timing, and output behavior together. That's the difference between knowing a job completed and knowing the business can trust what it produced.
For a deeper look at incident patterns, the digna guide on why data pipelines fail in production maps these failure modes to practical detection points.
The Business Cost of Unreliable Pipelines
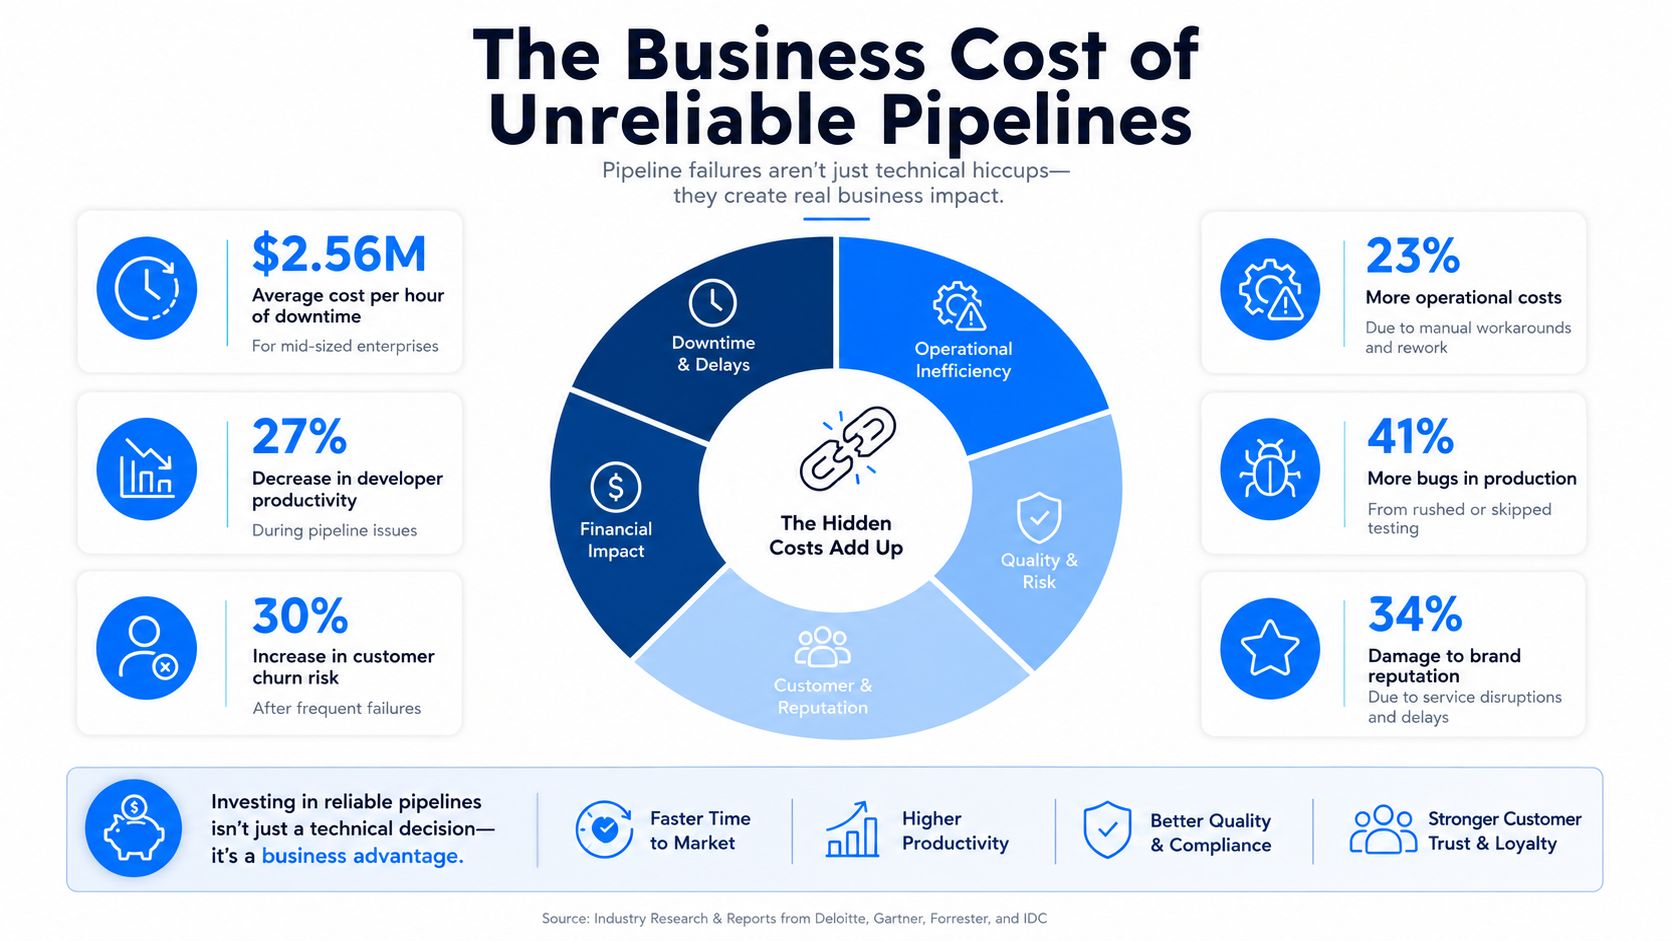
Unreliable pipelines don't stay in engineering. They show up in campaign decisions, forecast calls, customer-facing products, and model behavior.
How the damage spreads
A broken ingestion layer leads to stale dashboards. Marketing teams then optimize against outdated conversion data, finance teams build forecasts from incomplete outputs, and analysts spend time reconciling numbers instead of answering questions. If customer-facing apps read from the same unreliable pipeline, the reputation hit is immediate.
AI and ML systems feel the problem too. When training or feature pipelines degrade, the model doesn't always fail loudly, it can drift and keep making weaker predictions or recommendations while everyone assumes it's working.
Why this is a business risk, not a tech annoyance
IBM reports that a 2025 IBV study found 43% of chief operations officers named data quality issues as their top data priority, and more than a quarter of organizations estimated annual losses above USD 5 million, with 7% losing USD 25 million or more (IBM). That lines up with what many teams already feel in practice, poor data isn't an abstract governance concern, it's an operating cost.
The remediation pattern is brutal as well. A cited ROI-of-quality-data study places prevention at about $1 per record, finding and fixing poor data after it appears at about $10 per record, and correcting an error after an event at about $100 per record (LightsonData). The longer the issue survives, the more expensive it gets.
If you want a simple way to frame the issue for leadership, the digna data downtime cost calculator helps connect pipeline outages to business impact without turning the conversation into guesswork.
A pipeline that looks fine while producing the wrong answer is more expensive than a pipeline that fails fast, because false confidence scales.
How to Know If Your Pipeline Is Production Ready
A pipeline is production ready when the team can explain how it behaves under change, delay, and partial failure. “It passed staging” isn't enough, because staging rarely has messy source behavior, late records, or consumers who depend on fresh outputs at a fixed time.
A practical readiness check
Observability: Every stage should emit structured logs, lineage should be traceable, and alerts should fire on freshness thresholds, not just job completion. If the pipeline is late but green, the alerting model is too shallow.
Validation: Producers and consumers need schema contracts, row-level quality assertions, and anomaly detection on counts or value distributions. That gives you a chance to catch bad outputs before they reach dashboards or features.
Freshness and replay: Define a real freshness SLA for each downstream use case, then test whether the pipeline can replay historical data without duplicating records. If it can't recover after a source outage, it's not resilient enough for production.
A useful internal reference for that kind of evaluation is the digna reliability measurement guide, especially if your team needs to turn reliability into something measurable instead of anecdotal.
Questions every review should answer
Can we see the data health, not just the job status? If not, observability is incomplete.
Do we know what changed when the source changed? If not, schema drift will surprise you.
Can we reprocess safely? If not, recovery will create duplicates or gaps.
Do downstream users know the freshness expectation? If not, trust is based on habit, not evidence.
Good standard: a production-ready pipeline keeps working when inputs are late, messy, or partially wrong, and it tells you exactly when that happens.
That standard should be shared by engineering, analytics, and business owners. Otherwise, the team defines success as “the DAG ran,” while the business assumes success means “the numbers are right.”
Building Pipelines You Can Trust
The modern pipeline isn't just plumbing between systems. It's a reliability layer for data products, which means trust comes from design choices, not from orchestration alone.
Teams that earn trust do a few things consistently. They define freshness and quality SLAs, treat schema changes as breaking events, monitor data health independently of run status, and match architecture to the needs of downstream consumers. They also make ownership explicit, because nobody trusts a critical pipeline when no one knows who responds at 7 a.m.
For teams looking for a practical blueprint, the DataTeams guide to building a data pipeline is a helpful companion to the ideas here, especially if you're translating architecture into day-to-day implementation choices.
The payoff shows up later, in cleaner analytics, stronger models, and fewer debates about whether a metric is real. Reliable pipelines become the base layer for real-time analytics, machine learning feature stores, and automated decisioning systems that depend on consistent, high-quality data.
digna helps teams monitor schema changes, timeliness, data validation, and anomalies inside their own environment, which is exactly the kind of control production pipelines need. If you're tightening pipeline reliability or trying to make data trust visible to the business, visit digna and see how its observability modules fit into your stack.
Frequently asked questions
What is a data pipeline?
An end-to-end system that automates ingesting, transforming, validating and loading data so it can be reliably used for analytics, AI and operational decisions. The automation is the point: a sequence of manual steps that happens to run in order is not a pipeline.
What are the four core components?
Ingestion, transformation, storage and consumption, which map neatly onto a municipal water system: the raw-water intake, the filtration plant, the reservoir and the tap. The stage that looks simplest in a diagram is usually where production pain starts.
Why isn't the textbook definition enough?
Because production systems rarely behave tidily. A source API changes its response format, the scheduled job still completes, the reporting layer keeps rendering, and nobody notices the numbers are 18 hours stale until someone compares them with the transactional system.
When should you choose ETL, ELT or streaming?
They are not competing buzzwords but different placements of the transformation step. ETL transforms before loading, ELT loads raw data first and transforms inside the warehouse, and streaming processes continuously. The right choice follows the latency the decision needs and where the compute belongs.
How long have data pipelines existed?
Longer than the term. Historical accounts trace the field from manual batch scripts in the 1970s and 1980s into more formal ETL systems around 1992, then into cloud-native ELT, streaming and real-time architectures through the 2010s and 2020s.


