Data Quality Monitoring: Implement for Success in 2026
|
7
min read

Your dashboard looked fine yesterday. This morning, revenue is down, conversion is flat, and a leadership meeting starts in twenty minutes. Nobody changed the BI logic. Nobody shipped a visible pipeline change. Then someone notices a late upstream load, a renamed column, or a distribution shift that slipped past a few hand-written checks. The numbers were wrong long before anyone realized they were wrong.
This is the core problem with data quality monitoring. Most failures aren't dramatic outages. They're quiet errors that leave reports stale, models miscalibrated, and teams arguing over which metric to trust. The cost isn't just technical cleanup. It's lost confidence, delayed decisions, and repeated fire drills that steal time from actual engineering work.
Teams that want fewer surprises need monitoring that goes deeper than surface-level rules. They need checks that run where the data lives, track behavior over time, and catch drift before it reaches dashboards, finance reviews, or production ML systems.
Table of Contents
The Hidden Costs of Silent Data Failures
Monday at 8:05 a.m., the revenue dashboard opens on time and every tile loads. By 10:30, sales is arguing with finance because the weekly pipeline number dropped for no business reason. The pipeline did not fail. The data did.
That pattern is expensive because it burns time across the company before anyone can isolate the cause. A late batch can leave yesterday's numbers in place while the warehouse still looks healthy. A type change from INT to VARCHAR can keep ingestion running but break joins on customer records later in the chain. A feature table can keep passing null checks even as a shifted value distribution degrades model output.
Silent failures spread through decision-making. Leaders approve plans from stale metrics. Finance closes against mismatched systems. Operations teams reorder inventory from distorted demand signals. By the time engineering is pulled in, the immediate problem is no longer the bad table. It is the loss of trust around every downstream metric that used it.
Poor data quality carries a real business cost. Gartner has estimated organizations lose an average of $12.9 million per year because of it. The number matters, but the operational pattern matters more in practice. Teams spend more time debating whether a number is usable than acting on it.
Silent failures demand more discipline than hard failures. A broken pipeline triggers an incident. A working pipeline with wrong data keeps feeding reports, models, and workflows until someone notices the business result looks off.
In enterprise environments, the recurring failure modes are usually specific:
A load completes after the reporting cutoff: Airflow marks the job green at 6:12 a.m., but the executive dashboard was refreshed at 6:00 using incomplete fact tables.
A join key changes shape without throwing an error:
user_idarrives as a string with leading zeros, downstream SQL casts it inconsistently, and conversion reporting drops because joins stop matching.A metric stays inside static thresholds while its behavior changes: Refund rate remains between 1 percent and 3 percent, but one region suddenly doubles and gets buried in the global average.
Reference data updates in one system but not another: Billing reflects the new product hierarchy, CRM does not, and segment reporting splits the same account across conflicting categories.
A default value masks missing upstream data: An event stream starts filling
country_codewithUSafter a parsing bug, so completeness checks pass while regional analysis becomes fiction.
These are the failures old rule sets miss. Row counts, null checks, and schema assertions still have value, but they rarely catch data that is technically valid and operationally wrong. At scale, the safer approach is deeper monitoring inside the warehouse, where teams can compare freshness, distributions, relationships, and cross-system consistency close to the data itself.
If dashboard disputes keep recurring, model outputs drift without a code change, or incident threads keep ending with “the pipeline succeeded,” the monitoring gap is already costing the business. For a business-side view of the fallout, see this breakdown of poor data quality on business decisions.
What Data Quality Monitoring Means in 2026
A pipeline finishes at 5:00 a.m. Every task is green. By 9:30, finance is questioning revenue, product is seeing impossible conversion swings, and the data team is stuck proving that the jobs did in fact run. That is the gap data quality monitoring has to close in 2026.
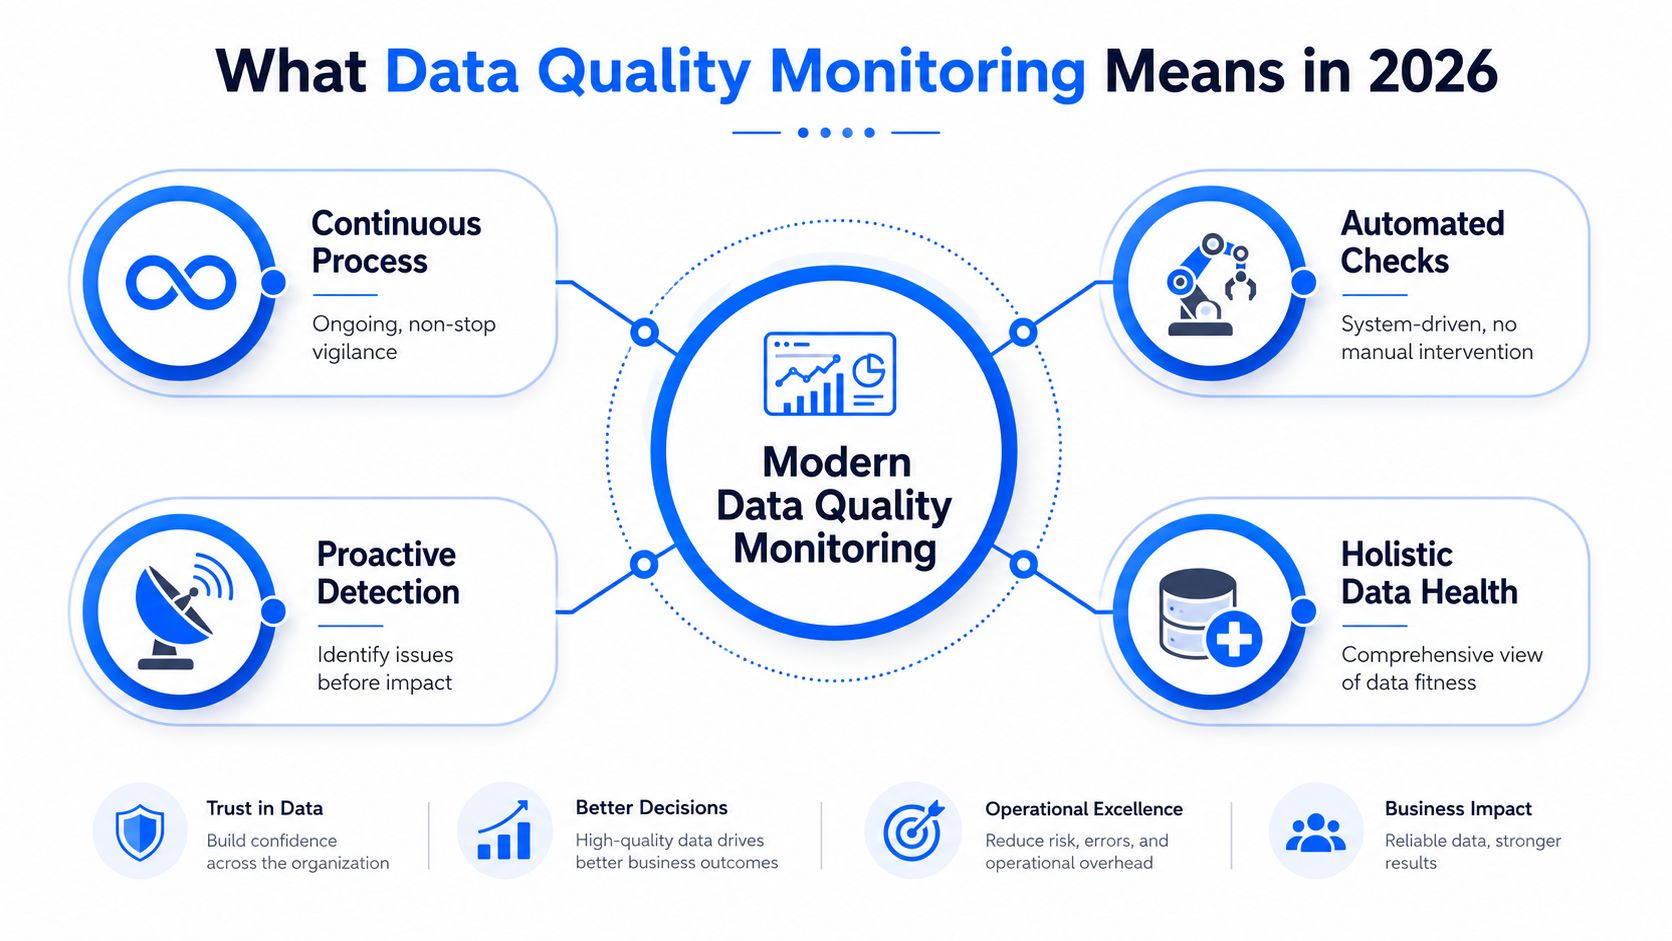
Data quality monitoring now operates as a continuous control system for pipelines, tables, models, and business-critical assets. The job is not just to confirm that data arrived. The job is to confirm that the data still behaves the way the business expects, at the point where it is used.
From one-off validation to continuous control
Older programs treated quality as a set of fixed checks attached to a pipeline. Null tests, allowed values, row counts, and schema assertions still belong in the stack. They catch obvious breakage fast. They do not catch the more expensive class of failures, where the data is technically valid but operationally wrong.
That distinction matters more at enterprise scale. A table can load on time and still be wrong because one source changed business logic, one region stopped sending events, or one upstream service started filling a field with a default that passes every completeness test. The warehouse is usually the best place to detect that kind of drift because it has the history, the cross-table relationships, and the business context.
Modern monitoring usually combines four layers:
Behavioral monitoring: Track normal patterns for volume, freshness, distributions, and seasonality.
Structural monitoring: Catch schema drift, type changes, lineage breaks, and dependency failures.
Operational monitoring: Watch schedules, late-arriving data, retries, and partial loads.
Business validation: Enforce logic tied to contracts, policies, finance controls, or customer-facing metrics.
Teams also need a clear line between quality and observability. Quality answers, "Can this data be trusted for this use case?" Observability answers, "Can we see enough of the system to detect, localize, and explain a problem quickly?" The difference matters in tool selection and ownership. A useful reference is this comparison of data observability vs data quality.
Why teams are changing their approach
The old operating model fails in predictable ways. Analysts find an issue after a dashboard review. Engineers rerun a job. The metric recovers. Nobody fixes the weak signal that should have triggered an alert six hours earlier.
I see the same pattern in large environments with hundreds of data products. Manual cleanup can resolve an isolated issue. Static rules can protect known constraints. Neither approach scales well when teams are dealing with streaming inputs, vendor feeds, semantic models, reverse ETL syncs, and ML features that all depend on the same core entities.
Approach | What it gets right | Where it breaks |
|---|---|---|
Manual cleanup | Useful for isolated incidents | Too late for operational analytics |
Static rules | Good for explicit constraints | Brittle when data behavior evolves |
Dashboard checks | Visible to analysts | Miss upstream pipeline context |
Continuous monitoring | Catches issues earlier | Requires design discipline |
The trade-off is real. Continuous monitoring takes setup work, ownership, and agreement on what "normal" means for each critical dataset. But that cost is lower than repeated incident triage, executive re-explanations, and teams making decisions from degraded data that goes unnoticed.
This applies well beyond large enterprises. Smaller teams building their first reporting stack run into the same failure pattern once a few dashboards become operational inputs. Founders and early analytics hires working through data analytics for startups hit the problem sooner than they expect because one broken source can affect finance, growth, and customer reporting at the same time.
What good monitoring looks like
Good monitoring runs automatically, close to the data, and with enough context to explain what changed. It prioritizes assets by business impact instead of trying to watch everything equally. It also routes alerts to the team that can act, with enough evidence to cut investigation time.
In practice, mature teams stop asking, "Did the table load?" They ask, "Did it load on time, with the expected relationships, distributions, and business meaning for this workflow?" That is the standard in 2026. Anything less leaves too much room for silent failures to reach the business.
The Core Metrics That Actually Matter
Additional metrics are not the primary need; rather, the focus should be on those tied to business questions. If a metric can't help an engineer or analytics lead decide whether data is safe to use, it's noise.
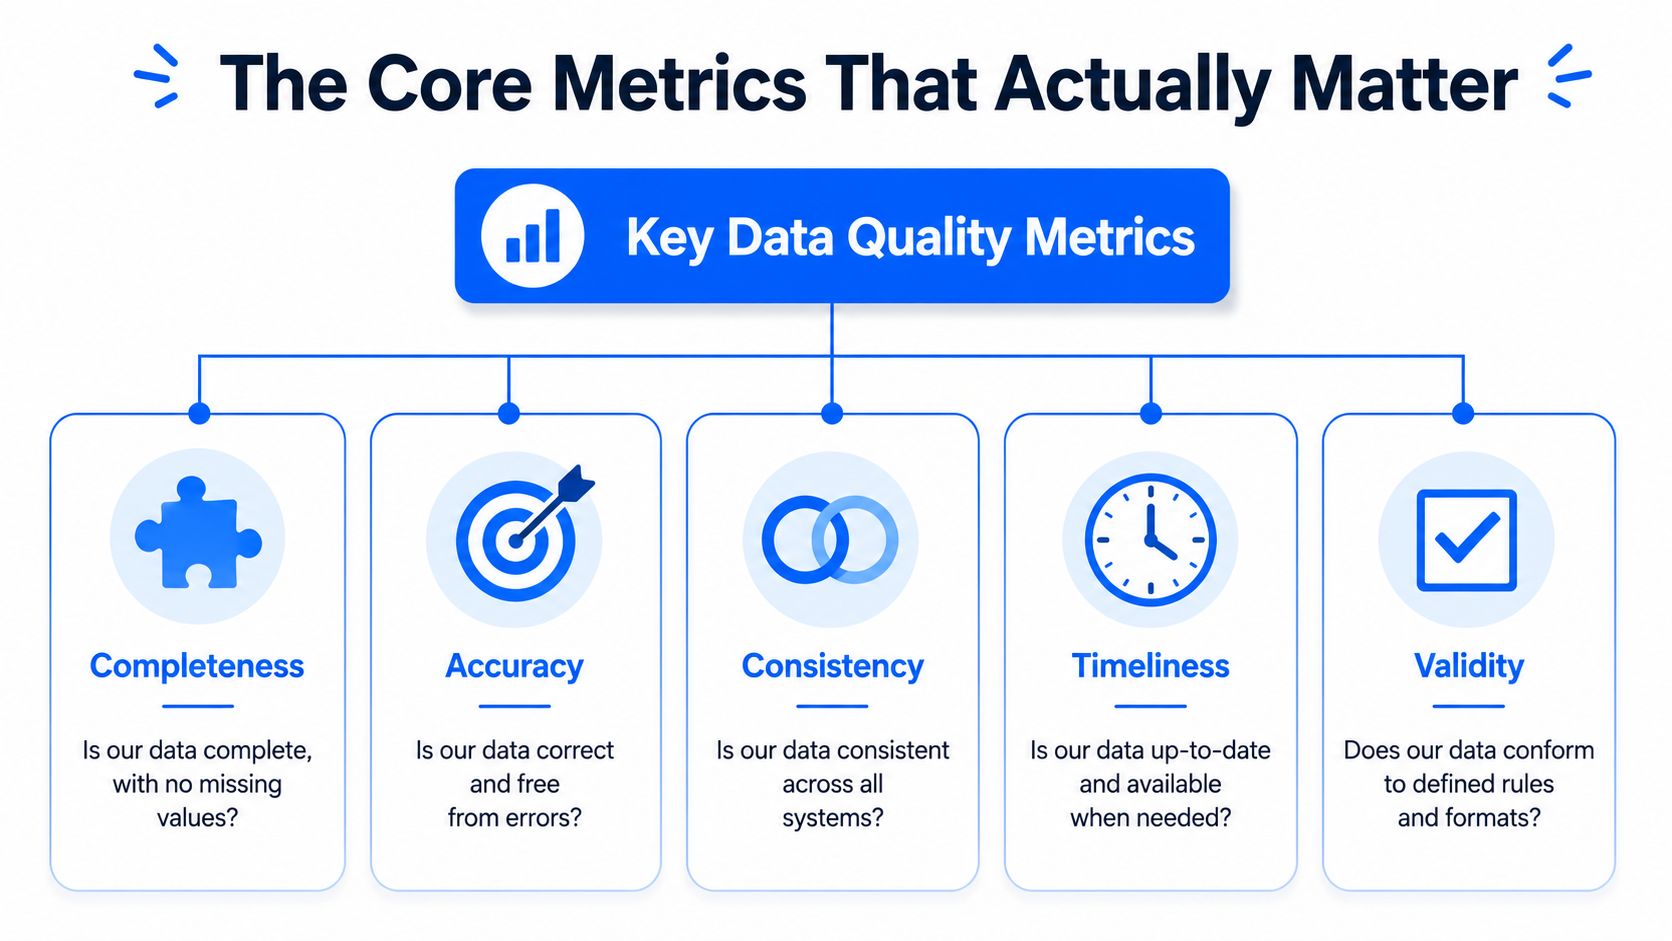
The most useful framework starts with five questions. Is the data complete? Is it accurate? Is it consistent across systems? Is it on time? Does it conform to expected structure and format?
Completeness and accuracy
Completeness asks whether required data is present. Missing rows, null spikes, and partially populated records often create the first visible symptoms of a bad load. This matters most in reporting pipelines where downstream metrics assume broad coverage.
Accuracy asks whether values reflect reality. A timestamp can be present and still be wrong. A customer segment can be populated and still be misclassified. Accuracy is harder than completeness because it often depends on business context, reference data, or cross-system comparison.
When rigorous monitoring is applied, data quality metrics can average 99.9% for completeness, 99.8% for accuracy, and 96.3% for timeliness, which is why these remain foundational pillars of an effective monitoring framework, according to Congruence Market Insights.
For smaller teams building their first analytics foundation, this practical guide to data analytics for startups is useful because it frames data reliability around actual business use instead of abstract theory.
Consistency and validity
Consistency is where many warehouse programs stumble. Revenue in finance, sales, and product reporting may all come from the same company but still differ because the transformation logic, cutoffs, or source systems don't align. Monitoring consistency means checking whether related systems tell the same story.
Validity is narrower and often easier to automate. Does the value conform to type, range, format, or business rule expectations? Think date formats, allowed enumerations, impossible negative quantities, or malformed IDs.
A compact way to think about these two:
Metric | Business question | Common failure |
|---|---|---|
Consistency | Do systems agree? | Conflicting definitions or joins |
Validity | Does the record obey the rules? | Wrong format, type, or constraint |
Timeliness and schema integrity
Timeliness matters more now because so many decisions depend on near-current data. A table that arrives two hours late may still pass most record-level checks and still be useless for a planning meeting or alerting workflow. Freshness isn't just an ops metric. It's a business reliability metric.
Schema integrity deserves equal attention. A renamed column, changed type, or reordered field can subtly poison downstream transformations. Teams often monitor missing values aggressively and underinvest in structural drift, which is a mistake in high-change environments.
If you monitor only content and ignore structure, you'll miss some of the most expensive failures.
A practical scorecard for many teams is to track these metrics at different criticality levels. If an executive finance mart needs near-perfect accuracy and timely delivery, treat it differently from a lower-risk exploratory dataset. That's also why a clear framework for data quality metrics matters more than a long list of generic checks.
Detection Methods AI Versus Manual Rules
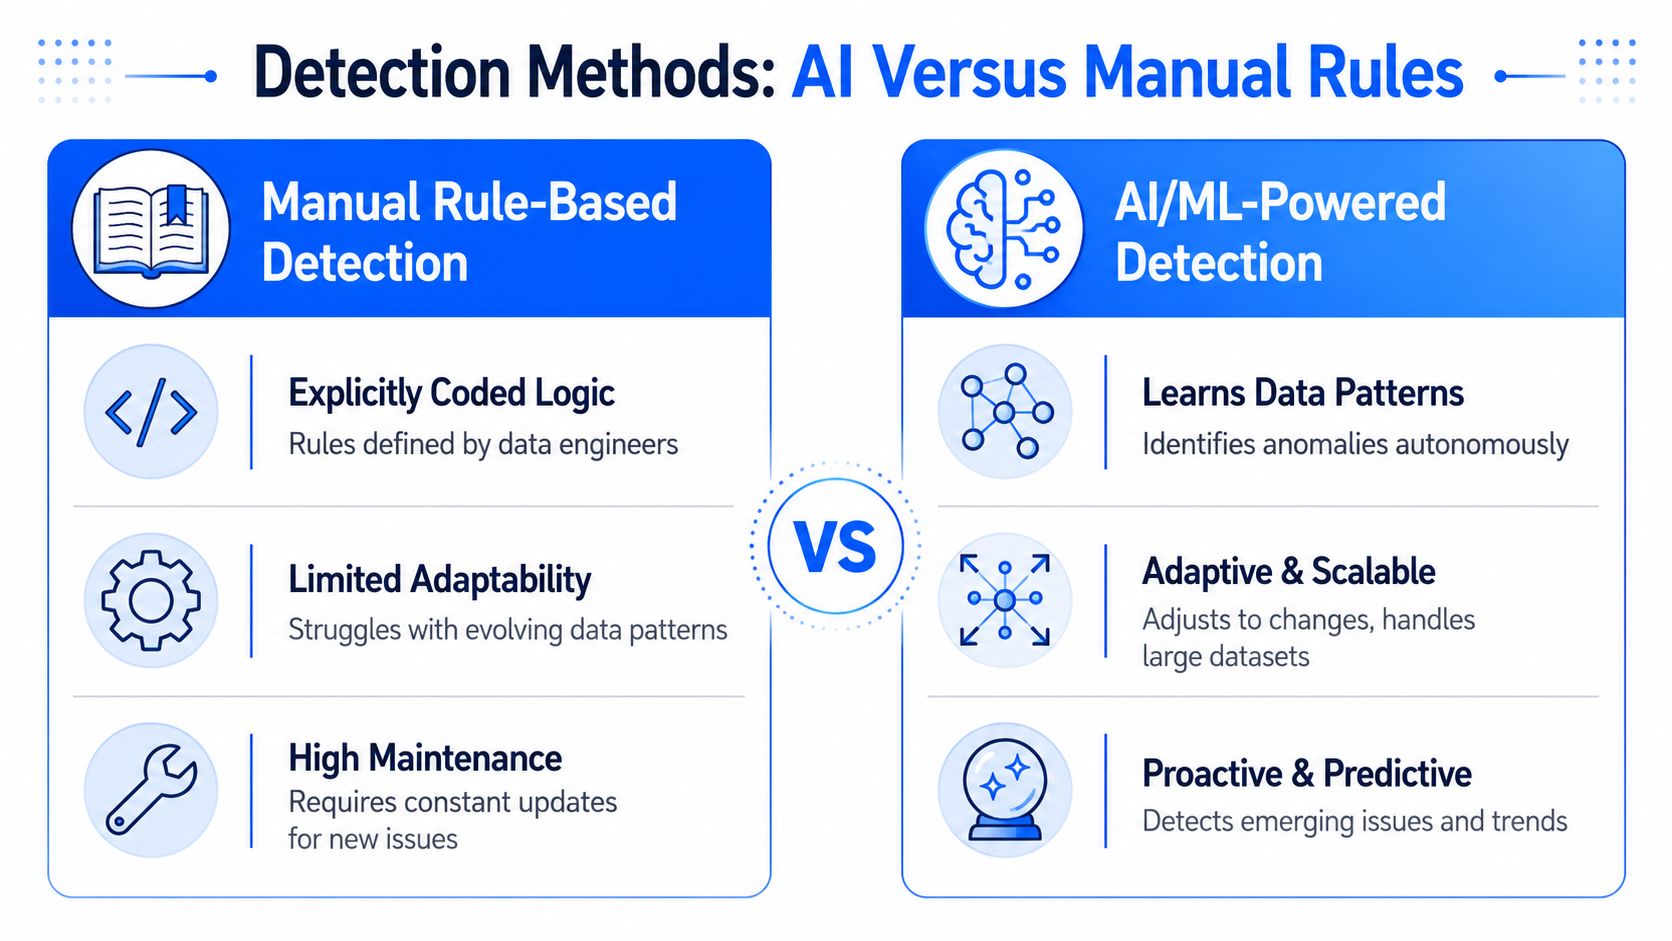
Most data teams start with manual rules because they're familiar. Write SQL for null checks, accepted ranges, uniqueness, and row counts. Put them in dbt tests, Airflow tasks, warehouse procedures, or custom Python jobs. For a while, that works.
Then the platform grows. More sources arrive. Schemas change more often. Usage expands from BI to operational analytics and ML. At that point, the rule catalog turns into a maintenance burden, and the team starts reacting to gaps that weren't encoded in advance.
What manual rules still do well
Rule-based detection is still the right tool for explicit business constraints. If an order status must come from a known set, a rule should enforce it. If a compliance field is mandatory, use a rule. If a payment date can't precede contract creation, encode that logic directly.
Manual rules are strongest when the team can answer two questions clearly:
What exactly must be true?
What action should follow if it isn't?
That clarity is valuable. The problem is coverage. Static rules only catch what engineers anticipated and took the time to encode.
Where static checks break down
Rule sets struggle with changing baselines. A normal Monday row count may be suspicious on a Friday. A conversion distribution may shift slowly enough to avoid any hard threshold but sharply enough to affect attribution or forecasting. Static checks also require frequent threshold updates, especially when business seasonality or source behavior changes.
That's where AI-powered anomaly detection differs. Unlike traditional rule-based systems that require frequent threshold updates, AI-powered anomaly detection automatically adapts to new data patterns and trends, surfacing subtle threats that static systems miss without relying on predefined rules, as described in Plixer's explanation of AI-powered anomaly detection.
A useful walkthrough of that broader trade-off is this comparison of AI-powered data quality vs traditional methods.
Here's the practical difference:
Detection style | Best for | Weakness |
|---|---|---|
Manual rules | Known constraints and audit logic | Misses unknown unknowns |
AI anomaly detection | Pattern deviations and drift | Needs good baselining and review workflow |
The next point is easier to see in action:
How AI-based detection works in practice
A strong anomaly workflow doesn't replace engineering judgment. It changes where engineers spend time. Instead of manually updating hundreds of brittle thresholds, the system learns normal patterns across configured tables, continuously profiles incoming data, and compares new behavior against learned baselines. Engineers then review meaningful deviations rather than maintain a giant rule inventory.
That approach is most effective when paired with disciplined preprocessing and investigation. Teams still need clean inputs, missing-value handling, and sensible feature design before choosing model behavior or tuning sensitivity. They also need a response path for what happens after detection.
AI should find suspicious change. Engineers still decide whether that change is expected, harmful, or a signal to update assumptions.
For mature environments, the strongest pattern is hybrid. Use rules for hard business logic and compliance. Use anomaly detection for drift, trend breaks, unusual distributions, and silent pipeline failures that nobody explicitly specified in advance.
Architectural Choices In-Database Versus ETL-Based
Where monitoring runs matters as much as what it checks. Many teams treat this as an implementation detail. It isn't. Architecture determines latency, security posture, operating cost, and how quickly the team can investigate anomalies with full context.
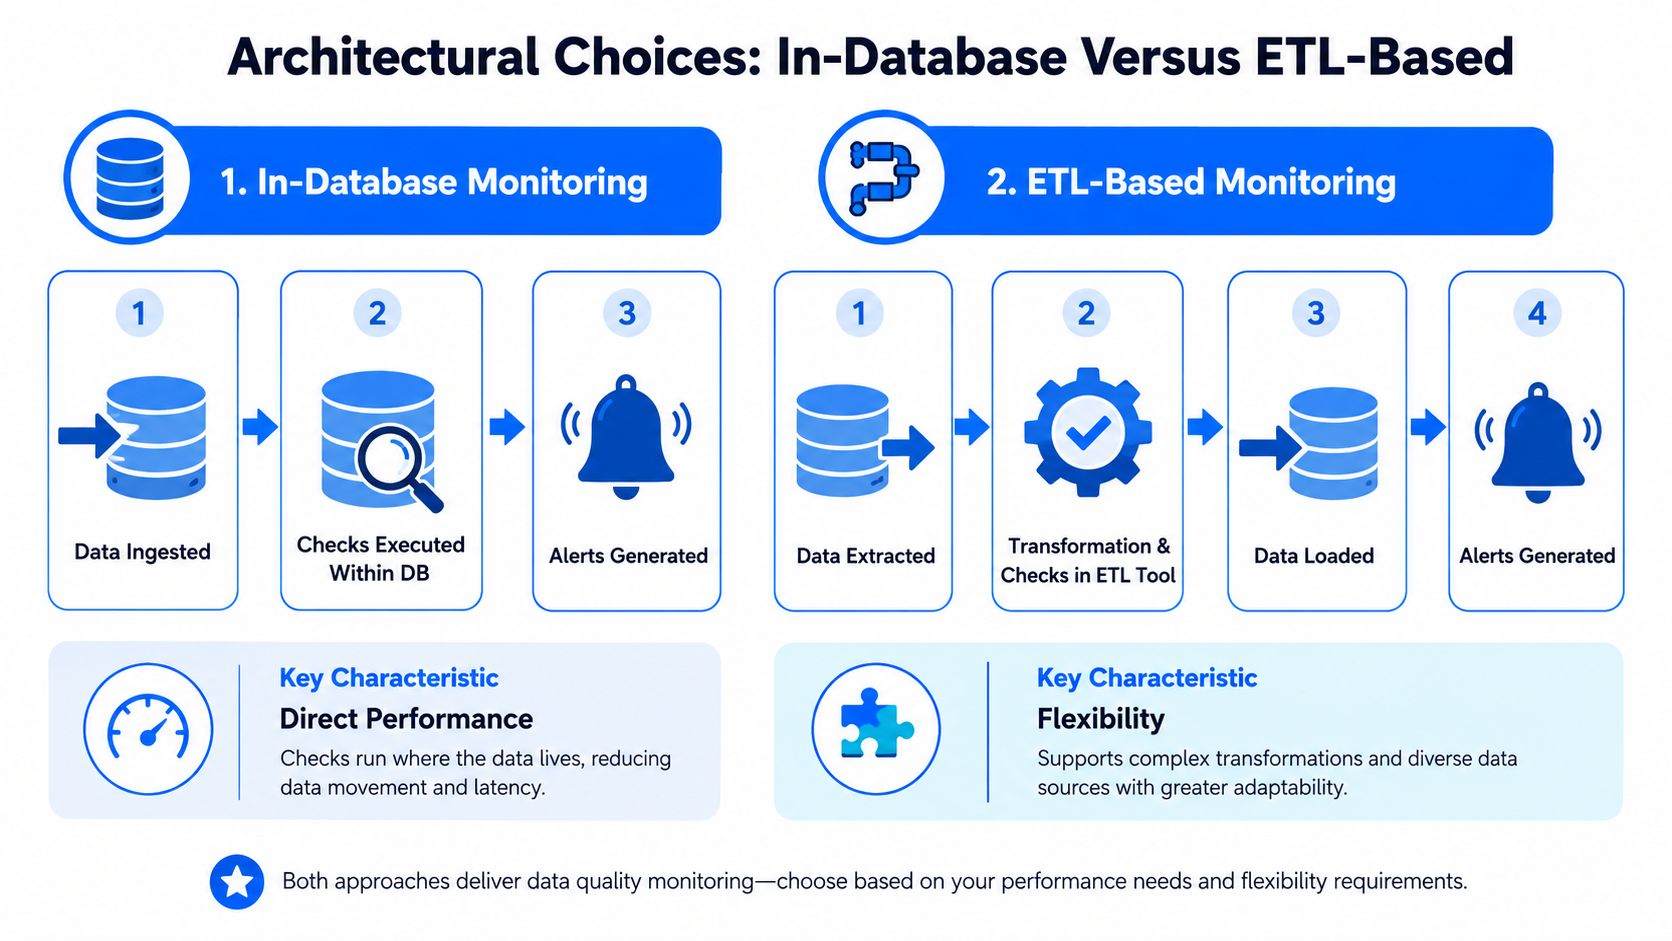
The two common patterns are straightforward. One approach extracts data into a separate environment for quality analysis. The other executes monitoring logic inside the warehouse or database where the data already lives.
Why ETL-based monitoring creates friction
External monitoring can look attractive at first. Teams already have ETL tooling, so adding checks there feels convenient. It may also offer flexibility for custom code or centralized orchestration. But the hidden costs show up quickly.
Moving data out for inspection introduces another path to secure, another runtime to manage, and another place where timing can drift from the production system. The more copies and intermediate steps you add, the harder it gets to answer simple questions like which version of the data was checked and when.
A few recurring problems with ETL-based monitoring:
Data movement overhead: Extracting data for checks adds latency and infrastructure complexity.
Security exposure: More movement means more surface area for access control and governance.
Debugging distance: Engineers investigate in one environment while the issue originated in another.
Freshness gaps: Checks may run on copied data rather than the live state that business users consume.
Why in-database monitoring is a better fit for enterprise operations
In-database monitoring pushes the computation down to the customer-controlled warehouse or database. That changes the operating model in useful ways. Data stays resident. Baselines can be learned close to the source. Timeliness, schema behavior, and statistical checks can be evaluated against the data that drives reports and models.
This matters most in regulated or high-scale environments. Private cloud and on-prem teams often can't accept a model that depends on vendor access to production data. They also can't afford long chains of movement just to compute observability metrics.
The under-discussed advantage is correlation. Recent analysis indicates that 85% of data quality tools monitor schema changes, while fewer than 20% effectively correlate real-time schedule delays with in-database metric computation baselines, which exposes a gap that in-database architectures are well suited to address, according to Frontiers in Big Data.
That gap matters because a lot of enterprise failures aren't just malformed values. They're combinations of timing, structural change, and behavioral drift happening together.
A practical decision lens
If you're choosing an architecture, evaluate it against operational questions rather than feature checklists.
Decision question | In-database monitoring | ETL-based monitoring |
|---|---|---|
Where does data stay? | In the customer environment | Often copied or staged externally |
How fast can checks reflect live state? | Closer to real time | Dependent on extraction timing |
How easy is root-cause analysis? | Closer to source context | Split across systems |
How well does it fit strict governance? | Strong fit | Often more review required |
The best monitoring architecture is the one that adds the least distance between the problem and the evidence.
There's also a practical staffing angle. Teams already stretched thin shouldn't spend their time maintaining a second analytics stack just to observe the first one. Keeping monitoring inside the warehouse reduces system sprawl and keeps investigation grounded in the same data platform engineers already use.
What works in the field
For enterprise-scale warehouses and complex pipelines, the strongest implementations usually share a few traits:
They compute metrics where the data resides. That reduces movement and keeps checks aligned with production reality.
They combine structural and behavioral monitoring. Schema checks alone won't catch schedule drift. Freshness checks alone won't catch type changes.
They support baseline learning over time. Static snapshots don't help much when usage patterns evolve.
They fit private cloud or on-prem constraints. Security requirements aren't a side concern in finance, healthcare, telecom, or public sector environments.
Teams that ignore these choices often end up with fragmented monitoring. One tool watches jobs. Another inspects transformations. A third handles validation. Incidents then require stitching together timestamps, alerts, and screenshots by hand. That's not observability. It's manual archaeology.
A Practical Runbook for Solving Data Problems
Monitoring becomes useful when it changes how the team responds to common failures. The best runbooks are short, specific, and tied to business impact. They tell engineers what to watch, what signal matters, and what action should follow.
Stale reports and late data
Problem first. A dashboard refreshes on schedule, but the underlying source arrived late. The report looks current because the BI layer rendered successfully. The business sees old numbers and assumes they're fresh.
The runbook should center on timeliness and expected-arrival monitoring:
Track delivery patterns: Don't rely only on job success. Monitor when data usually lands and alert on abnormal delay.
Check downstream readiness: A table can update while dependent marts remain stale.
Escalate by business criticality: Executive reporting, finance close, and operational alerting shouldn't share the same alert thresholds as exploratory analytics.
The desired outcome isn't just an alert. It's a decision gate. If freshness fails, the dashboard should be treated as untrusted until the load is verified.
ML drift and schema changes
ML systems fail imperceptibly when input distributions or structures shift. Features can stay populated while becoming behaviorally different from training assumptions. A renamed field can also break transformations upstream of the model without producing an obvious application outage.
A practical runbook uses three layers together:
Failure type | Monitoring signal | Response |
|---|---|---|
Late feature updates | Timeliness deviation | Hold scoring or retraining input |
Distribution drift | Statistical anomaly | Review feature behavior and source change log |
Schema mismatch | Structural change alert | Block downstream consumption until mapped |
The point isn't to catch every oddity. It's to stop silent degradation before predictions influence pricing, ranking, fraud review, or operations.
Compliance and audit evidence
Compliance use cases need something different from anomaly alerts. They need evidence that can be reviewed and defended. That usually means record-level validation tied to explicit rules, plus a way to map statistical findings into governance language people outside engineering can use.
An IDC study reveals that 70% of enterprises struggle to validate AI findings for regulatory audits, which is exactly why teams need runbooks that translate anomalies into structured compliance evidence, as discussed in this NIH-hosted analysis.
That translation layer matters. An engineer may understand a deviation as an outlier or drift event. An auditor wants to know whether integrity, completeness, or consistency was affected, what controls were triggered, and who reviewed the issue.
Build your runbook so that an anomaly can become an incident record, not just a graph on a monitoring screen.
A solid compliance runbook usually includes:
Explicit validation rules: Use deterministic checks for mandatory policy logic.
Severity mapping: Tie anomalies to governance categories that stakeholders understand.
Investigation notes: Capture what changed, where it was detected, and whether downstream outputs were affected.
Closure criteria: Define what evidence resolves the incident and what requires remediation.
Putting the runbook into daily operations
The teams that get value from data quality monitoring don't chase perfect coverage. They start with the places where bad data creates immediate business risk. Executive reports, revenue pipelines, ML feature tables, regulated datasets. Then they attach detection, ownership, and response.
That's the difference between a monitoring program and a collection of checks. One changes how the organization handles uncertainty. The other just produces alerts.
If your team needs data quality monitoring that runs inside your own environment, covers anomalies, timeliness, validation, and schema changes in one place, take a look at digna. It's built for enterprise data teams that want earlier detection, less tool sprawl, and a clearer path from signal to action.
For the stale-report runbook in practice, see how digna Timeliness monitors expected data arrival inside your own environment so late loads are caught before they reach a dashboard.
Frequently asked questions
What is data quality monitoring?
Data quality monitoring is a continuous control system that checks whether data still behaves the way the business expects where it is used, not just whether it arrived. The article describes four layers: behavioral monitoring of volume and distributions, structural monitoring of schema drift, operational monitoring of schedules, and business validation.
Which data quality metrics should I monitor?
Start from five questions: is the data complete, accurate, consistent across systems, on time, and structurally valid? Citing Congruence Market Insights, the article notes rigorous monitoring can average 99.9 percent completeness, 99.8 percent accuracy and 96.3 percent timeliness. Track them by criticality, holding executive finance marts to the strictest standard.
Should I use AI anomaly detection or manual data quality rules?
Use both. Manual rules remain right for explicit constraints, such as an order status from a known set or a payment date that cannot precede contract creation. AI anomaly detection learns baselines and catches drift, trend breaks and unusual distributions nobody encoded, which is why the article recommends a hybrid approach.
Why is in-database monitoring better than ETL-based monitoring?
In-database monitoring computes metrics where the data lives, avoiding the latency, security exposure, debugging distance and freshness gaps of extracting data for checks. The article cites Frontiers in Big Data: 85 percent of tools monitor schema changes, but fewer than 20 percent correlate schedule delays with in-database metric baselines.
How do you detect stale reports caused by late data?
Monitor when data usually lands and alert on abnormal delay instead of trusting job success. In the article's example, Airflow marks a load green at 6:12 a.m., but the executive dashboard refreshed at 6:00. Check downstream mart readiness, escalate by business criticality, and treat the dashboard as untrusted until verified.



