Data Profiling Techniques That Actually Catch Drift
|
7
min read

You usually don't notice a profiling gap when everything is green. You notice it when a dashboard still loads, a finance team still trusts the number, and a model starts making worse calls because a source table changed shape, a field started carrying mixed values, or a join stopped lining up the way it used to.
That's the job of data profiling techniques. Not to produce a tidy spreadsheet of statistics, but to catch structural, semantic, and behavioral drift before it reaches analysts, BI layers, or ML pipelines. In practice, the teams that ship reliable warehouses treat profiling as part of the flow of data, not a side audit that happens once and gets filed away.
Table of Contents
Distribution Analysis, Drift Detection, and the Sampling Trap
From One-Off Audits to Continuous Profiling and Observability
When a Silent Drift Breaks the Dashboard
A quarterly revenue dashboard can look perfectly healthy while the pipeline underneath is already drifting. The source table still lands, the job still finishes, and the metric still renders, but one transformation path no longer matches a new currency code. The forecast degrades first, then the analysts start asking why the numbers feel “off,” and only later does someone discover that the warehouse was accepting a shape of data the downstream logic never expected.
That's why profiling has to live inside the pipeline. A spreadsheet audit can tell you a column has nulls, but it won't save you when the issue is a schema change, a broken relationship between tables, or a value pattern that no longer matches the business rule your code assumes. The core value of data profiling techniques is that they expose those problems early enough to still matter.
Practical rule: if a data issue can break a dashboard, a report, or a model without changing the row count, simple freshness checks aren't enough.
The best teams think about profiling as an operational discipline. They don't ask whether the data is “clean” in some abstract sense. They ask what failure mode each technique can catch, where it fits in the flow, and what it still misses. That's the difference between a one-off inspection and an observability practice.
A useful way to frame it is through data observability itself, which connects profiling, monitoring, and validation into one operational loop. A good overview is what is data observability from NanoPIM, because it helps anchor why profiling belongs with live monitoring rather than separate documentation.
The important shift is mental, not technical. Profiling is not there to create more artifacts. It's there to catch drift before the business feels it.
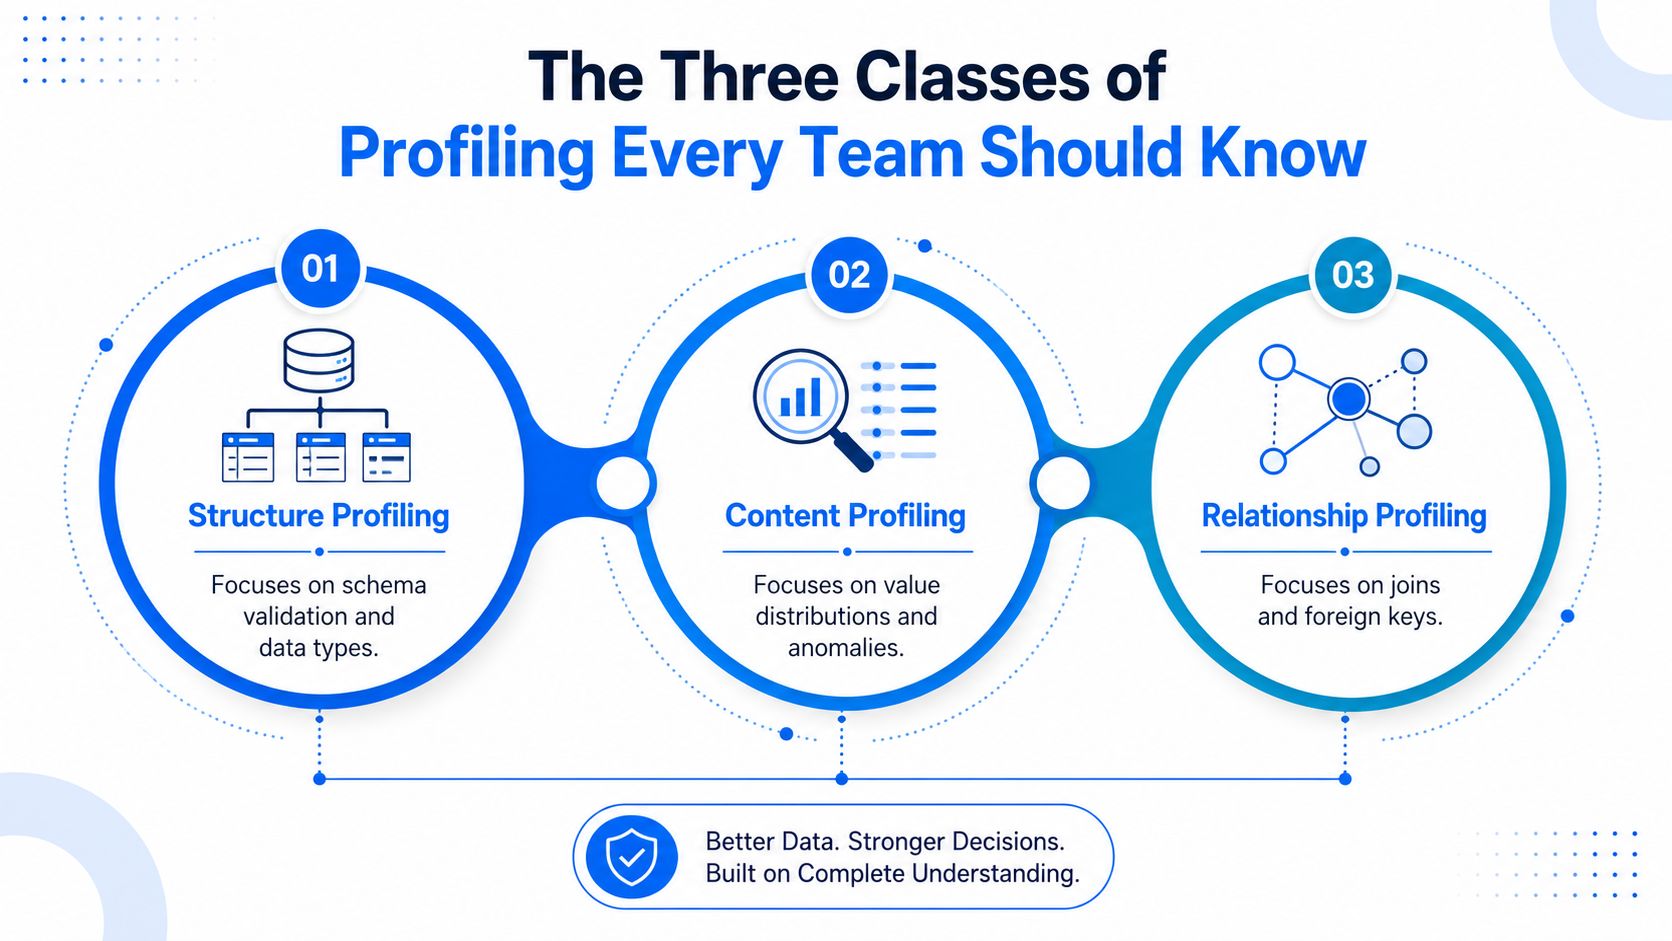
The Three Classes of Profiling Every Team Should Know
Data profiling is formally defined in academic literature as the set of activities and processes used to determine metadata about a dataset, and it's also described as creating small but informative summaries of a database (HPI). That definition matters because it keeps the work grounded in summaries, not full manual inspection.
Structure discovery
Structure discovery answers the question, “Does this dataset look like the system thinks it does?” It checks schema, types, keys, and format consistency. In a customer table, that's where you catch a column that looks numeric but is a mix of currency-formatted strings, or a field that's been repurposed and now contains values the warehouse logic can't parse cleanly.
Content discovery
Content discovery stays inside the values themselves. It measures nulls, distinct counts, min and max values, length, frequencies, and patterns, which is why it's often the first line of defense for completeness and consistency. The government-oriented overview from datos.gob.es on the importance of data profiling makes this concrete by calling out null counts, distinct values, data types, and frequent patterns as core checks.
Relationship discovery
Relationship discovery looks across fields and tables. It's where you find functional dependencies, foreign key candidates, cardinality issues, and cross-table mismatches. In warehouse terms, it catches cases where two tables reference the same business entity but disagree on whether null is allowed, or where one table stopped matching the parent table's keys.
The useful mental model is simple. If the problem is inside one column, you're in content territory. If it's inside a row, cross-column profiling helps. If it spans tables, relationship profiling is the right lens. That's also why a broader observability platform is valuable, because a modern warehouse doesn't fail in just one dimension. It fails when structure, content, and relationships stop agreeing with each other, and digna's data profiling meaning sits naturally in that operational view.
Comparing the Core Techniques That Catch Real Failures
A lot of profiling advice stops at naming metrics. That's too shallow for production work. The question is which technique stops which failure, and which one only makes the problem visible after it has already reached the warehouse.
Profiling techniques at a glance | Catches | Misses | Best fit |
|---|---|---|---|
Column-level statistics | Null rates, ranges, distinct counts, length shifts, obvious outliers | Cross-field logic, relationship breaks, business-rule context | First-pass checks on critical columns |
Pattern and semantic profiling | Mixed types, malformed strings, format drift, value-pattern changes | Valid-looking values that are semantically wrong | IDs, emails, codes, dates, currency fields |
Uniqueness and foreign key checks | Duplicate keys, referential integrity failures, join mismatches | Distribution drift inside a column, seasonal variation | Fact-to-dimension integrity, entity resolution |
Column-level statistics are cheap and useful. They tell you when a field's completeness changes, when the range moves, or when distinct counts suddenly collapse. They're not enough when the data still “looks” valid but no longer matches how the business uses it.
Pattern and semantic profiling serve a different purpose. They identify issues like mixed-type columns, broken formats, or fields that begin containing values from a new source system. Regex checks and format rules prove valuable here, as a value can be non-null yet still be incorrect.
A uniqueness check on an email field is a quality control. A uniqueness check on a free-text comment field is noise.
Relationship checks are the most underrated because they catch failures that simple field scans never see. Duplicate keys, missing parents, and cross-table mismatches can destroy trust even when each table looks reasonable on its own. For warehouse engineers, that's often the difference between a row-level issue and a pipeline-level incident.
The trade-off is cost. Full-scale checks can be expensive on very large tables, so teams usually reserve the more intensive relationship logic for high-value joins, critical dimensions, and tables that feed reporting or models. That's also why choosing the technique matters more than choosing a dashboard. The wrong check can feel thorough while missing the failure that hurts.
Distribution Analysis, Drift Detection, and the Sampling Trap
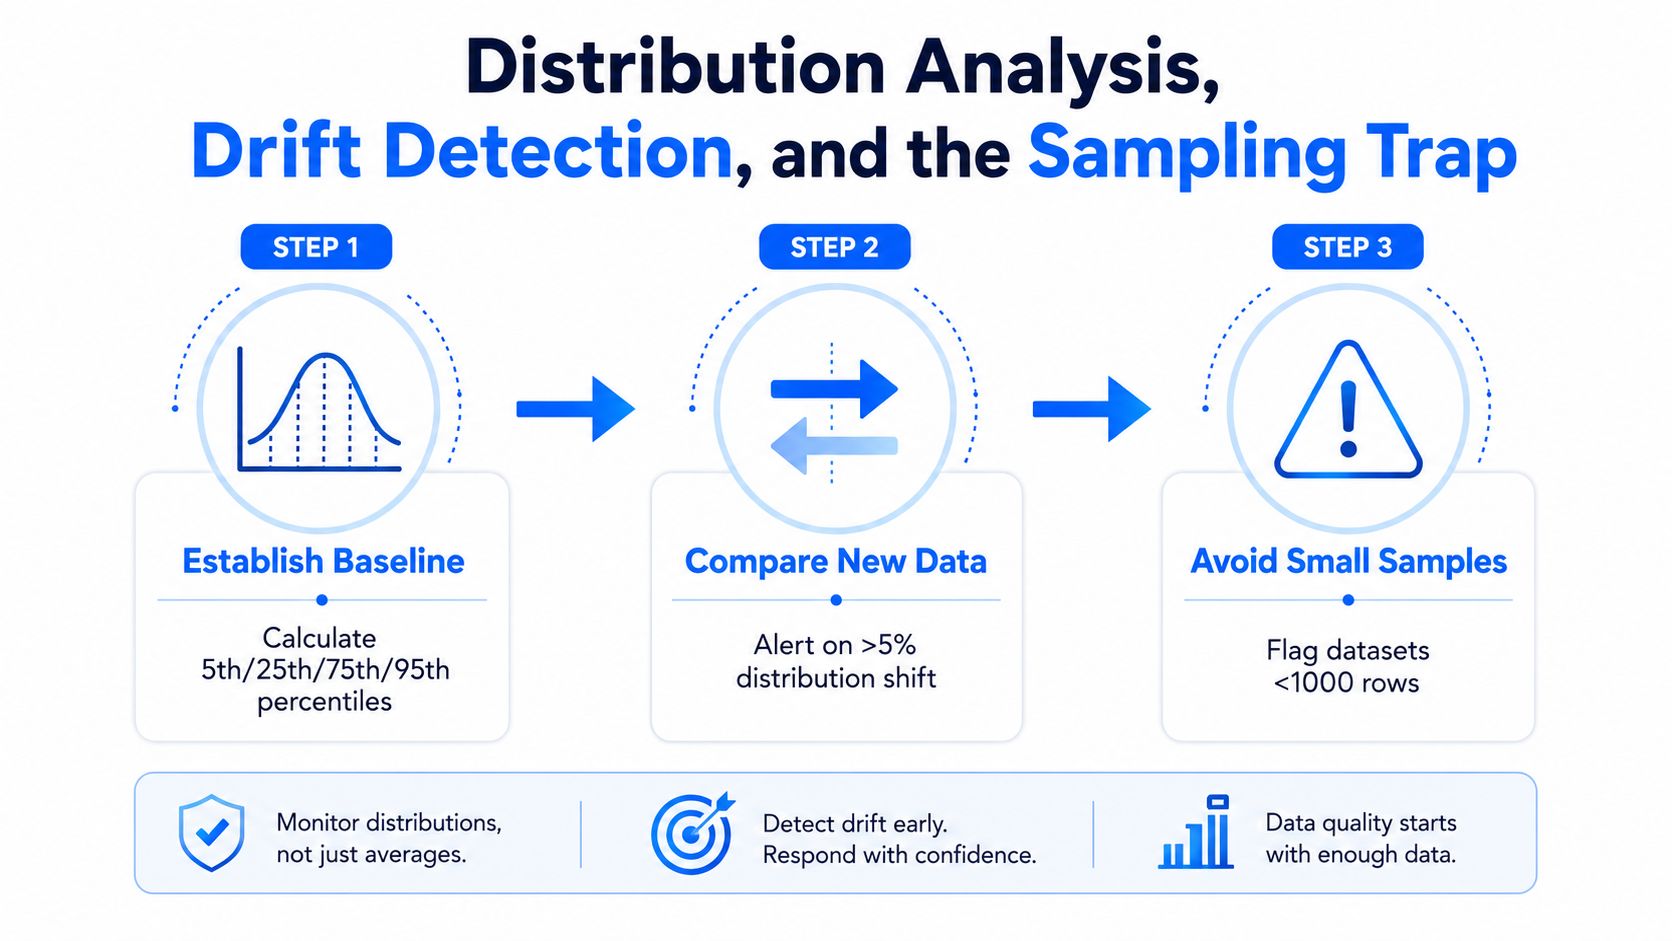
Distribution analysis is where profiling starts to look like observability instead of bookkeeping. Histograms, quantile sketches, and categorical frequencies let you see whether a column still behaves like it did yesterday, last week, or at project launch. The goal isn't just to count values, it's to notice when the shape of the data changes enough to threaten downstream decisions.
Baselines are the real asset
The mistake many teams make is treating a single profile as the deliverable. The useful asset is the baseline. Once you know the usual spread of values, you can compare new arrivals against it and spot drift that doesn't show up in row counts or null rates. That's especially important for AI and analytics inputs, where silent distribution shifts can degrade performance without breaking the pipeline.
Sampling helps, until it doesn't
A common operational pattern is to profile a 10,000-row sample when full-table analysis isn't practical, then derive the same descriptive statistics from that sample to guide remediation and reporting design (sparvi.io). That works well when the table is huge and the goal is to get a fast read on the data. It breaks down when the anomalies are rare, skewed, or tied to specific partitions that a random sample might miss.
Drift needs context, not just thresholds
A baseline alone doesn't tell you whether a change is bad. That's where drift detection and business context meet. The useful habit is to keep cheap metrics running continuously, then escalate to deeper checks when the profile changes in a way that matters to a specific domain, join path, or model input.
The practical takeaway is to treat profiling as a multi-resolution problem. Low-cost summaries run often. More expensive checks run on schedule or on change. And the signal only matters when it's evaluated against actual business impact, not just a universal threshold.
The earlier guidance from data drift detection at digna fits this logic well, because drift is only useful when it's tied to a real baseline and a real operational response.
Implementing Profiling in SQL and In-Database
The cleanest profiling systems are the ones that keep the data where it already lives. Push-down execution inside the warehouse avoids extra movement, reduces governance headaches, and makes profiling cheap enough to run often. Extract-then-profile can work for small or temporary jobs, but it adds latency and creates another place where sensitive data can leak into a separate engine.
Start with aggregate-first SQL
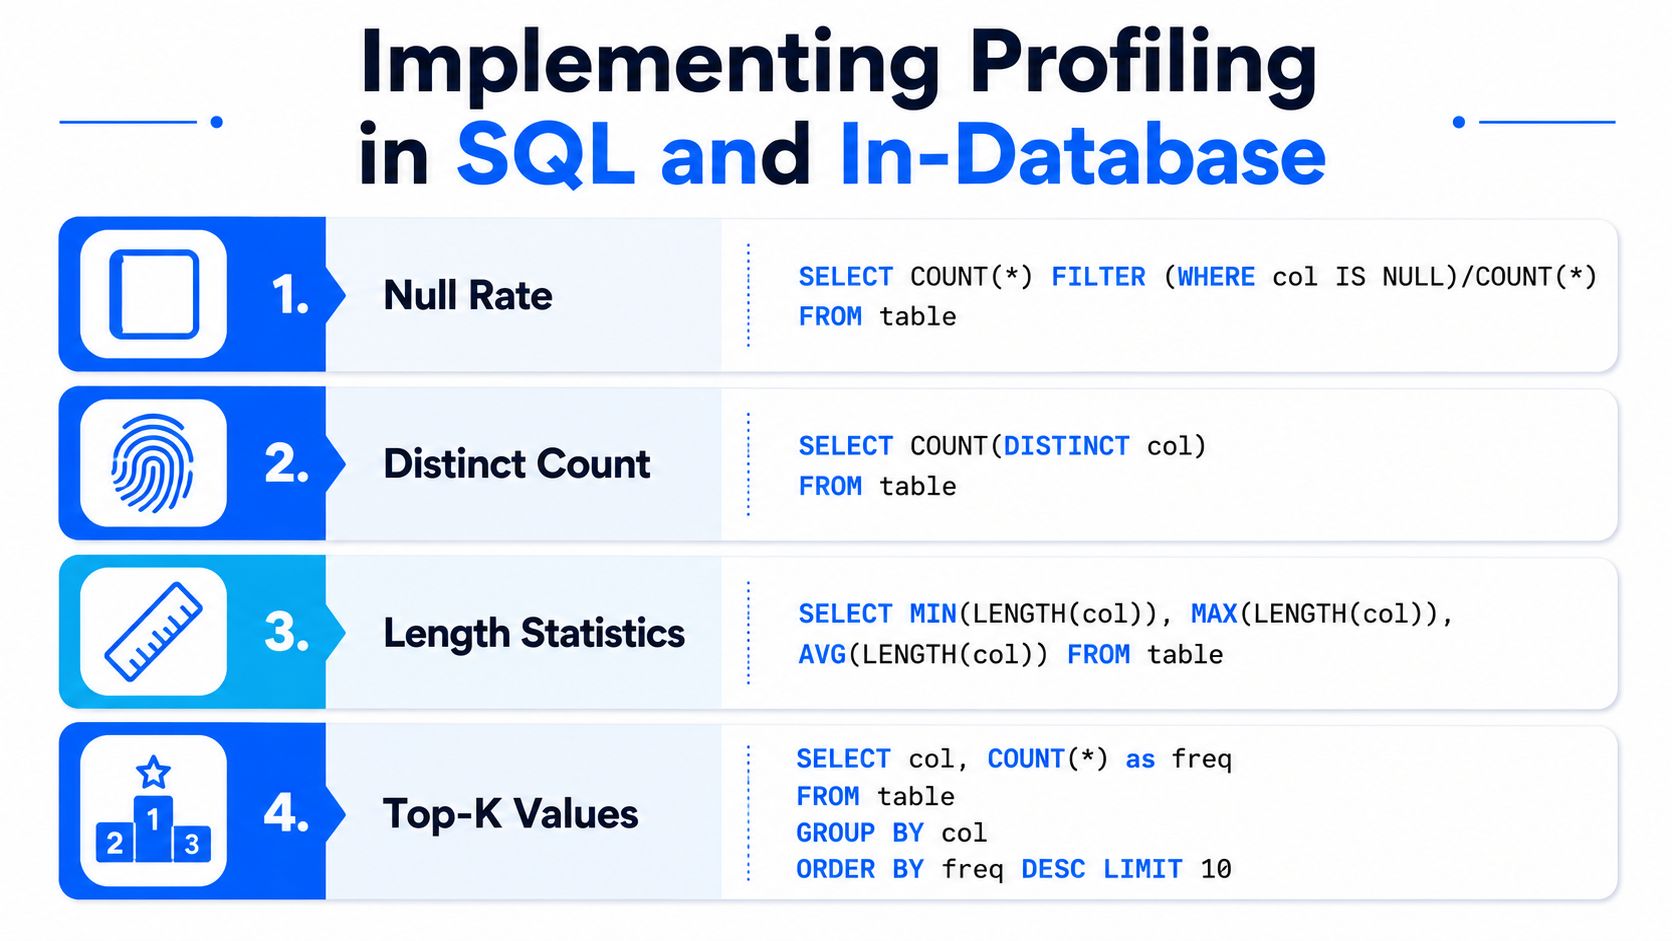
Null rate, distinct count, length statistics, and top-K values are the workhorses of warehouse profiling. They're fast, easy to explain, and immediately useful for spotting missingness, duplication, and format drift. In most warehouses, these are the first metrics I'd expect a profiling job to compute natively.
Use approximate algorithms where scale demands it
Exact cardinality and distribution work becomes expensive at enterprise scale, which is why approximate methods matter. HyperLogLog helps with cardinality, while t-digest or quantile sketches help preserve distribution shape without scanning every record in the most expensive way. The point isn't mathematical elegance, it's making profiling affordable enough to run continuously.
Operational rule: if a profiling job needs to move raw data out of the warehouse to be practical, it's probably the wrong shape for production.
Keep the summary, not the raw copy
In-database profiling also helps with data residency. Only summaries leave the warehouse, so the output becomes metadata, trends, and alerts rather than another copy of the source system. That matters for teams in finance, healthcare, telecom, and the public sector, where access controls and auditability are part of the design, not afterthoughts.
For teams evaluating platforms, a useful reference point is whether the tool supports profile baselines, schema tracking, null and distinct counts, and validation rules without depending on a separate extraction step. digna is one option in that category, because it computes metrics inside the customer environment and keeps the data resident while surfacing trends, schema changes, and validation signals.
The best profiling workflows don't feel like jobs you “run.” They feel like instrumentation. The warehouse is already doing the work, and the profiling layer just extracts the useful signals.
From One-Off Audits to Continuous Profiling and Observability
Profiling that only runs at project start is already too late for modern pipelines. Source systems change, columns get added, data types shift, and arrival patterns slip without warning. If profiling stays a one-time audit, it becomes documentation, not protection.
The useful evolution is to feed profiling into observability. Column statistics, pattern checks, schema tracking, and baseline comparisons become inputs to anomaly detection, timeliness monitoring, and validation rules inside one operational surface. That combination matters because a warehouse can be structurally valid and still deliver stale or misleading data.
What continuous profiling actually changes
Continuous profiling gives teams three things they don't get from a static report. It gives them history, so changes can be compared over time. It gives them context, so an alert can be tied to a table, a field, or a downstream dependency. And it gives them prioritization, so the team can focus on signals that affect real workflows instead of every harmless fluctuation.
Why observability wins over spreadsheets
Spreadsheet-style profiling is fine for a one-off investigation, but it doesn't scale as a control plane. The second the data changes faster than the spreadsheet can be refreshed, the manual process becomes a lagging indicator. An observability platform turns profiling into a live system of record for data health.
The moment profiling data starts getting reviewed after the stakeholder already noticed the issue, you've lost the advantage.
That's also where a platform like digna fits naturally. Its anomaly detection learns normal behavior without forcing teams to maintain thousands of handcrafted rules, schema tracking flags added, removed, or type-changed columns, and timeliness monitoring compares actual arrival against learned expectations. Because it runs in the customer environment, the analysis stays inside the warehouse or controlled deployment instead of bouncing data through extra systems.
The practical shift is simple. Static profiling asks what the data looked like. Continuous profiling asks what changed, when it changed, and whether anyone needs to act now.
Separating Harmless Variation From Business-Critical Change
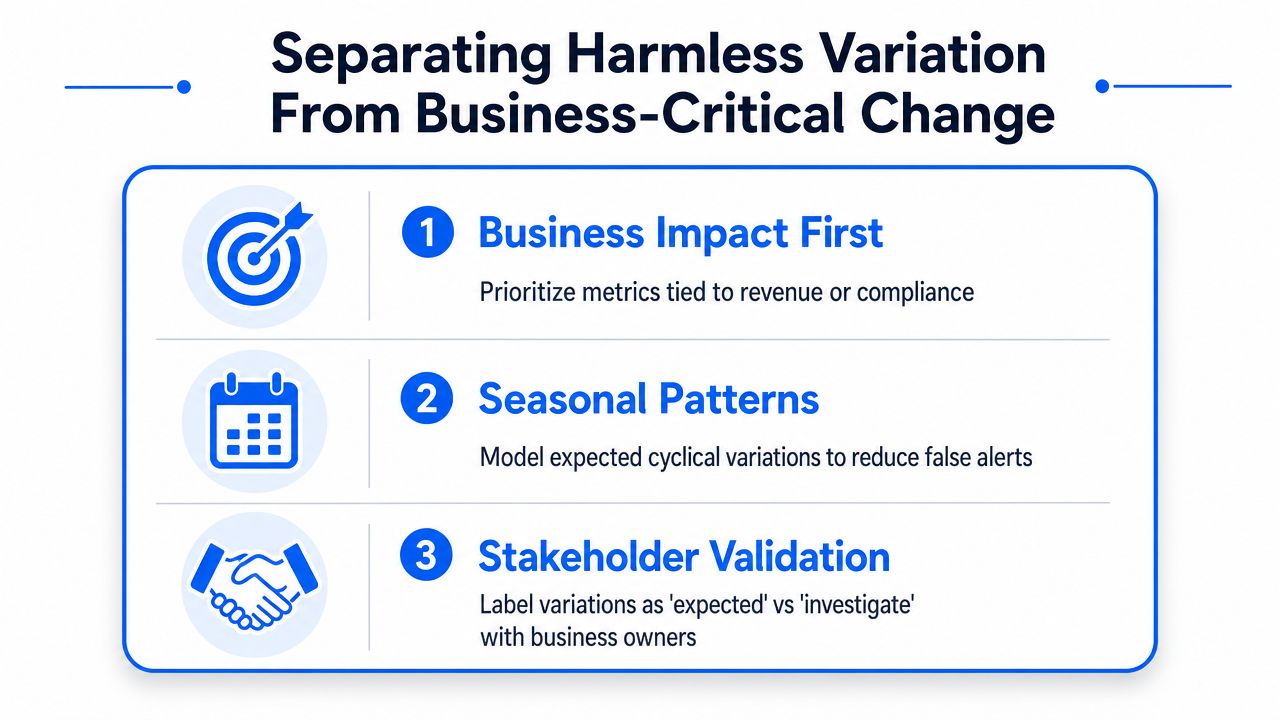
More metrics don't automatically create better profiling. They can create a louder alarm system that still misses the change that matters. Senior teams learn to sort signals by business impact before they decide whether a spike is a defect, a seasonal shift, or just a variation worth watching.
Prioritize what the business will feel
If a change doesn't affect a regulated metric, a machine learning feature, a downstream SLA, or an executive report, it shouldn't get the same attention as one that does. Profiling becomes risk management. The right question is not whether a signal exists, but who gets hurt if it's ignored.
Don't treat every domain the same
Finance, healthcare, telecom, and public-sector reporting can't use the same default sensitivity. Their tolerances differ because the cost of a false negative and a false positive differ. A field that can drift safely in one domain may be unacceptable in another, even if the raw numbers look similar.
Pair statistical checks with business rules
Statistical profiling can tell you something changed. Business rules tell you whether that change is expected. That pairing lowers false positives without dulling sensitivity, especially when seasonal or cyclical patterns are part of normal operations.
A good triage playbook is short. It names the owner, the escalation path, and the label for the variation, expected or investigate. It also gives business users a way to validate whether the shift fits known behavior before engineers spend time chasing a non-issue.
The useful mindset here is honesty. Profiling is not scorekeeping, and a bigger list of alerts doesn't mean a safer warehouse. It means more work unless the signals are sorted by impact.
Operational Checklist for Production-Ready Profiling
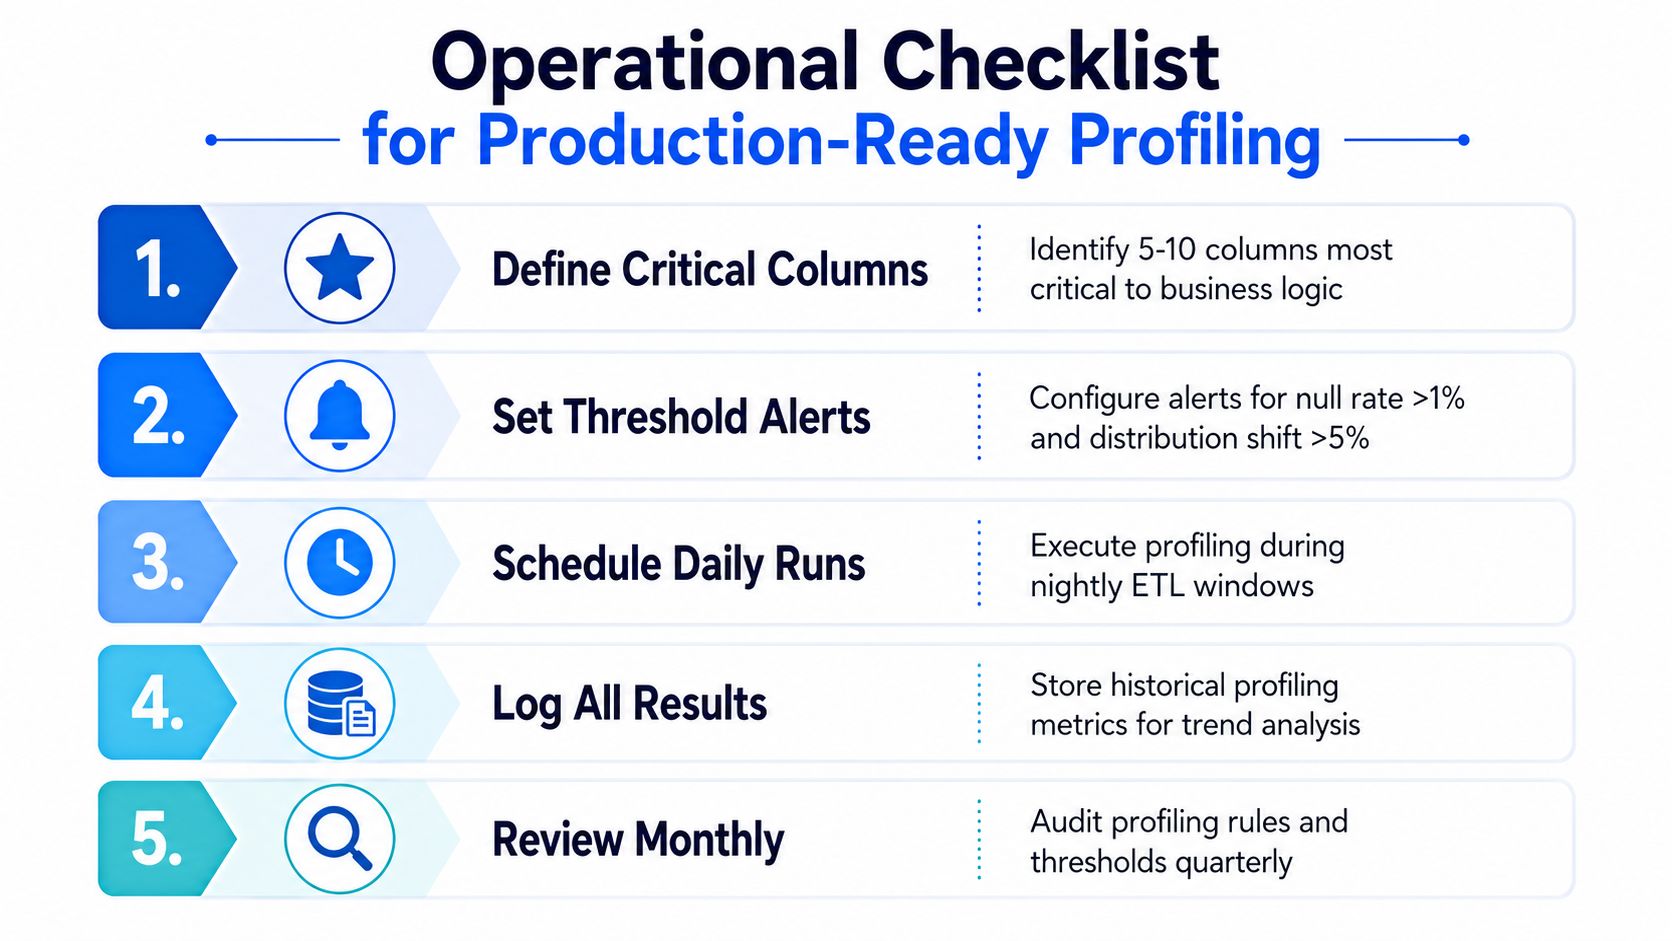
The safest production pattern is to profile early, profile in place, and profile continuously. That means running checks at project start, before ETL, during transformation, and again after the pipeline is live. It also means covering column, cross-column, and cross-table behavior, because the failure you miss is usually the one outside the scope of the current check.
What to put in place first
Start with the columns that matter to business logic, not the entire warehouse. Then define thresholds for nulls, drift, and validation rules around those fields, and store the results so you can compare today against yesterday. Historical context is what turns a profile into an alerting system.
What to avoid
Don't push raw data into a separate profiling engine unless you have to. Don't rely on averages alone. Don't treat a schema scan as proof that the data is safe. And don't let every team invent its own thresholds without a shared policy, because that's how alert noise piles up.
The production habit that sticks
Run profiling where the data already sits, track schema changes alongside statistics, and route signals through one place that can combine anomaly detection, timeliness, and validation. That's the shape of a real control plane, and it's the reason in-database observability outperforms spreadsheet-style profiling for modern warehouses.
If you're choosing a platform or tightening an existing workflow, start by profiling the tables that drive revenue, reporting, and model input quality, then wire the highest-risk checks into a continuous monitoring layer. If you want that to run inside the warehouse with anomaly detection, schema tracking, and validation in one system, take a close look at digna.
To keep profile baselines as history and compare today's statistics with last week's, see how digna Data Analytics tracks trends and statistical patterns over time.
Frequently asked questions
What are the main types of data profiling?
There are three classes. Structure discovery checks schema, types, keys and format consistency. Content discovery measures nulls, distinct counts, min and max values, lengths, frequencies and patterns. Relationship discovery looks across fields and tables for functional dependencies, foreign key candidates, cardinality issues and cross-table mismatches.
Is sampling good enough for data profiling?
Sampling gives a fast read but has clear limits. A common pattern profiles a 10,000-row sample when full-table analysis is impractical, then derives descriptive statistics from it. It breaks down when anomalies are rare, skewed or tied to specific partitions that a random sample can miss, so critical tables need fuller coverage.
How do you profile data in SQL at scale?
Begin with aggregate-first SQL: null rate, distinct count, length statistics and top-K values, computed natively in the warehouse. For enterprise-scale tables, switch to approximate algorithms such as HyperLogLog for cardinality and t-digest or quantile sketches for distribution shape, so profiling stays cheap enough to run continuously without moving raw data.
How does data profiling detect data drift?
Drift shows up when new data is compared against a stored baseline. Histograms, quantile sketches and categorical frequencies reveal whether a column still behaves as it did yesterday or last week, catching shifts that never appear in row counts or null rates. Cheap metrics run continuously, and deeper checks trigger when the profile changes.
What is the difference between one-off and continuous data profiling?
One-off profiling records what the data looked like at project start; continuous profiling tracks what changed, when, and whether anyone must act. It adds history for comparison over time, context that ties an alert to a table, field or dependency, and prioritization so teams focus on signals that affect real workflows.


