Anomaly Detection for Categorical Data Explained
|
7
min read

You already know the failure mode. The dashboard is calm, the numeric checks are clean, and the model that worked fine last week starts returning nonsense because one categorical field changed in a way nobody noticed. A new status code appears, a product category gets remapped, or a vendor starts sending a different country label, and the breakage only shows up after the downstream system has already made bad decisions.
That's why anomaly detection for categorical data needs its own playbook. In categorical spaces, the signal usually lives in rare values, unexpected combinations, and joint frequency shifts, not in distance from a mean or a large numeric jump. The practical task is to catch those changes early enough that data engineers, analysts, and model owners can act before trust erodes.
Table of Contents
The Hidden Risks of Categorical Data Shifts
The worst incidents rarely begin with a loud failure. A pipeline keeps running, row counts look normal, and the only thing that changed is a label that nobody thought to monitor. Then a model starts classifying customers strangely because the category mix it learned no longer matches production reality.
Categorical anomalies are different from numeric outliers. A numeric anomaly might be a value far from the average, but a categorical anomaly is often a level, or a combination of levels across fields, that appears with unusually low frequency against the baseline population. That's why the category itself matters less than how often it occurs and how it co-occurs with other fields, which is the core logic described in the categorical anomaly detection literature on sparse contingency patterns and joint-value rarity Springer chapter on categorical anomaly detection.
A production failure usually starts as a small label change
A finance team might see the same transaction volume, but a payment status code changes shape, and the downstream rules no longer match the underlying process. A healthcare team might keep getting valid-looking claims, while one field begins carrying a new coded value that the old validation logic never learned. In both cases, the numbers stay steady long enough to hide the problem.
That's why teams need to watch categorical change as a first-class signal. A category distribution can drift without any single field looking extreme on its own, and a joint pattern can be anomalous even when every individual field looks normal. The practical risk is that a simple dashboard gives a false sense of stability.
For a working example of the broader monitoring problem, the data drift patterns discussed in digna's data drift detection overview fit directly into this category-shift view. The operational lesson is simple, if the label space changes, the model's world changes too.
Practical rule: if a categorical field can change business meaning without changing row volume, it belongs in your anomaly checks.
Why Standard Algorithms Fail on Categorical Features
Most numeric anomaly tools assume a geometry that categorical data doesn't have. Euclidean distance works for points in a continuous space, but a country code, a transaction type, or a claim status isn't “close” or “far” in any meaningful ordinal sense. Treating labels like coordinates turns a discrete problem into a fake numeric one.
That mismatch matters most when cardinality is high. As categorical variables grow more granular, contingency tables get sparse, and the useful signal moves into rare intersections rather than large magnitudes. The standard survey literature notes that classical anomaly methods often assume continuous data, which is why categorical variables are frequently translated into continuous attributes before detection, even though that translation can erase the very structure you need to inspect CEUR survey on anomaly detection methods.
Sparse contingency patterns are where the misses happen
A country code alone may look ordinary. A payment type alone may look ordinary. A device class alone may look ordinary. But the combination of those three fields can be rare enough to deserve attention, and numeric-distance methods often miss that because they focus on magnitude instead of co-occurrence.
This is why high-cardinality categorical variables cause trouble. One-hot encoding can explode dimensionality, standard deviation thresholds become meaningless, and Z-scores don't tell you whether a new code is unusual or merely new. In practice, teams need methods that score rarity, compare distributions, and respect the discrete nature of the data.
A better mental model starts with frequency, not distance
Think in terms of category support, conditional frequency, and observed-versus-expected counts. If a category level is common in historical data but suddenly disappears, that can matter. If a rare level suddenly becomes dominant, that can matter too. The method should reflect that logic instead of forcing the data into a geometric shape it never had.
Statistical pattern recognition for categorical fields is the right lens here because it treats labels as labels, not as disguised numbers. That's the difference between a pipeline that flags actual category shifts and one that just produces mathematical noise.

Statistical Baselines and Frequency Scoring
Start with a baseline that reflects what normal looks like for each categorical field. For a stable column, that baseline is usually the historical frequency distribution of each category level, plus the joint frequencies that matter for the business process. If the data are seasonal or workflow-driven, compare like with like instead of assuming one global baseline fits everything.
Compare observed counts to expected counts
The chi-squared test is a standard way to compare observed category frequencies with a baseline distribution for categorical drift, and the guide on data drift in streaming describes it as suitable for shifts in fields such as status codes or product categories Conduktor's data drift guide. PSI is also useful for turning distribution change into an operational severity level. The same guide gives PSI thresholds of less than 0.1 for minimal drift, 0.1 to 0.25 for moderate drift that needs investigation, and greater than 0.25 for significant drift that needs immediate action.
PSI Value | Drift Severity | Recommended Action |
|---|---|---|
Less than 0.1 | Minimal drift | Monitor and keep the baseline active |
0.1 to 0.25 | Moderate drift | Investigate the category source and downstream impact |
Greater than 0.25 | Significant drift | Treat as urgent and review pipeline or business changes |
Use entropy when you want a quick feel for unpredictability
Entropy is useful because it tells you how spread out a category distribution is. Low entropy means the data are concentrated in a few levels. Higher entropy means the distribution is more mixed, which can signal a new source, a broader business change, or a messy upstream integration.
That doesn't make entropy a full detector on its own. It's a profiling signal, not a verdict. Use it to spot when a categorical field has become more or less predictable, then confirm with count-based checks or joint-frequency scoring.
For teams that need a structured way to connect profiling to detection, data profiling techniques give the right supporting context. And if you need a clean explanation of how statistical significance helps you decide whether a shift is worth acting on, the significance guide for growth leaders is a useful adjacent read.
Keep the workflow simple enough to operate
Profile the column first. Build category counts, null rate, and a top-k view of levels that appear most often.
Compare against a baseline. Use chi-squared or PSI when the question is distribution shift.
Check the joint patterns. If the marginal distribution looks fine, inspect combinations across fields.
Escalate based on severity. A small shift can be monitored, but a strong shift needs human review.
The point isn't to replace machine learning. The point is to avoid jumping straight to complexity before the simplest statistical tests have done their job.
Machine Learning Adaptations for Complex Distributions
Some categorical problems are too messy for simple frequency checks alone. They involve many fields, changing business rules, and interactions that show up across category combinations rather than inside a single column. In production pipelines, that usually means you need models that can learn structure from sparse, high-cardinality data without hiding the operational issues underneath.
Embeddings help when cardinality gets unwieldy
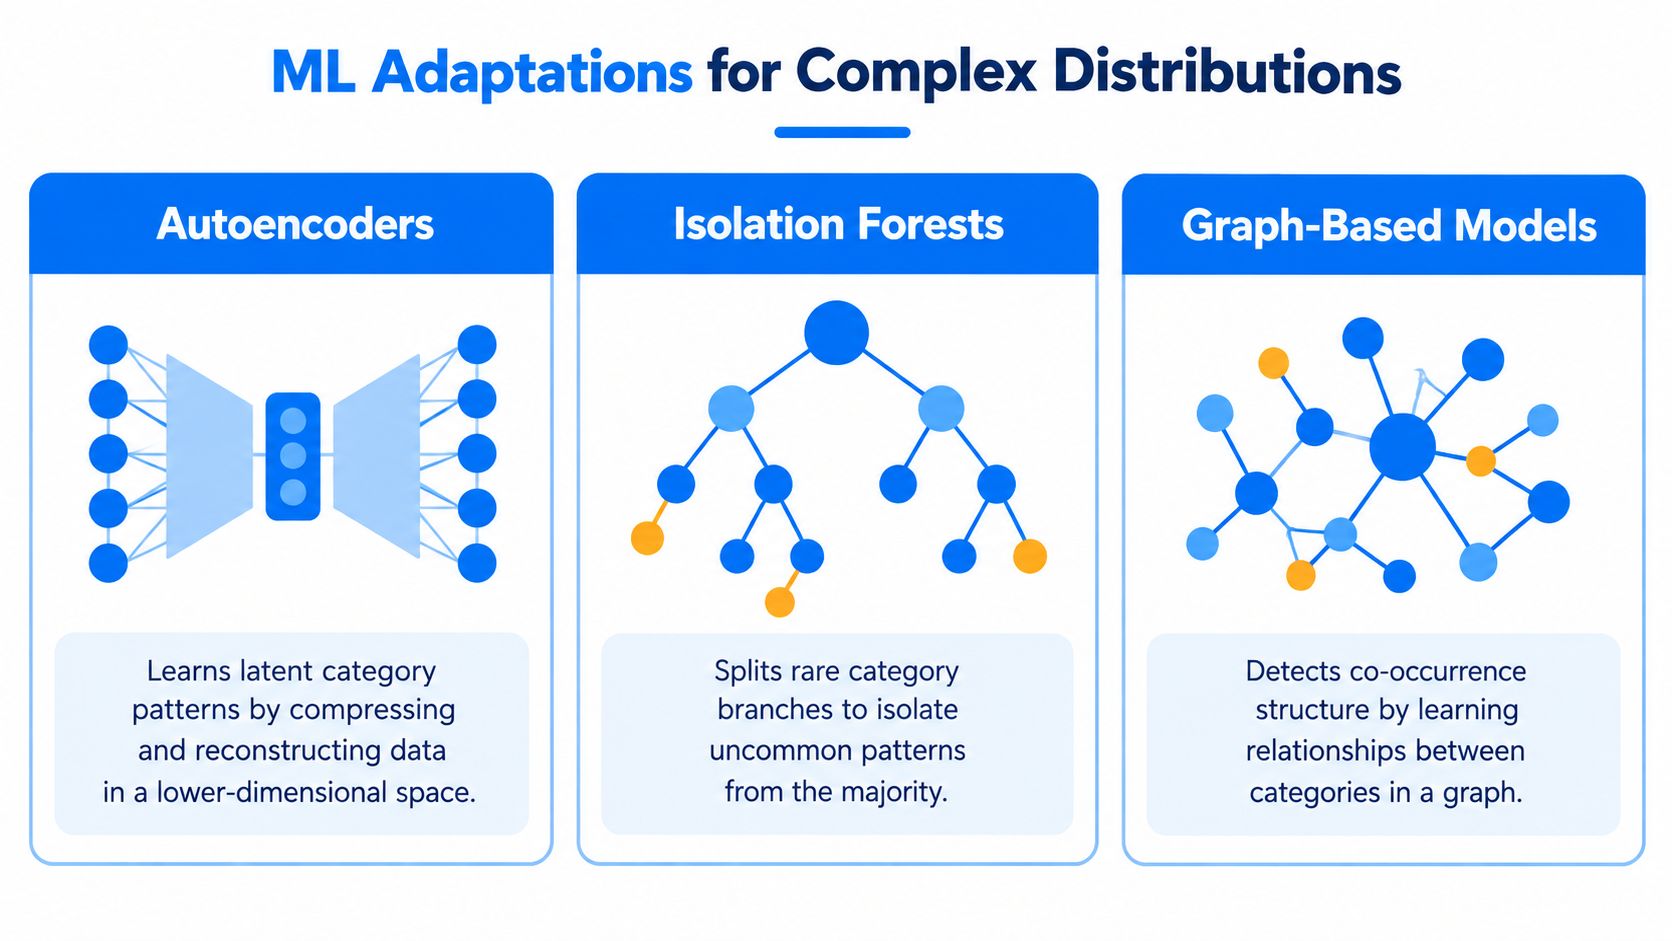
Categorical embeddings map high-cardinality levels into dense representations that other detectors can use. That gives teams a way to feed category structure into autoencoders, isolation forests, or similar models after the raw labels have been transformed into a learned latent space. A healthcare insurance study cited in the recent literature explicitly used categorical embeddings for high-cardinality features, unsupervised detectors, and SHAP in a workflow that had not been used before in that context, which shows how active this design space still is PubMed study on high-cardinality categorical features.
The practical question is not whether embeddings look elegant. It is whether they preserve the category signals that one-hot encoding loses in sparse feature spaces.
Compare the common model families
Autoencoders work well when categories follow stable latent patterns and you want reconstruction error to surface anomalies.
Isolation Forests help once embeddings or feature hashing give them a numeric surface to split on.
Graph-based models matter when co-occurrence structure carries more signal than any single field.
Real categorical datasets are not classroom examples. The ADBenchmarks repository lists 14 widely used categorical datasets, including Census at 299,285 rows and CoverType at 581,012 rows, which is a useful reminder that methods need to scale across both dimensionality and sample size ADBenchmarks categorical dataset repository. The benchmark set also shows that performance can shift sharply across complex datasets.
Pick the model based on the failure mode
If the problem is a few obvious category shifts, start with statistical tests. If the issue is subtle joint-value structure, use a model that learns interactions. If the field is huge and sparse, embeddings can bridge raw categories and usable detection. For a hands-on starting point, see this guide to data anomaly detection in Python.
Managing High-Cardinality Features and Schema Drift
A customer table can look stable for months, then a new region code, product code, or source system starts filling the same column with values your baseline has never seen. That is where high-cardinality monitoring gets messy, because the category space is sparse and the schema around it often changes at the same time.
Treat structure and distribution as separate checks
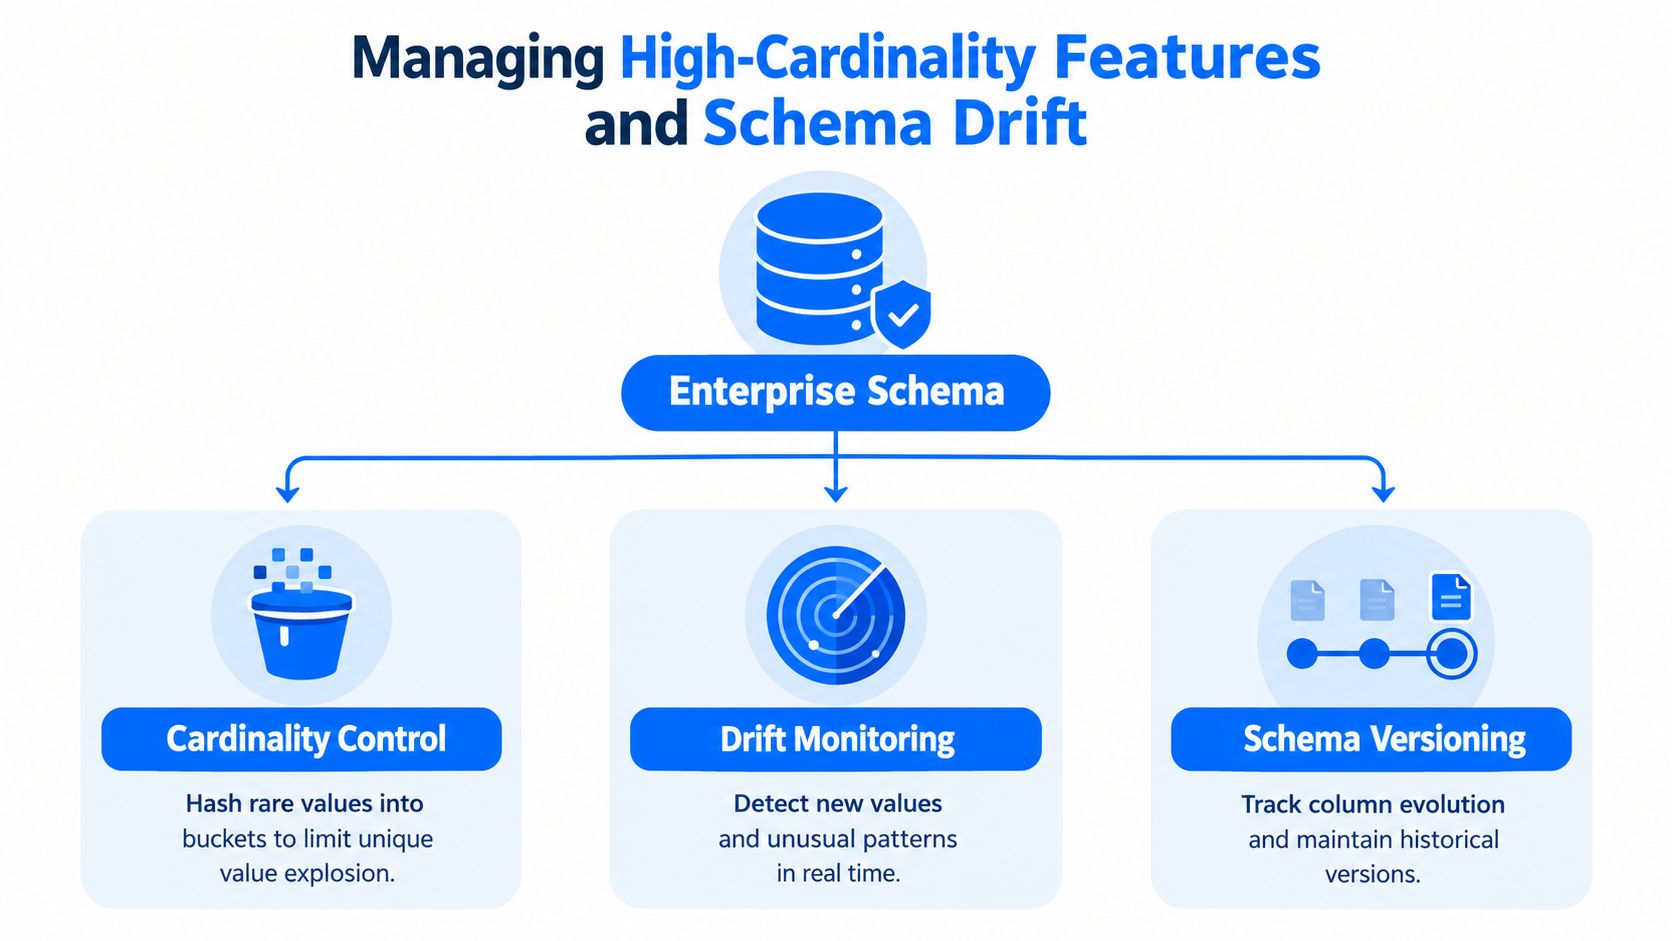
A reference design for schema and attribute drift detection recommends two baselines for every monitored table, a structural fingerprint and a statistical profile schema and attribute drift detection design. The structural fingerprint catches added or removed columns and type changes. The statistical profile captures per-column null ratio, distinct-value count, numeric bounds where relevant, and a top-k category histogram for coded fields. For a deeper walkthrough of what breaks when structure changes, see schema drift explained.
That split matters in production. A new value might be a valid business change, while a renamed column or changed type can invalidate the baseline before any distribution check is useful.
Reduce noise without hiding rare values
Rare categories carry signal, but they also create alert noise. Hashing, bucketing, and controlled grouping can stabilize the monitoring surface, as long as you do not collapse distinct business meanings too early. If a rare product code appears, the pipeline should record it first, then decide whether it belongs in an existing group.
Monitor the schema change first, then decide whether the category shift is a true anomaly or a new normal.
Traceability is the core issue in regulated systems. Teams need to show what changed, why it was flagged, and which baseline produced the decision. Link schema drift and categorical drift in the same workflow, so analysts do not end up with separate tickets for one underlying break.
Keep the operational model simple
A practical setup usually has three steps. Detect new or removed categories. Compare the current distribution with the learned baseline. Version the schema so the change history stays explainable later. That is enough to catch most category-related failures without flooding the team with false positives.
Implementation Trade-offs and Enterprise Tooling
A custom Python pipeline for categorical anomaly detection is absolutely doable. The harder part is keeping it reliable when the number of tables grows, the schemas evolve, and the alerting logic needs to satisfy governance, security, and audit needs at the same time.
Custom code gives control, but it also gives you maintenance work
A hand-rolled stack can use pandas, scikit-learn, or SQL-based profiling for the statistical layer, and that's fine for a small footprint. The problem is what happens after the first few tables. You have to manage baselines, thresholds, scheduling, history, ownership, incident routing, and explainability yourself, and every one of those pieces can become a separate failure point.
TensorFlow Data Validation is a practical open-source option when you want batch-to-batch drift checks and categorical distance measures, because it detects drift between consecutive spans of data and measures drift for categorical features with L-infinity distance TensorFlow Data Validation guide. That works well when your pipeline is already standardized and your team can afford to own the surrounding orchestration.
Platform choices matter when security and governance are non-negotiable
In-database execution matters because it keeps data in place and reduces unnecessary movement across systems. That's especially important in finance, healthcare, telecom, and public-sector environments where data sovereignty and access controls shape the architecture. The IBM Db2 research on semantic AI also points in the same direction, since it frames moving analysis closer to the database as a way to reduce privacy, compliance, and inconsistency risks while keeping structured and unstructured insight together IBM Research on SQL Data Insights Pro.
That's where platforms like digna fit into the operational picture as one option among others. It runs in the customer's own environment, executes checks in-database, and combines statistical methods with machine learning for anomaly detection on categorical fields, which makes it relevant when teams need continuous monitoring without building every component from scratch.
Choose based on operating burden, not just detector quality
The best detector is useless if the pipeline around it collapses. If your team needs a clean way to monitor hundreds of tables, keep schema history, and avoid moving sensitive data around, the tooling decision is as much about execution model as it is about algorithm choice. Transparent, usage-stable pricing also matters when you're trying to predict how a monitoring program will scale with table count and usage.
Building a Production-Ready Monitoring Workflow
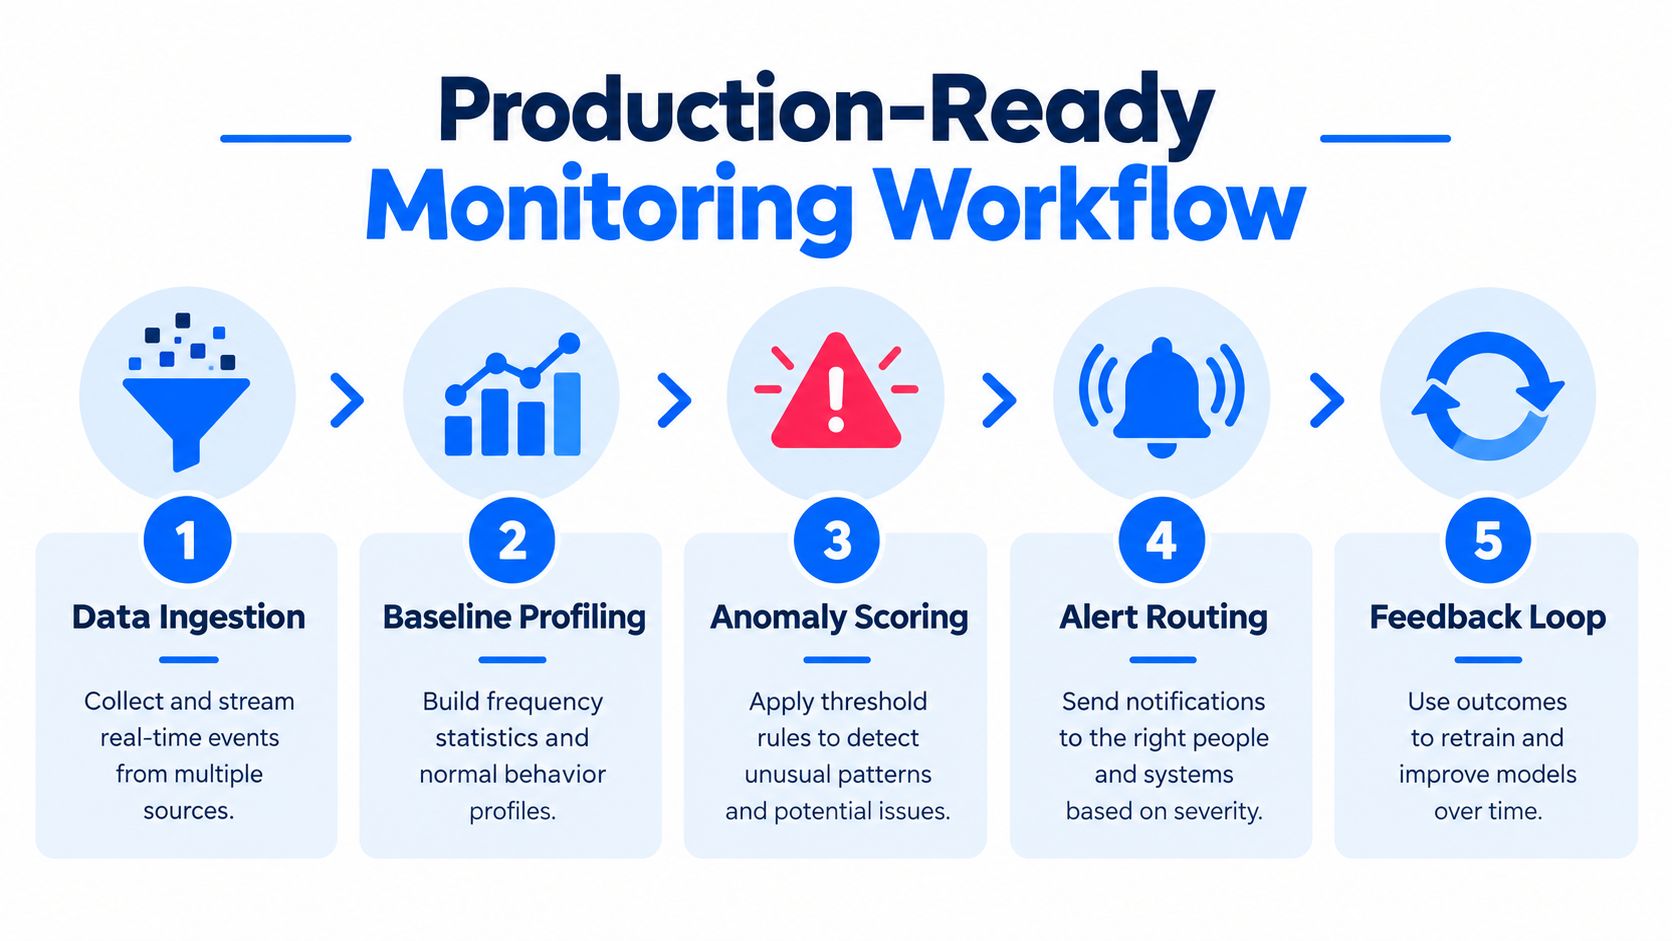
A production workflow for categorical anomaly detection should be boring in the best way. The pipeline ingests data, profiles category distributions, scores anomalies, routes alerts to the right owner, and feeds the outcome back into the baseline so the system keeps learning. If any of those pieces is missing, the detector becomes a one-off script instead of an operational control.
Build the flow around ownership
Start by defining which tables and categorical fields are business-critical. Then assign owners who can interpret a flag in context, because the right response to a new category isn't always the same as the right response to a broken schema. Without ownership, alerts become noise.
A useful alert tells someone exactly what changed, where it changed, and what baseline it violated.
Next, keep the baseline local to the table and the field, not global across the warehouse. Categorical behavior is often domain-specific, so a field in one system can't be judged against the same expectations as a similarly named field elsewhere. That's especially true when codes, product hierarchies, and status values differ by source system.
Make the feedback loop part of the detector
Every review should update the system in some way, even if the result is “this was expected.” That can mean adjusting thresholds, adding a new allowed category, or changing the grouping logic for rare levels. If the baseline never learns, the same false positive will come back tomorrow.
The final step is simple but easy to skip. Put the categorical checks into the same operational path as the rest of your data observability stack so they're not isolated from upstream lineage, downstream dashboards, or model inputs. That's how anomaly detection for categorical data turns into a durable control instead of a periodic cleanup task.
If you need categorical anomaly detection that fits inside real enterprise pipelines, digna is built to monitor data behavior, detect schema change, and run checks in your own environment without moving the data out. Visit digna to see how that approach maps to your warehouse, lake, or pipeline stack, especially if you're dealing with sparse categories, drift, and production alerts that need to reach the right team fast.
If you would rather not hand-build the baseline, scoring and alerting loop described above, digna Data Anomalies runs that monitoring in-database, inside your own environment.
Frequently asked questions
What is a categorical anomaly?
A categorical anomaly is a level, or a combination of levels across fields, that appears with unusually low frequency against the baseline population. Unlike a numeric outlier, it is about how often a category occurs and co-occurs, so a country, payment type and device class can be rare together while each looks normal.
Why does Euclidean distance not work for categorical data?
Labels such as country codes or claim statuses have no meaningful geometry, so distance from a mean says nothing about them. One-hot encoding high-cardinality fields explodes dimensionality and makes contingency tables sparse, while Z-scores cannot tell whether a new code is unusual or merely new.
How do I detect drift in a categorical column?
Compare observed category frequencies with a historical baseline using a chi-squared test, or quantify the shift with the Population Stability Index. A PSI below 0.1 indicates minimal drift, 0.1 to 0.25 calls for investigation, and anything above 0.25 is significant drift that needs immediate action.
How should I handle high-cardinality categorical features in anomaly detection?
Categorical embeddings map many levels into dense representations that autoencoders or isolation forests can use. For monitoring, keep two baselines per table: a structural fingerprint for added, removed or retyped columns, and a statistical profile with null ratio, distinct-value count and a top-k category histogram.
What should a production categorical anomaly monitoring workflow include?
It needs to ingest data, profile category distributions, score anomalies, route alerts to named owners and feed review outcomes back into the baseline. Keep baselines local to each table and field, and let every review adjust thresholds or allowed categories so the same false positive does not return.


