Data Anomaly Detection Python: Complete 2026 Guide
|
8
min read

You usually notice the problem after someone pings you about a dashboard that “looks off.” Revenue has been drifting for weeks, a pipeline arrived late three mornings in a row, or a schema change broke a downstream model while everyone was busy trusting the chart. Data anomaly detection in Python works best when it stops being a notebook demo and becomes part of the operating routine, with thresholds, baselines, and escalation paths that real teams can live with.
Table of Contents
Why Anomaly Detection Matters Beyond the Notebook
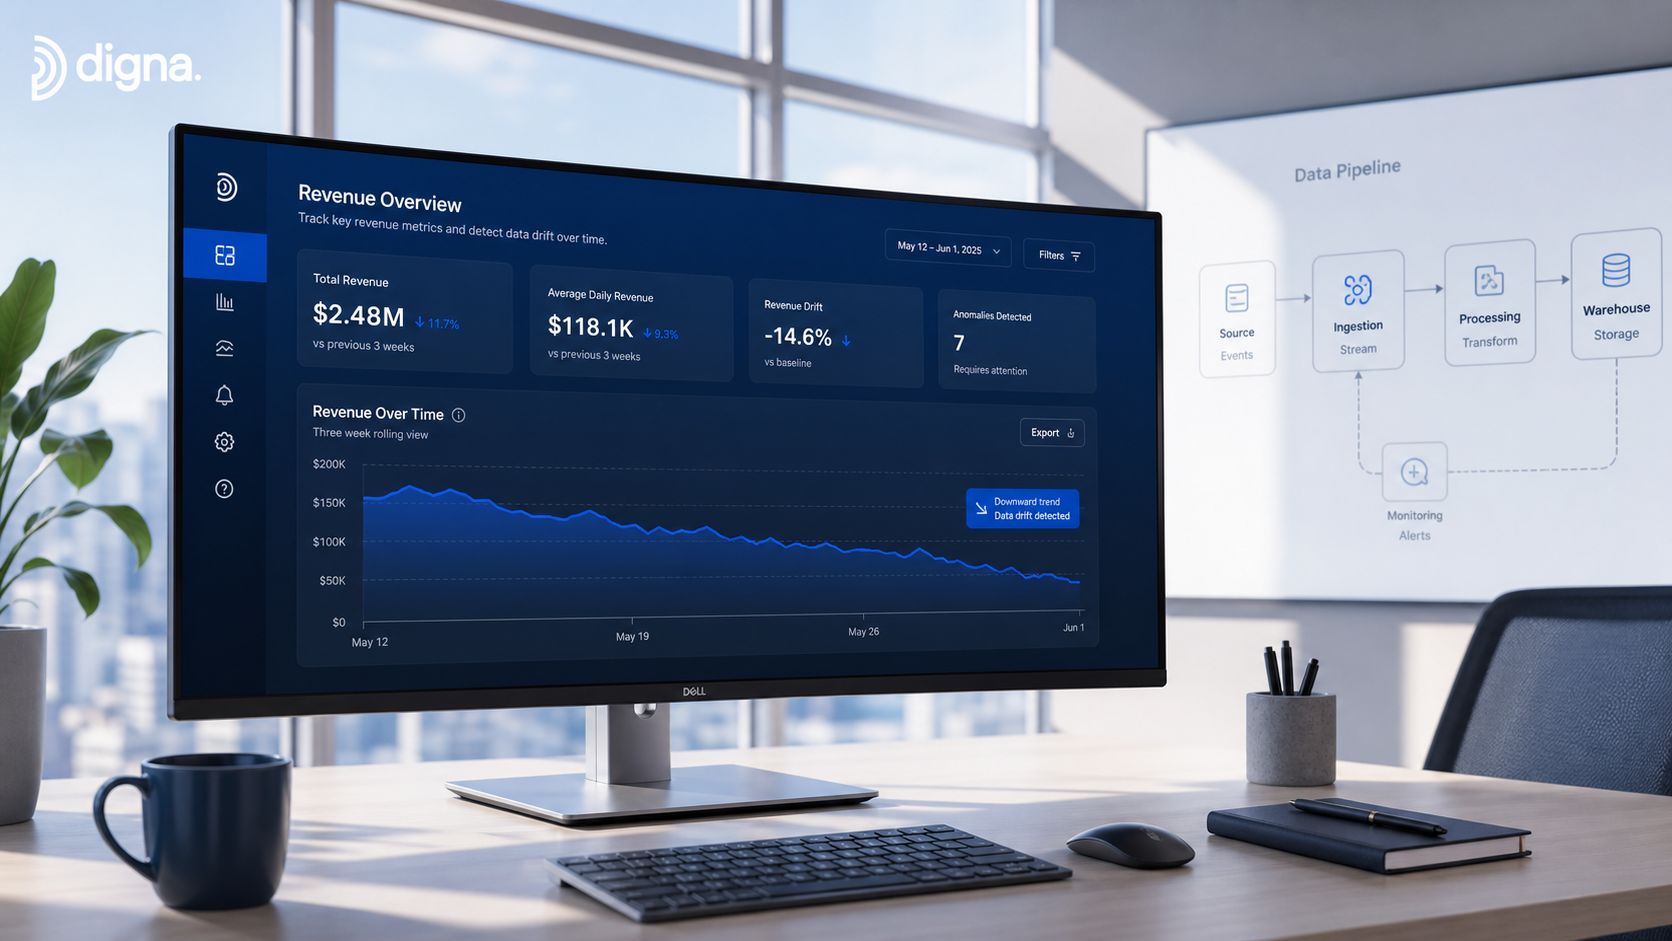
A notebook can flag an outlier. A production system has to survive bad loads, missing partitions, delayed files, and people who need to trust the alert enough to act on it. That difference matters because the same spike on a local chart might be a harmless seasonal bump, while the same spike inside a warehouse feed could point to a broken job or a business event that needs immediate review.
The strongest Python workflows I've shipped start with domain-driven EDA, then choose a detector matched to the shape of the data. For tabular fields, that often means univariate thresholds like z-score or IQR for near-normal signals, or multivariate methods like Mahalanobis distance, EllipticEnvelope, One-Class SVM, or Isolation Forest when the fields move together [Analytics Vidhya]. For time series, a one-size-fits-all threshold usually fails when the series is non-stationary or heteroscedastic, so local baselines, rolling windows, and dispersion-aware scoring do the heavy lifting [Towards Data Science].
Practical rule: if the alert can't be explained to an analyst, operations lead, or BI owner in plain language, it's too early to ship it.
The architectural shift comes when you stop treating detection as a notebook artifact and start treating it as an operational service. That can mean running inside the customer environment, inside the VPC, or even in-database, so the data stays where governance expects it to stay. For teams working on traffic and business monitoring, Data Hunters Agency analytics insights is a useful reference point for thinking about how signal quality, trend reading, and business context change what you should monitor.
False positives aren't a defect in that design. They're part of the system, because a detector that never challenges the business is usually a detector that's too quiet to be useful.
Preparing Tabular and Time-Series Data for Detection
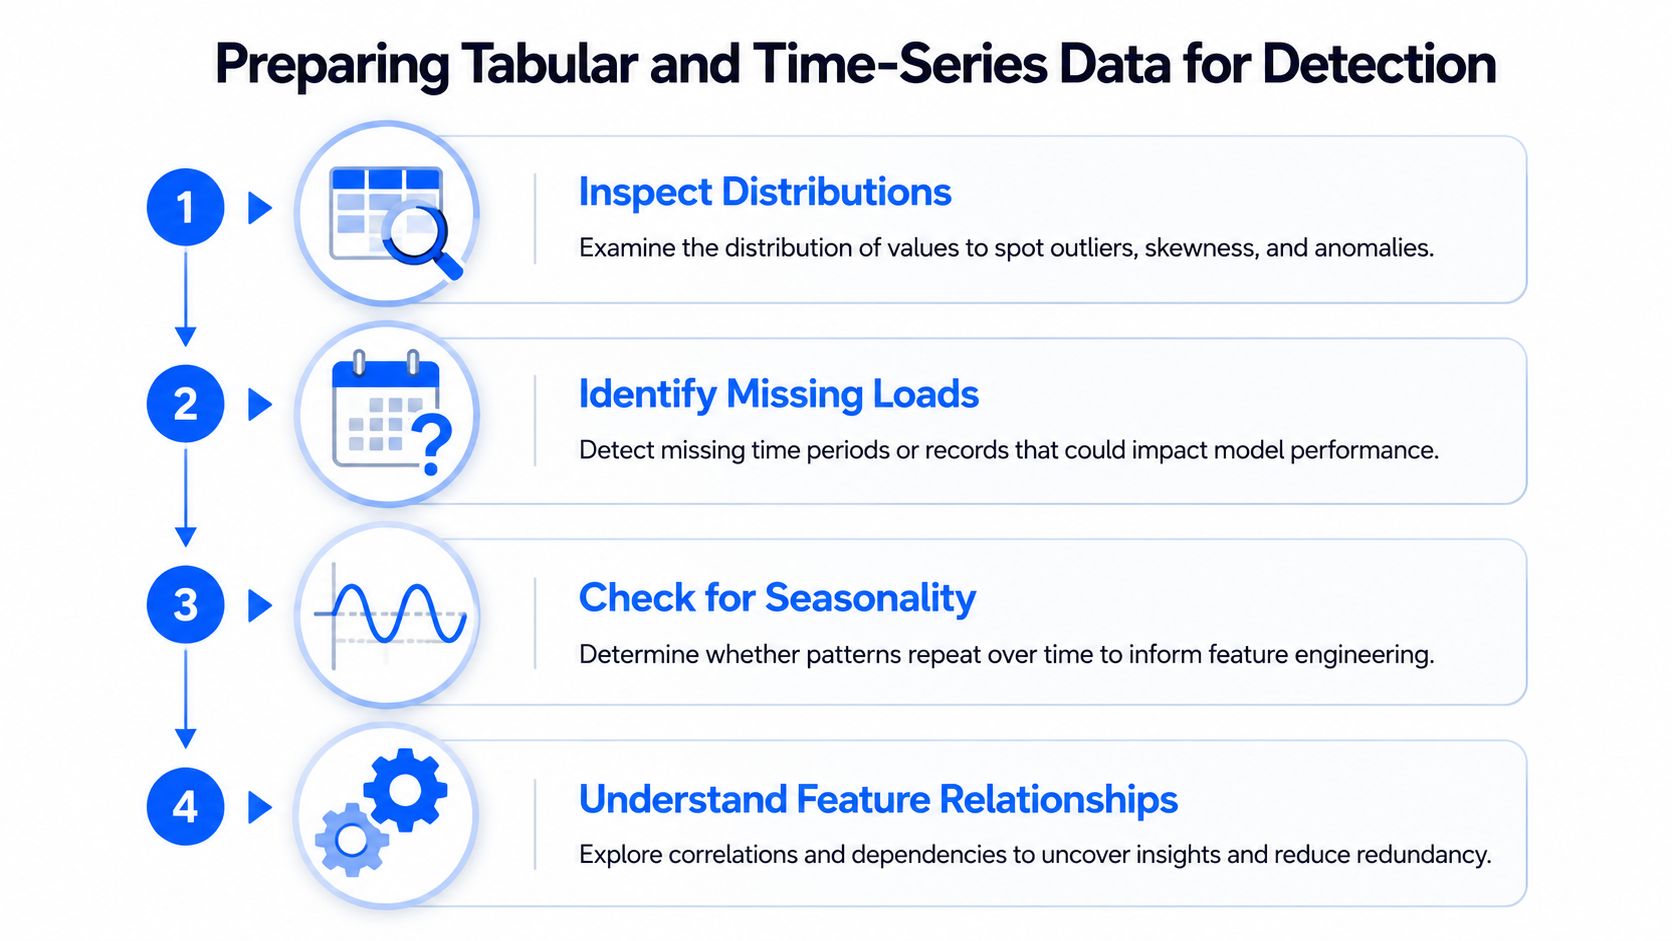
Before any model runs, the data has to be honest. I start by checking distributions, missing loads, and feature relationships, because a detector that sees dirty inputs will confidently label the wrong thing. For business KPIs, that usually means separating stable metrics from seasonal metrics and deciding whether the signal behaves more like a snapshot or a sequence.
Start with the shape of the data
For tabular fields, near-normal single metrics often work well with z-score or IQR thresholds. Once fields are correlated, the better move is multivariate detection, where Mahalanobis distance, EllipticEnvelope, One-Class SVM, or Isolation Forest can respect the structure across columns [Analytics Vidhya]. EllipticEnvelope is especially practical when you want reliable center and covariance estimates through FastMCD before scoring by Mahalanobis distance, while a contamination setting helps align the model with the expected anomaly fraction.
Build local context for time series
For time series, a global threshold is often too blunt. Rolling windows, detrending, and local dispersion statistics give you a baseline that follows the series instead of fighting it, and MAD-based scoring is often a safer choice when noise would make a 3-sigma rule throw too many alerts [Towards Data Science]. That matters because anomalies can show up as single points, trend changes, volatility shifts, or dataset-level events, not just spikes.
Data condition | Better approach | Why it works |
|---|---|---|
Near-normal single metric | z-score or IQR | Simple, fast, easy to explain |
Correlated tabular fields | EllipticEnvelope, Mahalanobis, Isolation Forest | Uses relationships across columns |
Non-stationary time series | Rolling windows, detrending, MAD | Adapts to local behavior |
Noisy production signals | Local baselines | Reduces false positives |
Don't force a static cutoff onto a changing series. If the data has seasonality or drift, the threshold should move with it.
The internal guide at https://www.digna.ai/anomaly-detection-time-series is a practical companion if you're working through baseline-aware time-series detection in a production setting.
Choosing the Right Detector for the Job
The detector choice should follow the data shape, not the other way around. In real pipelines, the best result usually comes from the simplest method that can explain itself and survive bad inputs.
Isolation Forest and purpose-built Python tooling
A solid unsupervised workhorse is Isolation Forest. The mechanism is straightforward, it builds random binary trees, isolates points recursively, and treats deeper isolation as more normal, while shallower isolation signals anomalies after sign adjustment. The referenced Python talk describes a setup with 100 trees, which is a concrete reminder that the model is an ensemble, not a magic score generator [YouTube].
For multivariate outlier workflows, PyOD is a purpose-built library, and a practical install path is pip install pyod [GeeksforGeeks]. The common PyOD workflow is familiar, generate or load data, fit a model, then inspect labels_ and decision_scores_. That's useful because it gives you a repeatable interface across multiple detectors instead of hand-rolling every scoring path.
Detector Families Compared
Family | Best For | Library | Key Output |
|---|---|---|---|
Classical statistical methods | Stable signals, simple KPIs | pandas, NumPy, SciPy-style workflows | Thresholded flag or score |
Isolation Forest | Correlated tabular data, mixed behavior | scikit-learn, PyOD | Anomaly score, label |
Density methods | Clustered data with sparse outliers | DBSCAN, LOF | Outlier score, cluster membership |
Autoencoders | High-dimensional business data | TensorFlow, PyTorch | Reconstruction error |
Autoencoders are useful when the feature space is wide and the reconstruction error carries more signal than a hand-built threshold. I reach for them when tabular structure is real, but the relationships are too tangled for a simple statistical rule to stay reliable.
Time-series-specific libraries
For sequence data, statsmodels, Prophet, and ADTK are the familiar names, while dtaianomaly is notable because it explicitly aims to bridge academic research and real-world applications [arXiv]. That's a meaningful shift, because most Python content still stops at isolated toy outliers, while production teams need monitoring for revenue, customer activity, timeliness, and pipeline health.
If you're deciding between detectors, the question is usually whether you need speed, explainability, or resilience under drift. You usually can't have all three at once, so choose the one that breaks least badly in your environment.
Thresholding, Evaluation, and Handling Drift
A raw anomaly score isn't a system. It becomes useful only after you decide how much noise you'll tolerate, how you'll measure quality, and what happens when the business changes around the model.
Pick thresholds with the data, not against it
In unsupervised workflows, the contamination setting is often the first thresholding lever. That choice should reflect the anomaly fraction you expect, not the fraction you hope exists, because a detector tuned too aggressively will flood the team with false positives. On production data, I prefer to start with a conservative threshold, then inspect flagged samples with the people who own the metric.
The evaluation step needs a labeled holdout whenever you can get one. Precision and recall matter because alert volume and missed incidents are both expensive, and one without the other gives a misleading picture of quality. If labels are scarce, I still keep a review set and use analyst feedback as a calibration loop rather than pretending the score is self-validating.
Drift and schema changes need their own controls
Concept drift changes the background behavior, and schema drift changes the meaning of the data itself. A column added or removed, or a type change in a business field, can break an otherwise healthy detector, so schema tracking belongs in the same operational path as the anomaly score. For time-series pipelines, rolling retraining and local scoring keep the model closer to current behavior.
The article on data drift detection at https://www.digna.ai/data-drift-detection is a good companion if you're building a drift-aware control loop around alerting and retraining.
Operational truth: false positives are part of the concept, they just do exist. The job is to route them intelligently, not pretend they'll disappear.
A tiered alerting pattern works better than one hard stop. Low-confidence alerts can go to a dashboard, medium-confidence alerts can page an analyst, and high-confidence events can trigger an operational incident. That structure gives you an audit trail and keeps people from tuning the detector into silence just to save themselves from noise.
Operationalizing Detection Inside the Customer Environment
Most Python anomaly content still treats the model as the finish line. In practice, the finish line is where the model can run where the data lives, comply with governance, and keep producing useful signals when the environment gets messy.
Why deployment constraints change the design
If the data can't leave the warehouse, the architecture has to work in place. That makes in-database execution more than a convenience, because it reduces data movement and keeps sensitive records inside the customer's environment. It also shifts the emphasis from notebook exploration to repeatable observability, where the same checks monitor data quality, schema changes, timeliness, and business KPIs together.
That's the gap most tutorials miss. They show a local script, but not how to make the output auditable, reviewable, and tied to the people who own the metric. In production, the anomaly signal needs context, because the same score might mean a broken load, a delayed feed, or a real change in business behavior.
Build a single observability stack
A better mental model is a stack with three layers: data ingestion and storage, model serving and APIs, and observability and alerting. The Python workflow feeds all three, but it shouldn't live as a detached script on someone's laptop. It should sit inside a modular platform that can expose alerts, preserve history, and let engineers and analysts review incidents together.
For teams thinking about proactive monitoring in managed environments, AITS proactive monitoring is a useful reference for how monitoring language maps to real operational practice.
The point is simple. A detector running locally is a prototype. A detector integrated into the customer's own infrastructure is part of the operating model.

Integrating with digna Using the digna-sdk
digna's Python integration uses the digna-sdk, and that matters because it's a concrete SDK path rather than a generic HTTP wrapper. The sample implementation pulls a data source by ID through a filter object, which fits the way production checks are usually scheduled, logged, and reviewed.
The internal SDK pattern at digna's Python SDK guide is useful because it shows the namespace and the object shape clearly. The important detail is that the call uses digna_sdk, and the query is built around a data source identifier and a filter object, not a free-form query string.
How to run it in production
Wrap that call in a scheduler, then log the response before you decide whether to notify anyone. If the alert is low confidence, keep it visible in the shared dashboard and let the owner confirm the context. If it's a recurring pattern, treat it as evidence that the baseline needs to adapt rather than just cranking the threshold higher.
Practical rule: if your escalation path can't distinguish between an interesting anomaly and a broken feed, the pipeline will create noise faster than it creates value.
The best production setup is boring in the right way. The Python job fetches the alert, the platform records it, and the team gets a clear view of what changed, where it changed, and whether it's a data issue or a business event.
Matching Method to Reality and Scaling Forward
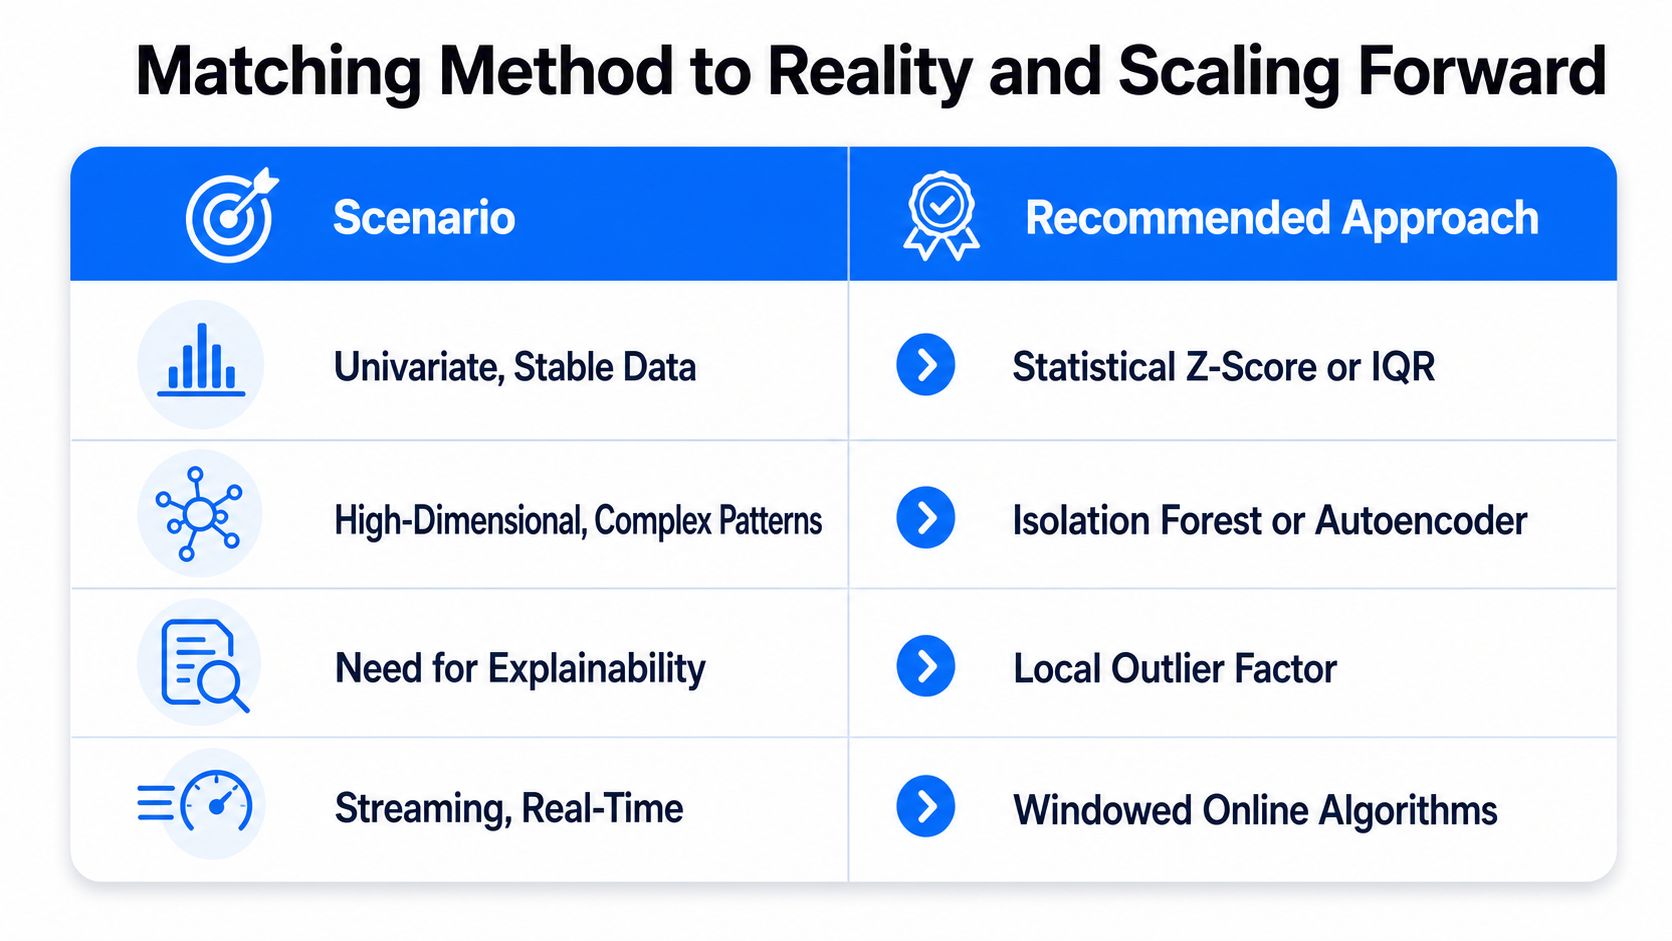
Stable KPIs usually deserve simple statistics first, because a clean z-score or IQR rule is easy to inspect and cheap to run. Correlated tabular fields fit better with Isolation Forest or PyOD, while high-dimensional business data often needs an autoencoder because reconstruction error captures structure that a threshold can't see. For streaming or arrival-pattern problems, the time-series toolset wins because the baseline has to move with the data.
The strongest production teams don't argue for one detector everywhere. They match the method to the scenario, then build the surrounding controls so false positives are expected, reviewed, and routed through the right people. That's the difference between a demo that catches attention and a monitoring layer that protects dashboards, models, and business decisions.
Scenario to method fit
Scenario | Recommended approach |
|---|---|
Univariate, stable data | Statistical z-score or IQR |
High-dimensional, complex patterns | Isolation Forest or autoencoder |
Need for explainability | Local Outlier Factor |
Streaming, real-time | Windowed online algorithms |
The cleanest path forward is to combine baseline learning, schema tracking, and in-database execution inside the customer environment. That turns anomaly detection from a notebook exercise into a control system that can keep pace with business change, even when the data is messy and the alert queue isn't.
If you're building that kind of workflow and want a platform that monitors anomalies, timeliness, schema changes, and business metrics inside your own environment, visit digna and see how its modules fit into a production data stack.


