Data Drift Detection a Practical Guide for 2026
|
7
min read

Your dashboard still refreshes on schedule. The model still serves predictions. The pipeline job still shows green. Yet the numbers no longer reflect reality.
That's the uncomfortable part about drift. It usually doesn't announce itself with a dramatic system failure. A revenue forecast starts missing in one segment. A fraud model lets through patterns it used to catch. A marketing dashboard suddenly makes one channel look stronger than another because the underlying input mix changed unnoticed upstream. Teams keep acting on the outputs because the machinery appears healthy.
In practice, trust starts to erode under these circumstances. Engineers see no incident. Analysts see odd patterns. Business stakeholders see reports that feel wrong but can't prove why. By the time someone traces the issue back to changed distributions, stale baselines, or a silent schema-side effect, the team has already spent days debating the symptom instead of fixing the cause. That's why data drift detection belongs in the same operational category as pipeline monitoring and data quality checks.
The teams adopting more AI tooling are especially exposed because they're increasing the number of systems that depend on stable inputs. If you're trying to sort through that broader tooling environment, Iwo Szapar on AI tools for founders is a useful outside view of how fast these stacks are evolving. The part many teams miss is simpler: none of those tools stay reliable when the underlying data moves without anyone noticing.
For ML systems and analytics alike, the hard truth is the same. Your outputs are only as dependable as the inputs and monitoring discipline behind them. That's why the operational side of quality matters as much as model design, and why data quality directly affects AI model reliability long after deployment.
Table of Contents
The Silent Threat to Your Data and AI
A common failure pattern looks boring at first. A dashboard that executives use every Monday keeps loading, but a dimension upstream has changed meaning. A churn model still returns scores, but recent customer behavior no longer resembles the training baseline. Nobody gets paged because the system is functioning in the narrow technical sense.
What breaks first isn't always the model. It's usually confidence.
When outputs stay available but become unreliable
Analytics teams often detect drift indirectly. They hear that a KPI “looks off.” They compare this week's results to prior periods and find a mismatch they can't explain. Engineers then check orchestration logs, warehouse freshness, and row counts. Everything seems normal. The problem sits one layer deeper in the distribution of the data itself.
Data drift is dangerous because it preserves the appearance of health while degrading the meaning of the output.
That's why drift shouldn't be treated as a niche MLOps concern. BI teams deal with it when customer segments shift, product catalogs change, event payloads evolve, or collection logic is updated without a corresponding adjustment to downstream assumptions. ML teams deal with the same pattern with more immediate consequences, because a model can keep scoring confidently on data it no longer understands.
Why business teams feel the pain before engineering does
Business users usually notice the problem first because they live with the decisions. They see campaign targeting miss the mark. They spot reports that don't align with reality on the ground. They question the data team, even when no pipeline technically failed.
That disconnect creates costly noise:
Analysts lose time: They start validating every downstream report by hand.
Engineers chase symptoms: They inspect freshness and availability while distribution change goes unchecked.
Stakeholders stop trusting models: Once trust slips, every forecast or recommendation gets second-guessed.
The fix isn't more dashboard QA alone. Teams need continuous checks that compare current production behavior to a stable baseline and escalate meaningful changes before users feel the impact. Once you frame drift as an operational reliability issue, the implementation becomes much clearer. You stop asking whether the model is “up” and start asking whether the inputs still resemble the world the system was designed for.
What Is Data Drift A Conceptual Toolkit
Data drift is easiest to understand if you stop thinking about it as a single bug. It behaves more like a river changing course. The water is still flowing, but the path, shape, and force aren't what your bridge was designed for.
Some shifts are gradual. Others arrive after a product launch, policy change, new customer cohort, or upstream transformation. The important point is that the system may continue running while its assumptions slowly stop matching production reality.

Why drift feels invisible until it hurts
Common approaches to data quality focus on availability, schema validity, and record completeness. Those checks matter, but they don't tell you whether the population itself has shifted. A feature can stay present, typed correctly, and fully populated while its distribution changes enough to make a report misleading or a model brittle.
That's why drift belongs in your conceptual toolkit alongside data quality. It answers a different question: not “is the field there?” but “does this field still behave like the baseline we trust?”
The three drift patterns teams should separate
Engineers get into trouble when they call everything drift without classifying it. Different failure modes demand different responses.
Concept drift happens when the relationship between inputs and outcomes changes. In fraud detection, this can happen when attackers change tactics and the old behavioral cues stop indicating fraud the way they used to. The features may still look familiar, but the old learned relationship no longer holds.
Feature drift happens when input distributions change. A demand forecasting model might suddenly receive a different mix of regions, product categories, or customer behaviors than it saw during training. The model logic may still be sound, but the inputs have shifted.
Label drift happens when the target distribution changes. A classification workflow may still receive the same kinds of records, but the proportion of outcome classes changes enough to affect thresholds, calibration, or downstream interpretation.
Practical rule: Classify the drift before you discuss remediation. Retraining may help with one type and barely touch another.
A simple diagnostic helps. If the inputs changed, start with feature drift. If the outputs or class mix changed, inspect label drift. If neither explains the degradation and the world itself changed, suspect concept drift. That framing prevents a lot of wasted effort because it forces the team to connect symptoms to the correct layer of the system.
Key Methods for Data Drift Detection
There are two broad camps in data drift detection. The first relies on statistical tests that compare training and production distributions directly. The second uses model-based methods to detect changes that are harder to capture with simple univariate checks.
For structured tabular data, statistical methods are usually the first place to start. They're easier to explain, cheaper to run, and easier to operationalize in warehouse-centric environments. For high-dimensional, sparse, or unstructured data, teams often need model-based approaches because the drift doesn't show up cleanly in one feature at a time.
Statistical checks for structured data
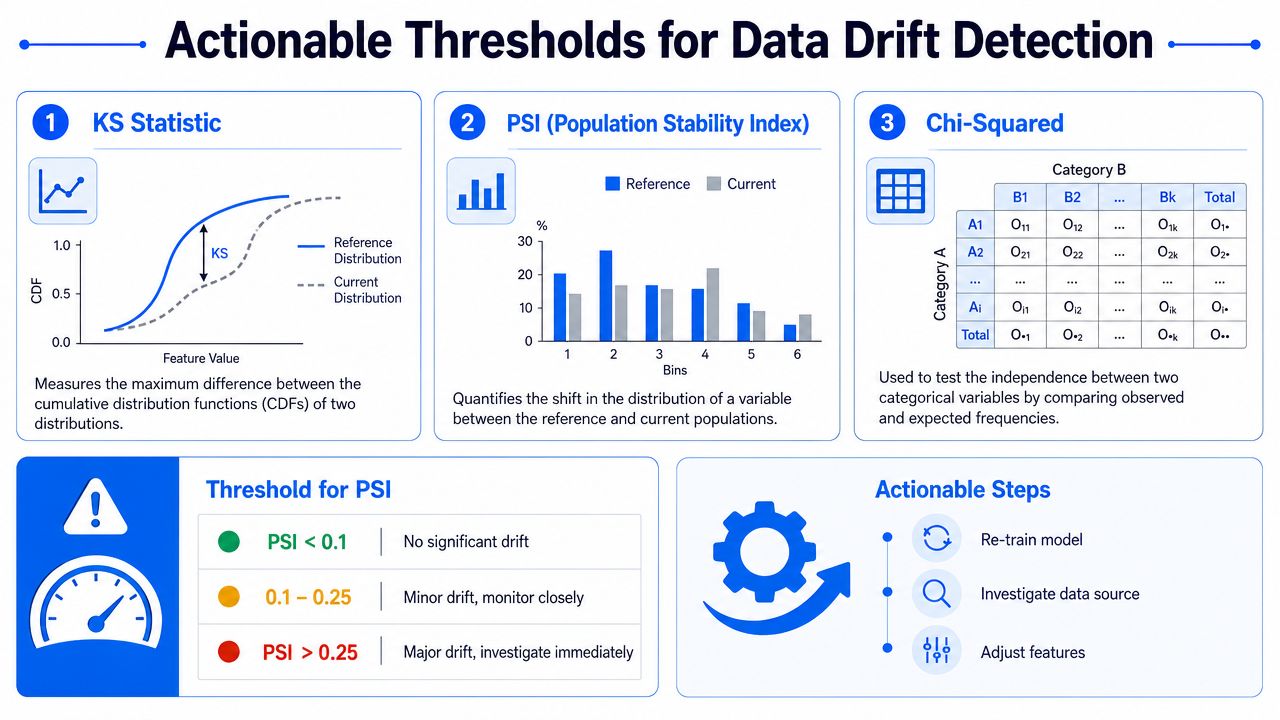
The Kolmogorov-Smirnov test is a standard choice for numerical features. It compares the cumulative distribution functions of training and production samples and returns a p-value. When that p-value falls below 0.05, the null hypothesis that both samples come from the same distribution is rejected, which confirms drift is present, as described in DASCA's overview of data drift and the K-S test.
The Population Stability Index, usually called PSI, is especially popular in operational settings because teams can interpret it quickly. It works well when you need a simple severity signal for changes between an expected baseline and current production behavior.
A good pattern is to combine both. Use a formal test like K-S for statistical significance on numerical features, then use PSI to prioritize which changes are operationally important enough to investigate.
Model-based approaches for harder signals
Pure statistics start to struggle when the data is high-dimensional or when interactions matter more than individual columns. Text embeddings, image features, event streams, and wide behavioral tables often fall into this category.
In those situations, teams usually move toward model-based drift detection:
Representation monitoring: Track shifts in latent features or embeddings instead of raw columns.
Domain classifiers: Train a model to distinguish baseline data from current production data. If that classifier separates them easily, the distributions have diverged meaningfully.
Prediction-space monitoring: Watch confidence, score distributions, or cohort-level prediction patterns when direct labels are delayed.
If you want a practical complement to that line of thinking, Flaex.ai's adaptive AI insights are useful for understanding how adaptive monitoring changes the maintenance model once systems are in production. For adjacent implementation patterns, this overview of AI anomaly detection techniques is also relevant because many production teams combine anomaly detection with drift-specific checks rather than choosing only one.
Comparison of Data Drift Detection Methods
Method | Type | Best For | Pros | Cons |
|---|---|---|---|---|
K-S test | Statistical | Numerical features | Clear hypothesis test, distribution-agnostic for numerical data, easy to automate | Less useful for complex feature interactions |
PSI | Statistical | Stable operational monitoring for tabular data | Interpretable severity score, common in production workflows | Depends on sensible binning and baseline selection |
Chi-squared style categorical checks | Statistical | Categorical feature distributions | Straightforward for category-level shifts | Can produce noisy alerts with sparse categories |
Domain classifier | ML-based | High-dimensional structured or semi-structured data | Captures multivariate shifts better than isolated checks | Harder to explain to non-technical stakeholders |
Embedding drift monitoring | ML-based | Text, images, behavioral sequences | Useful for unstructured data | Requires representation pipelines and careful baselining |
Prediction-space monitoring | ML-based | Systems with delayed labels | Helps catch meaningful changes in output behavior | Can hide root cause if input features aren't monitored too |
The trade-off is simple. Statistical methods are better for transparency and operational discipline. Model-based methods are better when reality is messier than a single-column histogram.
Setting Metrics and Actionable Thresholds
Detection without thresholds creates noise. Thresholds without an action plan create theater. The useful part of data drift detection starts when the team agrees on what level of change is worth attention, escalation, and intervention.
The most practical example is PSI because teams can turn it into a clear operating rule. According to Machine Learning Mastery's guidance on handling data drift in production, a PSI value exceeding 0.25 indicates the distribution has shifted substantially from its historical baseline and suggests the model is likely seeing input data it was not trained on.
Thresholds should trigger action not panic
Not every shift deserves retraining. Teams need a tiered interpretation model. One practical PSI framework from TrueFoundry's guide to drift tracking is:
PSI below 0.1: no significant population change
PSI from 0.1 to 0.2: moderate change that warrants investigation
PSI at or above 0.2: significant drift that typically calls for retraining or feature engineering updates
Those thresholds are useful, but they aren't universal. A model used for low-risk internal prioritization can tolerate more movement than a system tied to regulated decisions or customer-facing automation. Teams should tune thresholds according to business impact, retraining cost, and how quickly labels arrive for validation.
If a threshold doesn't change what someone does next, it isn't an operational threshold. It's a chart decoration.
How to make thresholds operational
The cleanest way to make thresholds useful is to pair them with explicit runbooks.
Signal | Interpretation | Team action |
|---|---|---|
Stable range | Expected movement | Continue monitoring |
Investigation range | Early indication of shift | Check upstream changes, cohorts, seasonality, and data contracts |
Action range | Material drift | Trigger retraining review, feature review, or temporary guardrails |
Good teams also scope thresholds by feature family. High-volatility behavioral features should not share the same sensitivity settings as reference dimensions or core business identifiers. That one design choice prevents a lot of alert fatigue.
Designing a Modern Monitoring Architecture
Ad hoc SQL checks won't hold for long. Once you have multiple models, warehouse pipelines, and stakeholder groups, drift monitoring needs real architecture behind it.
A solid design starts close to the data and computes metrics where the data already lives whenever possible. That reduces movement, simplifies privacy posture, and keeps the monitoring stack aligned with production reality instead of sampling exports or sidecar copies.
The minimum viable architecture
Most enterprise-grade setups need five components.
Collection points that pull from warehouse tables, feature stores, event pipelines, or model input logs.
Metric computation that runs distribution checks, baseline comparisons, and anomaly signals.
Historical storage for metrics so teams can inspect trends instead of isolated snapshots.
Baseline management to define what “normal” means for each feature, prediction stream, or cohort.
Alerting and visualization so the right people see the issue in time and with enough context to act.
Scheduled monitoring matters more than many teams assume. Acceldata's guidance on scheduled drift analysis recommends automated comparisons against a stable baseline on a weekly or biweekly cadence, and explicitly notes that waiting for ad hoc checks after failure is insufficient. That's a practical operational standard because it catches accumulating drift before it reaches user-facing impact.
The line between data observability and data quality often gets blurred here, but the distinction matters when you're designing the stack. This explanation of data observability vs data quality is a useful framing reference because drift monitoring sits at the boundary between the two.
Who needs to see what
The architecture fails if every alert lands on one technical team with no business context. Drift detection should route differently based on failure mode.
Data engineers need lineage, freshness, schema, and upstream change clues.
ML engineers need feature-level and prediction-level diagnostics tied to model versions.
Analytics engineers and BI owners need cohort comparisons and report impact visibility.
Business users need a plain-language summary of what changed and whether decisions should pause.
A concise operating model helps:
Stakeholder | What they need first | Typical decision |
|---|---|---|
Data engineer | Source change, pipeline history | Fix upstream issue or contract break |
ML engineer | Drift scope, affected features, model version | Retrain, recalibrate, or hold deployment |
Analyst | Metric impact by segment | Validate dashboard interpretation |
Governance lead | Audit trail and evidence | Document review and response |
A walkthrough makes this architecture easier to visualize in practice:
Field note: The best monitoring systems don't just detect drift. They preserve enough history and context that teams can explain why it happened.
Common Pitfalls and How to Remediate Them
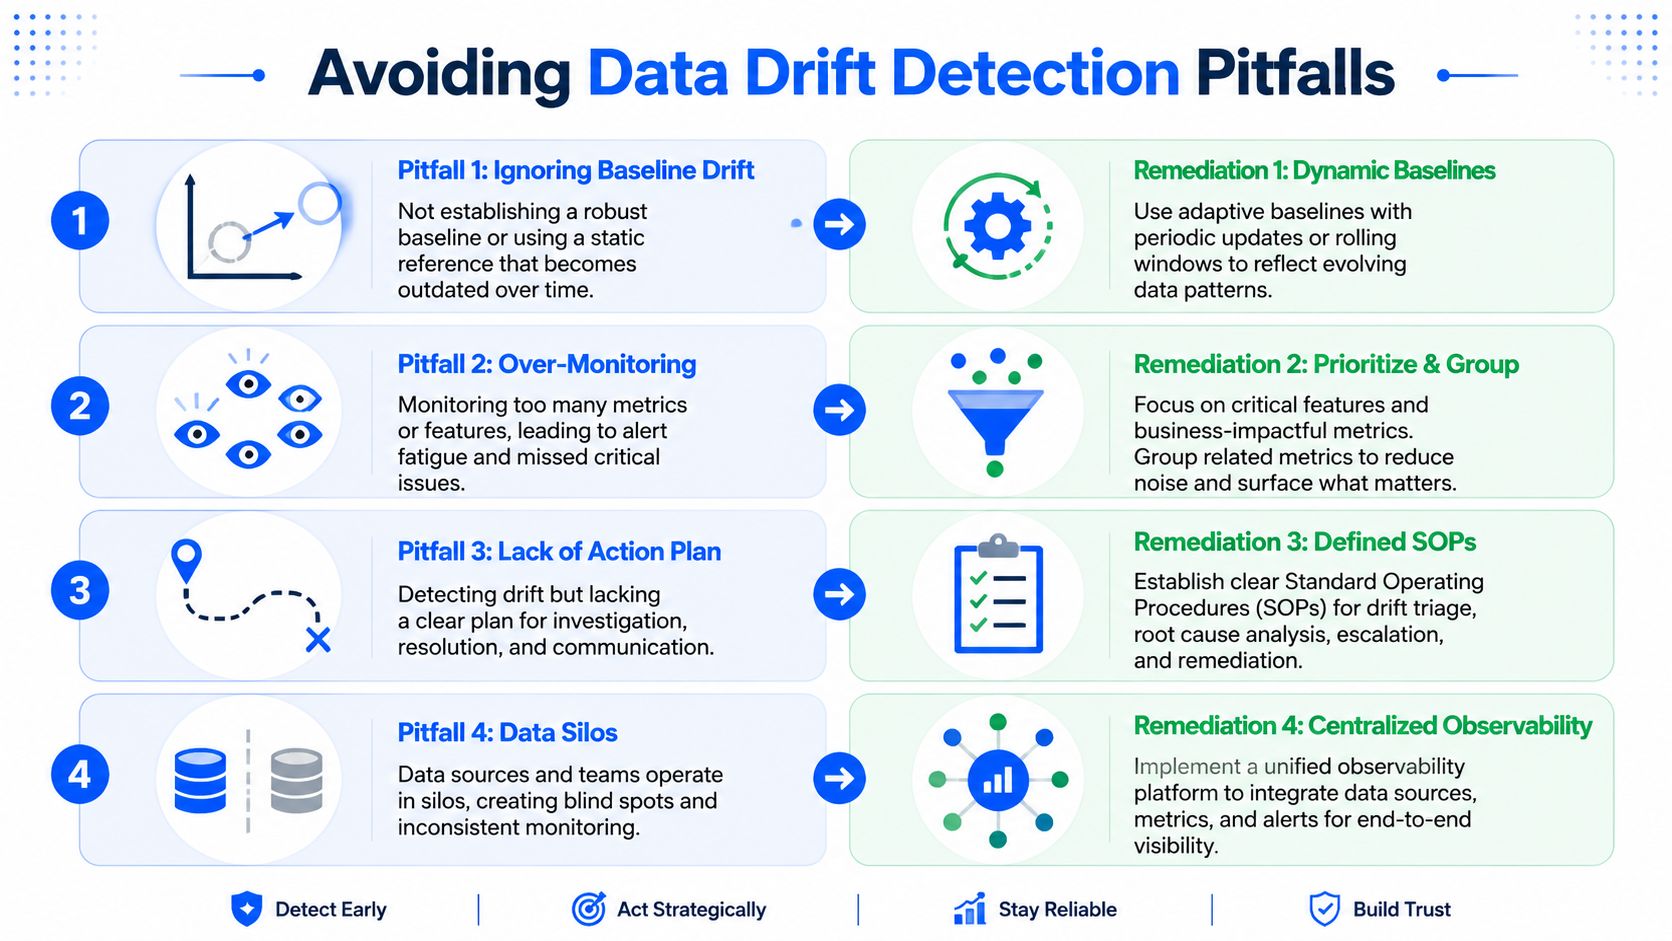
Most failed drift programs don't fail because the math is wrong. They fail because the operating model is weak. Teams either monitor too much, react to the wrong thing, or detect change without deciding who owns the response.
Where implementations usually break
A few patterns show up repeatedly:
Thresholds are too tight: Teams alert on normal seasonal movement and train everyone to ignore the system. Remediation is to widen thresholds for volatile features and review alerts by cohort before escalation.
Too many features are monitored equally: A long tail of low-value columns produces noise. Focus first on business-critical inputs, high-importance model features, and dimensions that drive executive reporting.
No remediation path exists: Detecting drift without a runbook creates backlog, not reliability. Define what happens when drift is confirmed. That may mean retraining, recalibration, feature deprecation, or temporary suppression of a downstream output.
Seasonality gets confused with structural change: Some movement is normal. Use rolling baselines or comparison windows that respect recurring cycles instead of treating every periodic shift as a fresh incident.
One simple rule prevents a lot of pain. Start narrow, prove signal quality, then expand. A drift system that catches fewer issues but drives fast, credible action is much better than a noisy one that floods Slack and gets ignored.
Enterprise-Ready Drift Detection
At enterprise scale, drift detection stops being just a statistics problem. It becomes a privacy, architecture, and governance problem.
Privacy scale and governance change the design
Large organizations can't rely on workflows that copy sensitive production data into external monitoring services for convenience. In regulated environments, the monitoring design needs to respect where the data lives, who can inspect it, and how evidence of continuous review is retained. That's one reason in-database execution is so attractive. It lets teams compute metrics and learn baselines inside the customer-controlled environment rather than moving raw data around.
Scale changes the operating model too. A company might have hundreds of critical tables, many downstream dashboards, multiple feature pipelines, and different ownership domains. Manual review doesn't survive that environment. You need standard baselines, alert routing, historical context, and documented workflows so governance leaders, data engineers, and ML teams can coordinate without inventing a new process every time.
The strongest programs also treat drift as part of business continuity. If a decision system becomes unreliable, the question isn't only whether the model should be retrained. It's whether downstream users should keep acting on the output, whether audit evidence is sufficient, and whether the incident should trigger broader review across adjacent datasets.
That's why mature teams put drift detection under the same strategic umbrella as data quality, observability, and governance. It protects models, reports, and decision processes at the same time.
If you're building that kind of monitoring stack, digna is designed for the operational realities teams face: anomaly detection, timeliness, validation, schema tracking, and observability that runs inside customer-controlled environments without vendor access to production data. For enterprises that need privacy, clear workflows, and monitoring across both analytics and AI inputs, it's a practical place to start.
For teams that want learned baselines instead of hand-tuned PSI thresholds on every feature, digna Data Anomalies learns the normal behavior of monitored tables in-database and flags distribution shifts as they emerge.
Frequently asked questions
What is data drift detection?
Data drift detection is the continuous comparison of current production data against a stable baseline to catch distribution changes before users feel the impact. A feature can stay present, correctly typed and fully populated while its distribution shifts enough to make a report misleading or a model brittle.
What is the difference between concept drift, feature drift and label drift?
Concept drift means the relationship between inputs and outcomes changed, as when fraudsters change tactics. Feature drift means input distributions changed, such as a new mix of regions. Label drift means the target class proportions changed. Classify the drift before discussing remediation, because retraining helps some types more than others.
How does the Kolmogorov-Smirnov test detect data drift?
The K-S test compares the cumulative distribution functions of training and production samples for a numerical feature and returns a p-value. When that p-value falls below 0.05, the hypothesis that both samples come from the same distribution is rejected, confirming drift. Pair it with PSI to prioritize changes.
What PSI value indicates significant data drift?
One practical framework treats PSI below 0.1 as no significant change, 0.1 to 0.2 as moderate change worth investigating, and 0.2 or above as significant drift calling for retraining or feature updates. Machine Learning Mastery notes that PSI above 0.25 means the distribution shifted substantially from its baseline.
How often should data drift checks run?
Drift checks should run on a schedule rather than ad hoc after failures. Acceldata recommends automated comparisons against a stable baseline on a weekly or biweekly cadence, which catches accumulating drift before it reaches users. Use rolling baselines that respect seasonal cycles so periodic shifts do not trigger false incidents.


