Statistical Pattern Recognition: A Practical Guide
|
6
min read

You've got a dashboard that looked fine at 9 a.m., then one silent pipeline issue turns every weekly number suspect by lunch. No alarms fire, the table still loads, and the only thing worse than a broken report is a report people keep using because it looks normal. That's the exact kind of problem statistical pattern recognition is built to catch, because it looks for structure in noisy data instead of waiting for a brittle rule to trip.
At a practical level, this discipline sits inside the broader machine learning field. A review article describes pattern recognition as “nearly synonymous with machine learning” in some contexts, while Bishop defines it as the automatic discovery of regularities in data for actions such as classification review article, Bishop's definition and workflow.
Table of Contents
What Is Statistical Pattern Recognition
A broken dashboard rarely starts with a dramatic failure. More often, one feed arrives late, one schema shifts subtly, or one upstream service changes the shape of a record without telling anyone. The numbers still render, but the meaning is off, and the trust damage starts long before someone notices.
Statistical pattern recognition is the practice of finding meaningful structure in data by treating uncertainty as part of the problem, not a nuisance to ignore. In the 1960s and 1970s, the field emerged as researchers began framing classification as a probabilistic decision problem rather than a purely symbolic one, and Bishop's work later formalized it as the automatic discovery of regularities in data for classification Bishop's foundation text.
Why that matters in data operations
Rule-based checks are useful when the failure mode is obvious. They struggle when the issue is subtle, drifting, or seasonal. Statistical methods learn what “normal” looks like from observed data, then compare new behavior against that baseline instead of relying on a fixed threshold that ages badly.
That's why the field matters to observability teams. The same logic that separates one class of email from another or one medical image from another also helps identify anomalous metric patterns, schema changes, and delayed arrivals before stakeholders see the damage. In other words, the method is not academic decoration, it's the core mechanism behind modern automated monitoring.
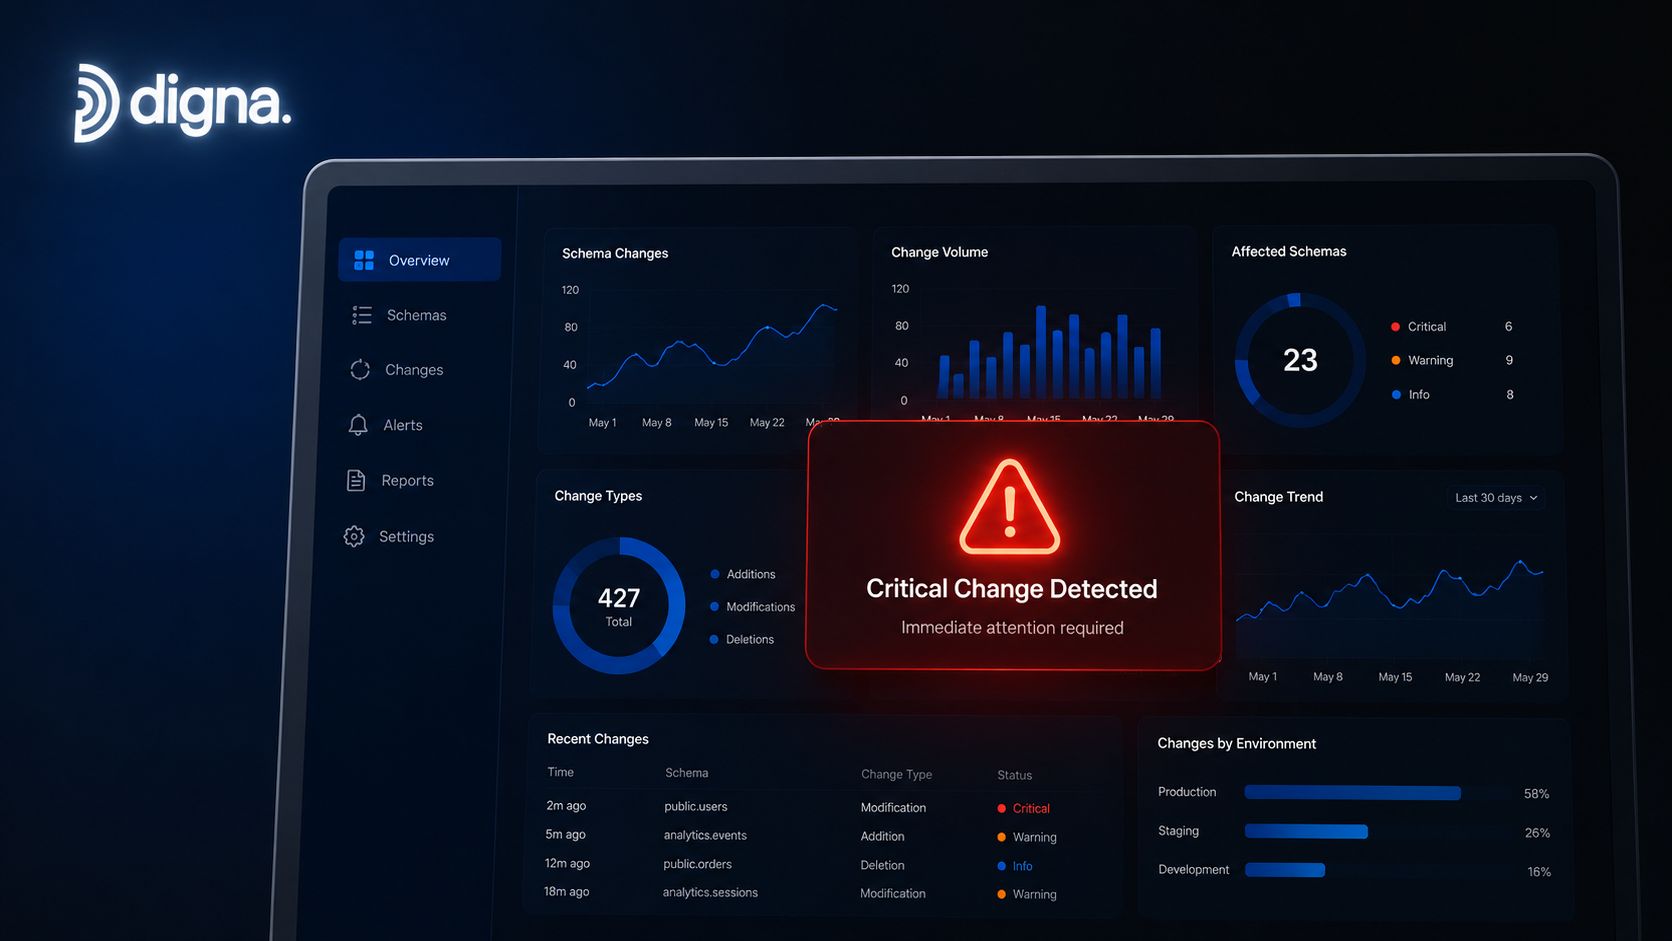
A useful way to think about it is simple. If a hard-coded rule says, “alert when value X exceeds 100,” statistical pattern recognition asks, “what does this metric usually do, what context changes its behavior, and when is today's pattern unusual?” That shift from rigid rule to learned expectation is what makes the discipline durable across different pipelines, data shapes, and business workflows.
Core Concepts Behind Pattern Recognition
The easiest way to understand this field is to stop thinking in single values and start thinking in distributions. A metric is rarely just a number, it has a usual range, a rhythm, and a relationship to other metrics. Statistical reasoning works because it asks whether a new observation fits the story the data has already been telling.
The statistical mindset in plain language
Think of probability distributions as a weather forecast for your data. A forecast doesn't tell you exactly what the temperature will be at 3 p.m., it tells you what's likely. Pattern recognition uses the same idea to assign meaning to observed values, which is why a value can look odd without being wrong, or look acceptable while still being part of a larger failure.
Hypothesis testing is the part where you challenge the obvious explanation. A dashboard dip might look like a product issue, but the data could also reflect a delayed batch, a schema change, or a partial ingestion failure. Good monitoring systems don't stop at the first suspicious signal, they test whether the change is strong enough to deserve attention.
Practical rule: don't confuse a rare value with a useful signal. A number only matters when it breaks the pattern that makes sense for that dataset.
Model fitting is where the system learns the shape of normal behavior. Instead of hand-tuning every alert threshold, the model compares incoming data with the baseline it learned from history. In a real data platform, that means the same metric can behave differently on weekdays, during batch windows, or after a product launch, and the model can still track it.
Why feature reduction keeps teams sane
Dimensionality reduction sounds abstract, but the intuition is straightforward. Large datasets have many overlapping signals, and not all of them help distinguish normal from abnormal behavior. Methods like PCA compress the data so the important variation stands out more clearly, which helps separate signal from noise when engineers are reviewing distributions, trends, or correlated fields.

The weather analogy still holds here. A single cold day doesn't define a season, and a single spike doesn't define a system. The practical job is to separate transient noise from the pattern that deserves an operational response.
Common Statistical Methods for Finding Patterns
A production model rarely starts with a label-free mystery. It usually starts with a supervised workflow: define the problem, collect the right data, extract useful features, classify what matters, and evaluate the result against held-out examples. Bishop's workflow and supervised setup make that sequence explicit, and that discipline matters because it separates a model that learned a pattern from one that merely memorized historical quirks Bishop's workflow and supervised setup. For data observability, that distinction is the difference between catching a real drift and firing alerts on yesterday's noise.
Methods for different kinds of structure
Principal Component Analysis, or PCA, is useful when a dataset is crowded with correlated variables. It reduces dimensionality so the strongest directions of variation are easier to inspect, which makes it easier to compare related freshness, volume, or latency signals without checking every field separately. In a monitoring system, that matters when several metrics move together and only one underlying shift is driving the problem.
Clustering groups observations that behave similarly. It works well when labels are missing and the goal is to find natural segments in the data rather than force a predefined class. For observability, that can mean grouping tables with similar ingestion behavior, or separating recurring noise from unusual operational patterns that deserve attention.
Hidden Markov Models, or HMMs, fit better when sequence matters. They model systems that move through hidden states over time, which makes them a practical choice for processes with modes, transitions, and delayed effects. In a pipeline, that helps distinguish a genuine anomaly from a normal state change that unfolded gradually across several runs.
PCA: compresses correlated measurements into fewer components, which makes pattern review less noisy.
Clustering: finds groups without labels, which helps identify recurring behavior that rules would miss.
HMMs: capture state changes over time, which is useful when the order of events matters more than any single metric.
The trade-off is straightforward. PCA can hide detail while it clarifies the dominant variation, clustering can reveal useful structure without explaining why it exists, and HMMs can model temporal behavior without making the logic obvious to every operator. In a real observability workflow, teams often use these methods together because each one answers a different question about the same data stream.
A simple example shows the difference. If a warehouse table suddenly changes its arrival profile, clustering might show that it no longer belongs to the same behavioral group as before, while an HMM might show that the pipeline has shifted into a new state rather than just having one bad load. Those are different problems, and they need different tools. If you want a practical mapping from these methods to implementation choices, this practical guide to statistical methods for data analysis is a useful reference.
The same logic also matters outside the warehouse. Teams that rely on scraping need stable inputs before they can trust downstream alerts, which is why the benefits of scraping APIs often show up first in cleaner, more predictable data feeds.
From Theory to Practice in Anomaly Detection
The most useful observability systems do not wait for someone to spot a broken dashboard. They compare current behavior with learned expectations and flag the gap early, often before a BI layer or downstream model turns the issue into a business discussion. Statistical pattern recognition becomes operational at that point, not just academic.
What anomaly detection actually watches
A late-arriving dataset is a sequence problem, so change-point detection fits naturally. It looks for moments where the underlying behavior shifts instead of assuming the process stays stable forever. That is a better match for production data than a single threshold, especially when load timing, volume, or cardinality changes for legitimate reasons.
A basic monitoring loop works like this:
Learn the usual arrival and value pattern from historical data.
Compare the newest batch or metric against that baseline.
Flag a deviation when the difference is large enough to matter operationally.
Route the alert to the team that can confirm whether the cause is upstream, downstream, or a schema issue.
A model is only useful if it fits the operational question, not just the dataset.
In-database execution matters here. If the monitoring logic runs where the data already lives, teams avoid moving sensitive tables around just to inspect them. Tools in this category, including digna, run statistical checks inside the customer environment and focus on patterns such as anomalies, timeliness, and schema changes.
The same pattern shows up across a stronger data observability stack. Distribution shifts can warn that a model input is drifting, while timeliness monitoring can catch data that arrived, but not on time. For a practical look at methods used to separate outliers from normal records, the outlier identification methods overview is a useful reference.
Source reliability starts upstream, and the benefits of scraping APIs article makes that trade-off clear. The same logic applies inside analytics systems, unstable inputs make downstream trust expensive fast.
Scaling Pattern Recognition in Production
At small scale, you can get away with exporting data to a notebook, running a few checks, and manually reviewing the result. At production scale, that approach turns monitoring into another data movement problem, which adds latency, governance friction, and another place for sensitive data to leak. A better architecture keeps analysis close to the data and keeps the operational question front and center.
Why in-database analysis wins in practice
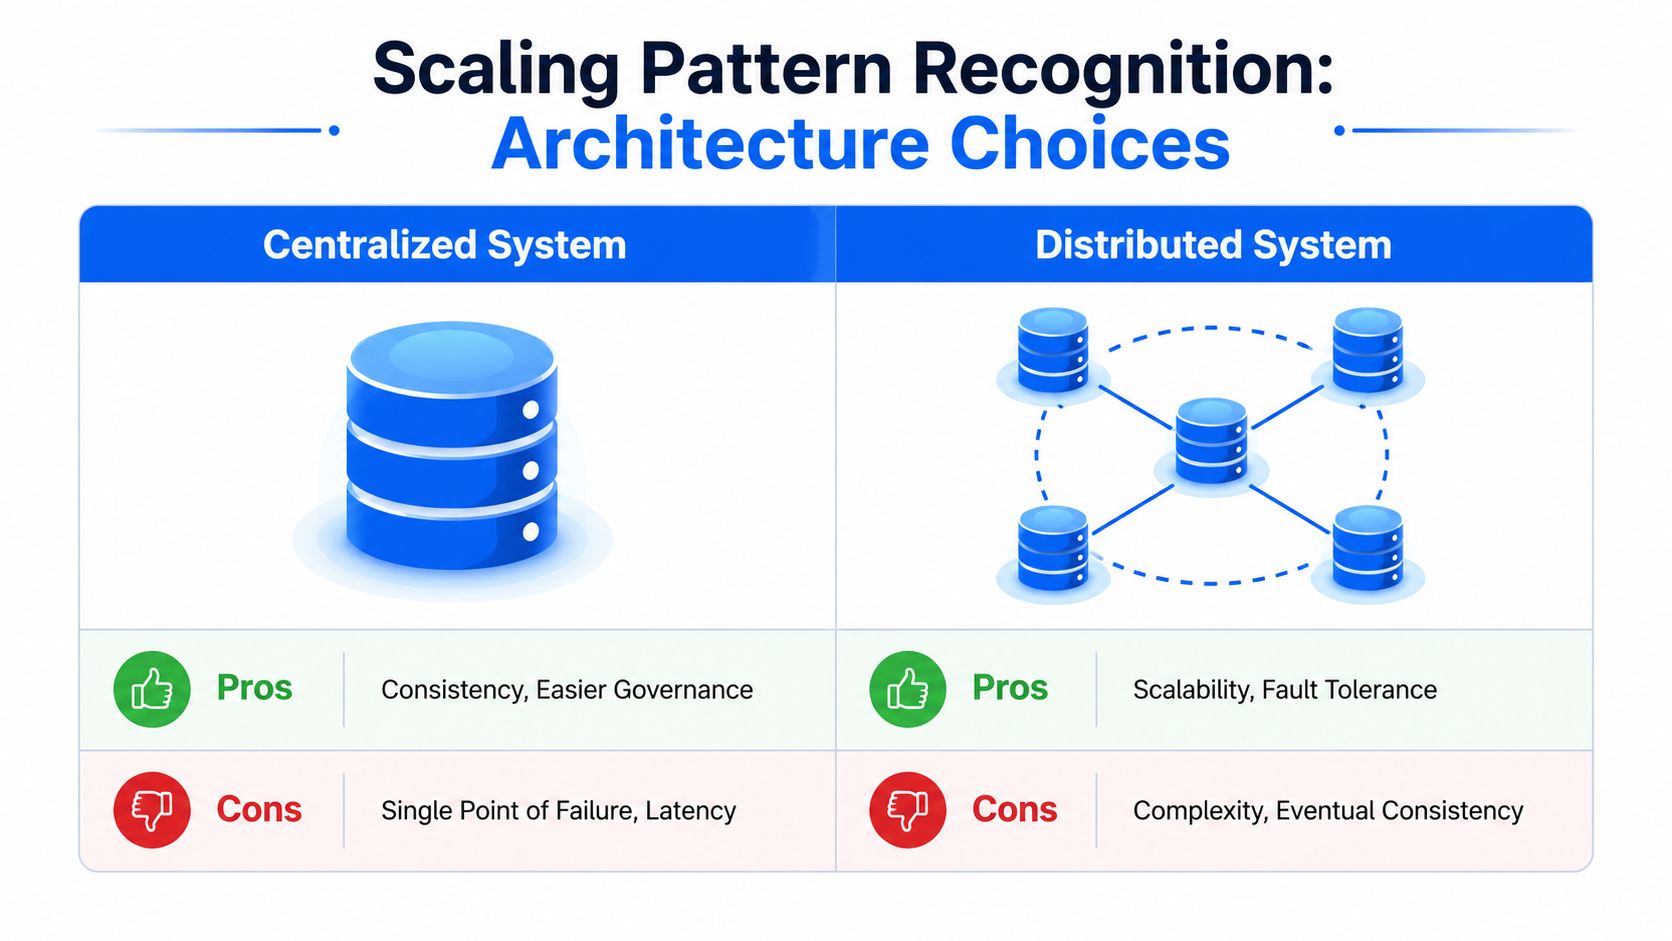
Centralized monitoring often looks tidy on a diagram. In production, it can create a single place where latency builds up and governance gets harder. Distributed execution, especially in-database analysis, keeps the computation beside the source system, which is why it usually fits modern observability better.
That design choice matters for three practical reasons. First, it reduces the amount of data that has to move. Second, it preserves privacy boundaries because the records stay in the customer-controlled environment. Third, it makes it easier to monitor many tables and metrics without turning the observability layer into a bottleneck.
Engineering preference: when the data platform already knows where the truth lives, don't copy everything elsewhere just to ask basic statistical questions.
This is also where teams need discipline. A model that fits yesterday's behavior too tightly can overfit and miss new but legitimate patterns. On the other hand, a model that ignores schedule effects will fire on every normal batch delay and lose credibility quickly. Seasonality, delayed ingestion, and structural shifts need to be part of the monitoring design, not treated as exceptions after the fact.
For teams looking for a broader operational reference, the practical guide to anomaly detection is a helpful complement because it keeps the focus on deployment realities rather than abstract model talk. The same principle applies here, the system has to work where your data runs.
How Statistical Methods Prevent Data Disasters
A stale report is rarely the root problem. The core issue is usually that people made a decision on top of data that was already wrong or incomplete, and nobody had a statistical signal strong enough to stop them. That's where automated pattern recognition becomes a business safeguard, not just a technical feature.
Three failure modes that a good system catches
A finance team can think the month is on track because the dashboard loaded, even though one source table stopped arriving on time. A timeliness model learned on historical schedules would flag that deviation before the report gets shared, which is a much cheaper failure to handle than an executive correction after the meeting.
An ML team can train on data that looks valid but has drifted in a subtle way. That kind of issue doesn't always break a pipeline, but it can poison model inputs and lower reliability in ways that are hard to trace later. Distribution monitoring and anomaly detection are useful here because they surface the change before it gets buried under downstream complexity.
An analyst can miss a real business trend because the signal hides inside a noisy sequence of ordinary-looking values. Statistical methods help separate the recurring background from the change that matters, which is why they're useful for prioritizing investigation. The value is not just alerting, it's directing attention.
A platform like digna can operationalize this by learning baselines, tracking trends, and checking record-level behavior continuously inside the database. That's the modern version of the classical workflow from problem formulation through feature extraction and evaluation, only now it runs in the background instead of in a lab notebook.
The Future of Data Quality Is Statistical
The old model of data quality relied on brittle checks and a lot of manual cleanup. That still has a place for explicit business rules, but it breaks down when the failure is subtle, contextual, or constantly changing. Statistical pattern recognition gives data teams a way to keep up with that reality by learning behavior instead of hard-coding every assumption.
The broader lesson is simple. Reliable observability depends on methods that can adapt to changing pipelines, shifting distributions, and delayed data without requiring a human to rewrite rules every week. That's why this discipline has stayed relevant since its early probabilistic roots in the 1960s and 1970s, and why it now sits at the center of practical anomaly detection in modern data platforms Bishop's historical framing.
For teams responsible for trust, uptime, and decision support, the question isn't whether to use statistical methods. The question is whether those methods live in a notebook, or in the production path where they can prevent damage.
If you're building a data platform that needs to catch anomalies, schema shifts, and timeliness issues before they reach dashboards or models, take a look at digna. It runs statistical monitoring inside your database, which keeps sensitive data in place while surfacing the patterns that matter. If you want observability that's grounded in learned behavior instead of brittle rules, start there.