Why Data Quality Is Important and How Poor Data Hurts ROI
|
7
min read

A dashboard can be perfectly formatted, refresh on schedule, and still lead a leadership team toward the wrong decision. One duplicated customer record can inflate demand, a late transaction load can distort cash reporting, and a changed column type can break a model. The technical defect may look small. The business consequence rarely is.
Gartner has estimated that bad data costs organizations at least USD 12.9 million per year on average, while research cited by MIT Sloan Management Review has placed the revenue drag from poor data quality at 15% to 25% for many companies (data quality improvement evidence). These figures explain why data quality matters as an economic control surface, not merely as a data engineering chore.
Table of Contents
Introduction Why Bad Data Breaks Good Decisions
The cost is larger than the defect
What Good Data Quality Really Means
Accuracy starts the recipe
The remaining dimensions define usability
How Poor Data Quality Hurts Business and Technology
Where the damage appears
Why Data Quality Is Even More Important for AI and Governance
AI amplifies defects across workflows
Readiness means fitness you can demonstrate
Real Examples of Risk When Data Quality Fails
Reactive repair versus early control
How to Control Data Quality With Validation Timeliness and Monitoring
Start with explicit expectations
Monitor delivery and structure
Conclusion Building Trust in Data for Analytics and AI
Introduction Why Bad Data Breaks Good Decisions
A finance leader sees revenue slowing in one region and delays hiring, cuts inventory, and postpones a campaign. Later, an analyst finds that a source system changed its transaction classification. The dashboard displayed plausible figures, so the error escaped attention and shaped real decisions.
Analytics and AI create the same exposure in different forms. A forecasting model can generate a polished recommendation from incomplete history. A customer-risk workflow can use stale attributes. An executive report can reconcile technically while joining records built on different definitions. The result is rework, delayed action, and weaker trust in the data platform.
The cost is larger than the defect
Poor data quality behaves like a fault in a shared supply line. Engineers inspect pipelines, analysts reconcile competing figures, managers wait for confirmation, and business teams postpone action. If the issue reaches several downstream systems, every copy becomes another place to investigate and correct.
Industry evidence summarized in TechTarget's explanation of data quality reported that average monthly data-quality incidents rose from 59 in 2022 to 67 in 2023, while the average share of impacted revenue rose from 26% to 31%. A separate 2022 finance survey found that 86% of business leaders weren't confident their data could support decision-making, according to that source.
The economic control surface is therefore time as well as correctness. A defect detected before publication may require one correction. The same defect detected after dashboards, operational workflows, and models consume it demands investigation across each affected path. Prevention and fast detection can reduce that recovery work, even when perfect data remains unattainable.
Loss of confidence also changes how people work. Teams add manual checks, maintain shadow spreadsheets, and request repeated approvals. The organization may have modern warehouses, dashboards, and machine learning systems, yet decisions slow because nobody can verify the inputs quickly.
A useful starting point is the definition of data quality: data is valuable when it is fit for the decision, process, or model using it. The standard is dependable use, measured by how quickly problems are prevented or found.
What Good Data Quality Really Means
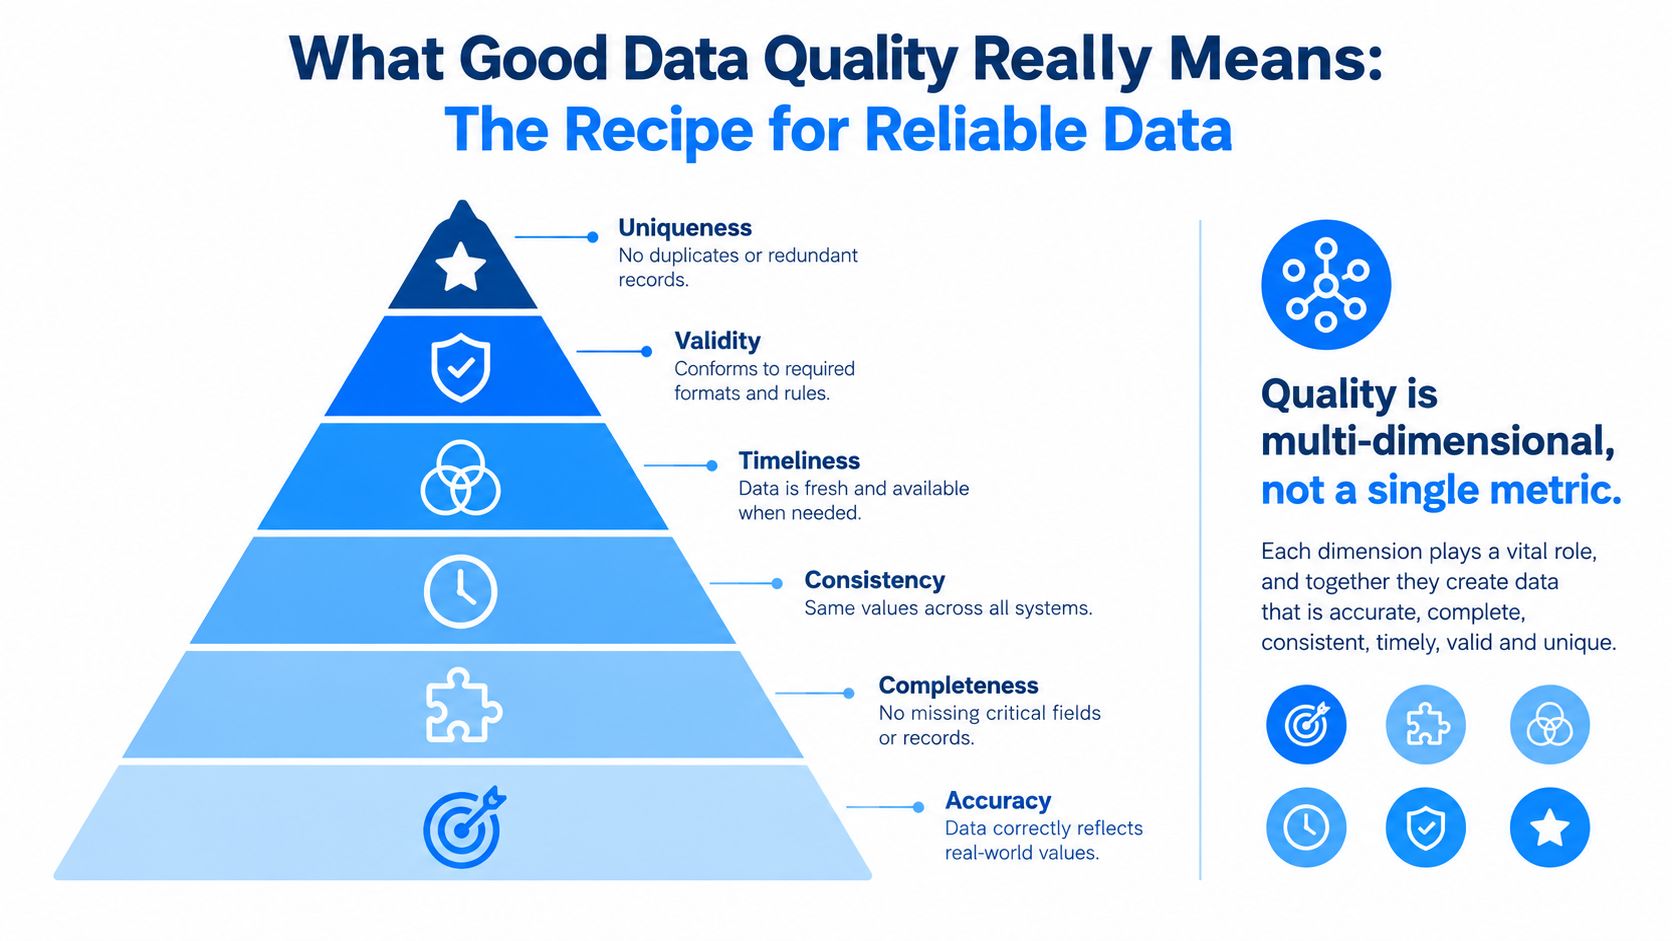
Think of a dataset as the ingredients for a recipe. Fresh ingredients aren't enough if the quantities are wrong, a required item is missing, two packages contain different labels for the same product, or the ingredients arrive after the kitchen closes. A reliable result depends on several conditions working together.
Data quality means fitness for use. A dataset can be present, queryable, and technically valid while still being unsuitable for a specific business question.
Accuracy starts the recipe
Accuracy asks whether a value reflects reality. A customer address, account balance, product price, or medical code may be stored in the right field and still be wrong. Accuracy usually requires comparison with a trusted source, a transaction rule, or a known business condition.
Completeness asks whether critical records and fields exist. A missing customer identifier may prevent joins. A missing timestamp may make timeliness impossible to measure. Not every blank is an error, but every important blank needs a defined interpretation.
Consistency asks whether systems agree. If one application calls a customer “active” and another uses a different status rule, each table may look internally coherent while the enterprise view conflicts.
The remaining dimensions define usability
Timeliness measures whether data arrives fresh enough for its purpose. A daily planning report and a real-time fraud workflow have different expectations.
Validity checks whether values follow required formats and rules. Dates should parse as dates, identifiers should follow accepted patterns, and status values should belong to an approved set.
Uniqueness prevents duplicate or redundant records from changing counts, balances, or customer histories.
These dimensions aren't interchangeable. A dataset can be accurate but late, complete but inconsistent, or timely but invalid. That's why a single quality score often hides the underlying problem.
The practical task is to define quality by use case. A regulatory report may prioritize completeness, validity, and auditability. A recommendation model may need representativeness, currentness, and balance as well as accuracy. The dimensions of data quality give teams a vocabulary for turning vague concerns into testable expectations.
How Poor Data Quality Hurts Business and Technology
A defective record can travel through an organization faster than its owner can notice. It enters a pipeline, changes an aggregate, appears in a dashboard, influences a decision, and may later become training data. Each handoff adds another place where the original defect can be masked, copied, or assigned to someone else to fix.
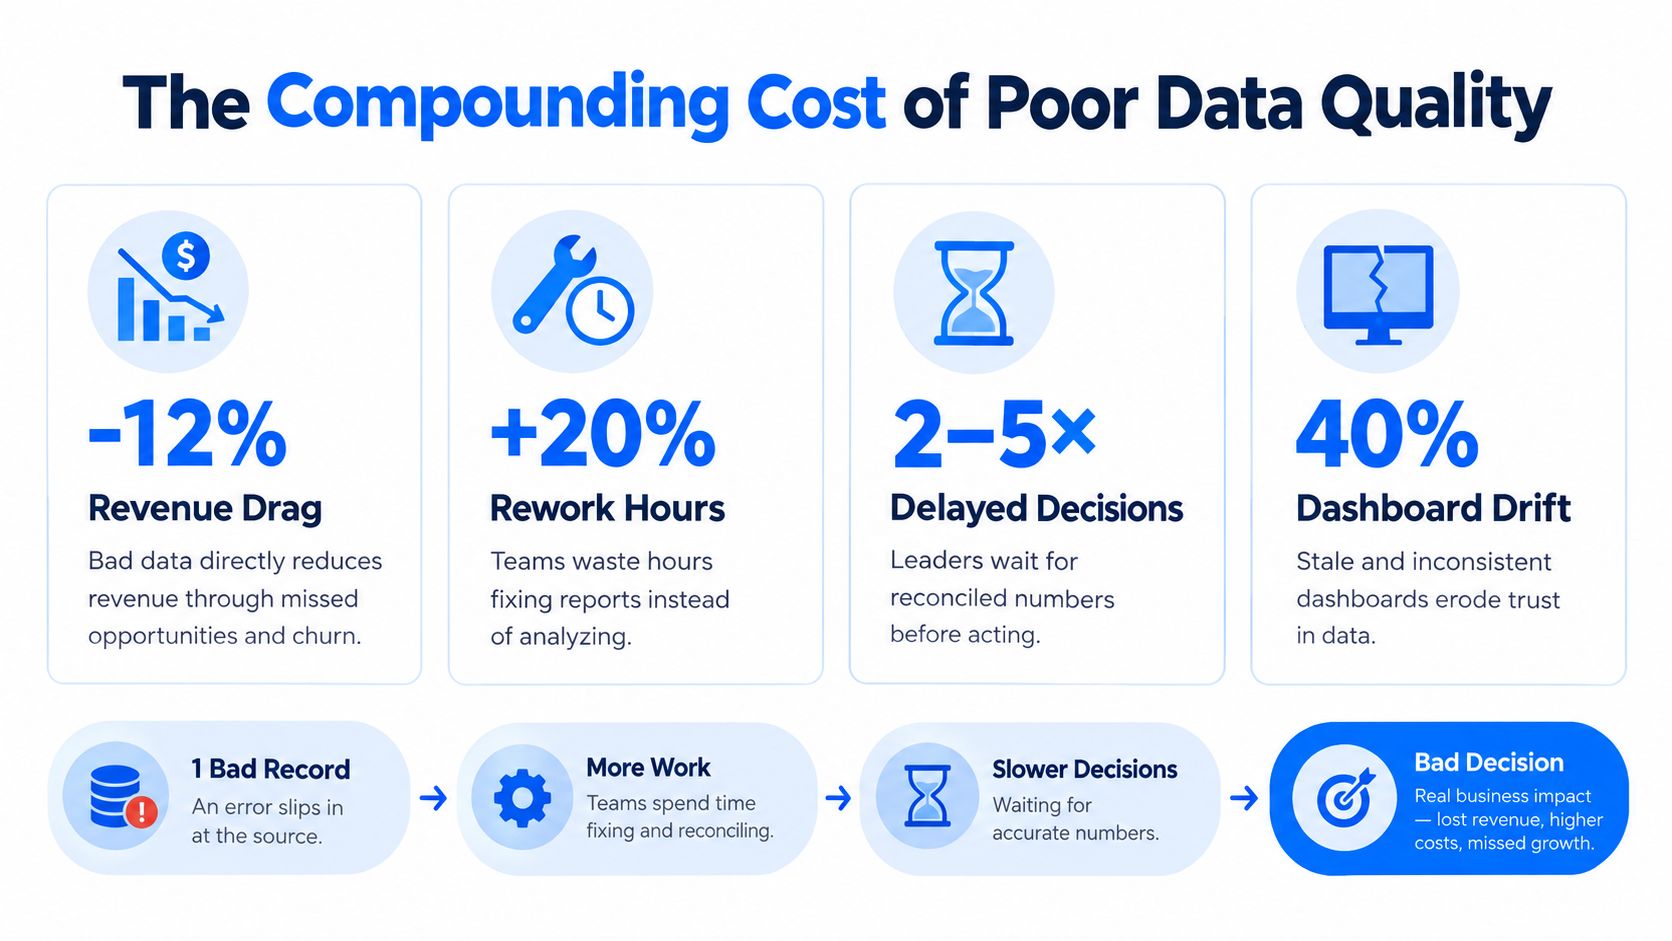
Gartner's widely cited estimate puts the average organizational cost of poor data quality at USD 12.9 million per year (economic impact of poor data quality). The expense appears as manual reconciliation, failed processes, scrap, rework, delayed decisions, and missed revenue. The business benefits of data quality become clearer when quality is treated as a control surface for these costs, not only as a cleanup task.
Research summarized in a peer-reviewed article has reported that poor data quality can consume 8% to 12% of revenue in some proprietary studies, while other estimates place the cost at 15% to 25% of revenue for many companies (peer-reviewed discussion of data quality costs). Methods and organizations differ, but the mechanism remains consistent. Defective information affects margins and execution, not only the appearance of a report.
Where the damage appears
Teams usually see the effects in recognizable forms:
Revenue leakage: Duplicate, missing, or misclassified records can distort customer activity and hide opportunities.
Operational rework: Analysts and engineers reconcile conflicting outputs instead of improving the underlying systems.
Decision latency: Leaders wait for figures to be checked before approving action.
Dashboard drift: Stale or inconsistent sources make reports disagree and weaken trust.
Model distortion: Training and scoring workflows use inputs that no longer represent operating conditions.
Time-to-detection changes the economics. A defect found at ingestion may require one correction. The same defect found after reporting, fulfillment, or model scoring can require investigation across several systems and teams.
The technical term for this interruption is often data downtime. An ETSI framework for measuring data quality describes an actionable model based on incident count multiplied by detection and resolution time. Faster detection and resolution reduce labor and disruption, even when perfect data is not immediately achievable. Prevention rules are valuable for the same reason: they stop recurring defects before each downstream handoff creates more rework.
A survey of 20,000 organizations with ten or more employees found that poor quality in relational data alone caused about €400 million in extra annual costs in the Netherlands (empirical research on the business impact of data quality). Repeated local failures can therefore become enterprise-scale costs.
The practical question is how quickly a team can detect a change, contain its effects, and assign someone to correct it before the defect reaches a decision.
Why Data Quality Is Even More Important for AI and Governance
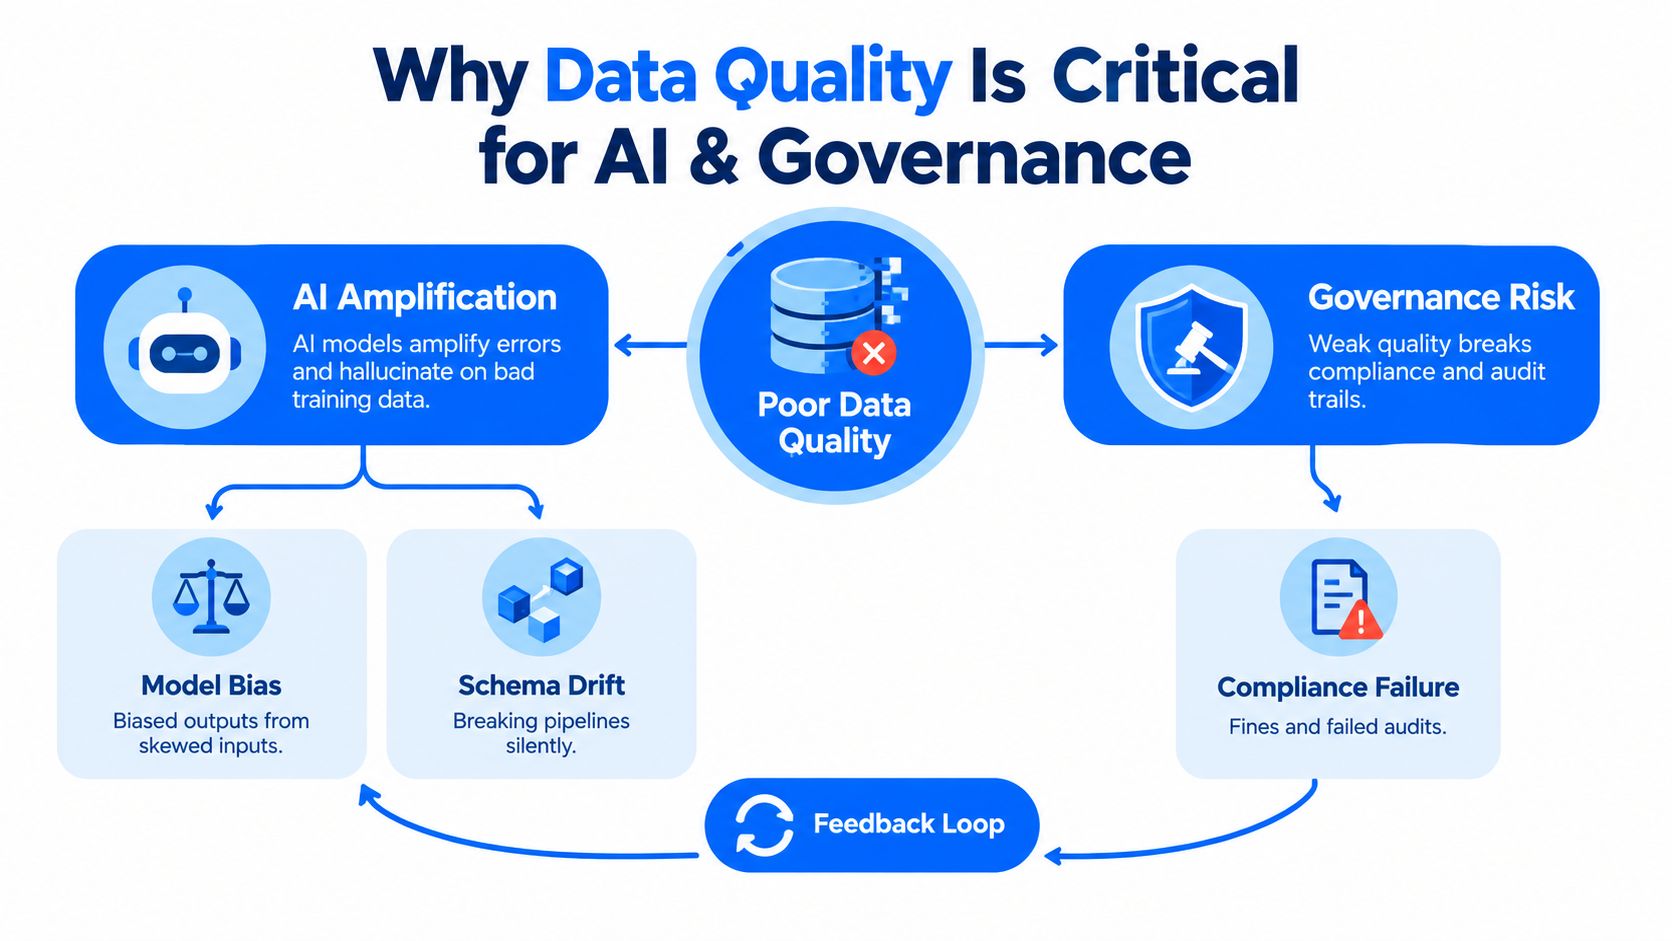
AI can turn a small data defect into a confident business action. Traditional reporting may expose an obvious error when a total fails to reconcile or a dashboard is stale. An AI system can instead transform the same flawed input into a classification, recommendation, generated text, or automated decision that appears reasonable.
AI readiness depends on more than accurate values. Teams must know whether data is current, balanced, representative, accessible, auditable, and traceable throughout its life cycle. A model can perform well on a narrow test set, then fail when production data changes or underrepresented cases enter the workflow. The quality of data behind an AI model determines how much trust its output deserves.
AI amplifies defects across workflows
A missing field may affect one report. In a machine learning workflow, that omission can influence feature creation, training, evaluation, and production scoring. A schema change may stop a pipeline, or pass through while changing a feature's meaning.
Governance adds a requirement for evidence. Teams need to show which data a system used, which rules applied, when the data arrived, and how an incident was handled. Without that record, explaining an automated decision becomes difficult even when the result looks plausible.
ISO/IEC 5259-5:2025 defines a data-quality governance framework for analytics and machine learning across the data life cycle. Its dimensions include accessibility, auditability, currentness, accuracy, timeliness, balance, diversity, and representativeness (ISO/IEC 5259-5:2025 framework).
Readiness means fitness you can demonstrate
Market research cited with the standard found that only 12% of organizations said their data had sufficient quality and accessibility for effective AI implementation, while 64% identified data quality as their top data integrity challenge. The figures indicate a readiness gap, not a requirement for flawless data everywhere.
The practical objective is controlled use. Define which dimensions matter for each model, monitor them continuously, preserve evidence, and stop or quarantine data outside agreed limits. Governance works best when connected to the pipelines that create and consume data, so teams can detect problems early and prevent repeated downstream cost instead of treating quality as paperwork after deployment.
Real Examples of Risk When Data Quality Fails
A data-quality failure can remain invisible while systems continue operating normally. The business impact depends less on whether an error exists than on how long it remains available to downstream users.
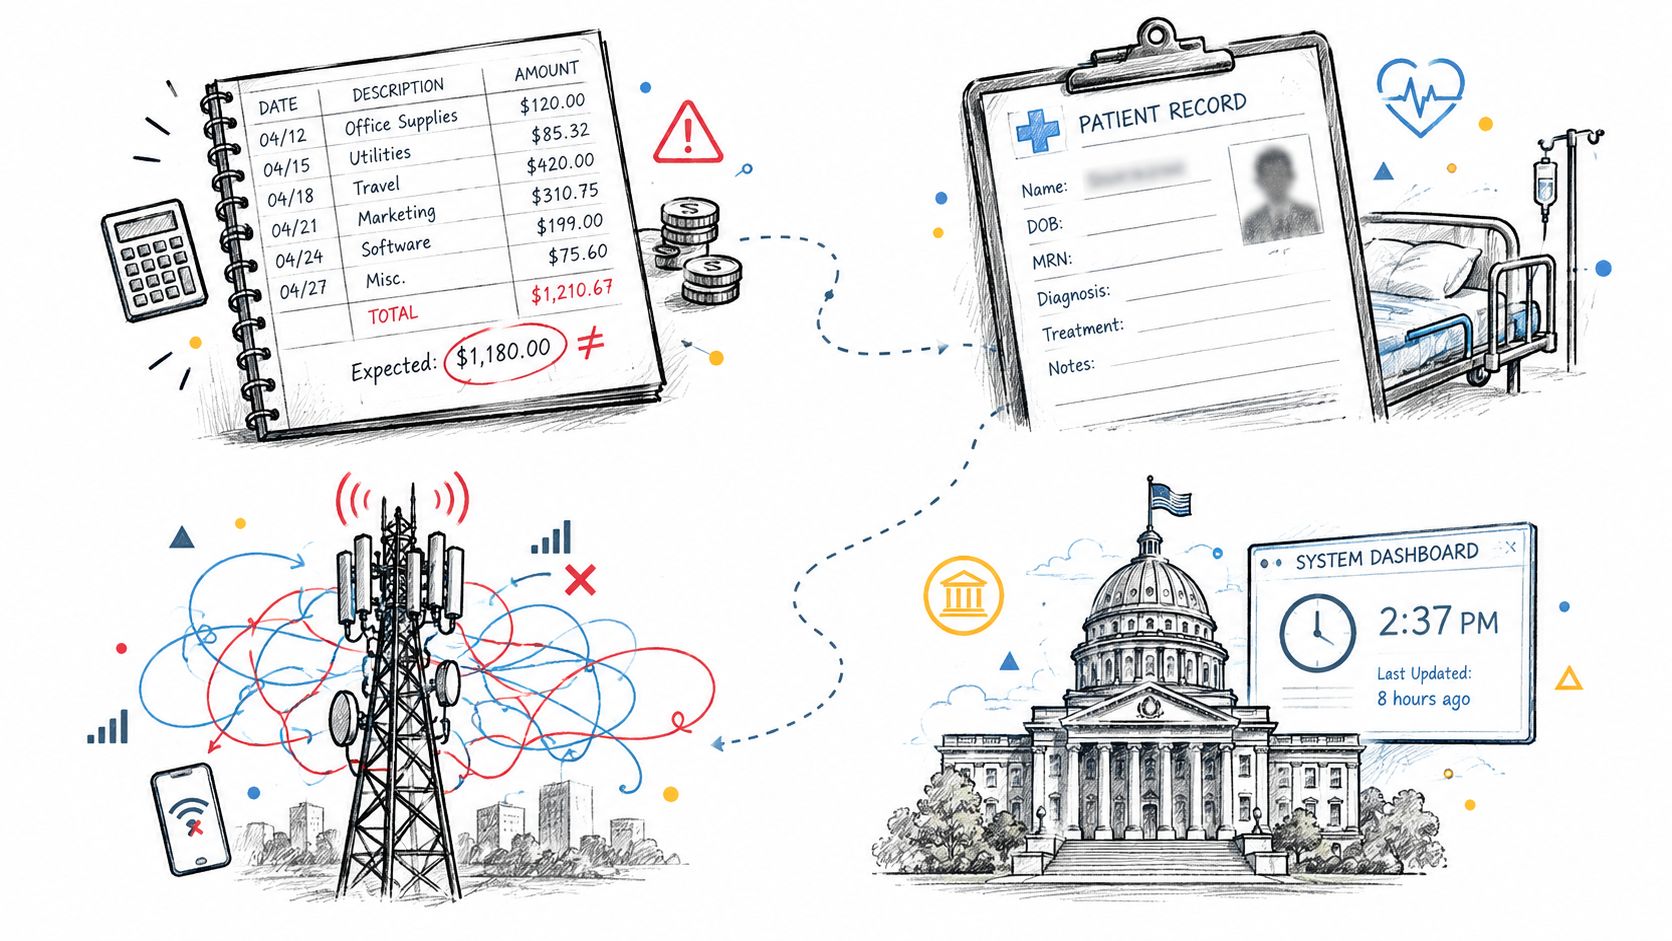
In finance, a late transaction load can make a risk dashboard appear calmer than the underlying portfolio. In healthcare, missing or inconsistent patient attributes can complicate clinical reporting and regulatory submissions. In telecommunications, a schema change in usage data can alter aggregation logic and leave teams analyzing incomplete customer activity. In the public sector, inconsistent identifiers can prevent reliable reconciliation across agencies.
These failures do not require a dramatic outage. A report may refresh successfully while omitting a partition. A pipeline may accept a new data type while downstream logic interprets it incorrectly. A model may continue scoring after its input distribution shifts, producing results that look valid but no longer support the same decision.
Reactive repair versus early control
The 1-10-100 rule illustrates why detection time has an economic effect. It costs about $1 to prevent a data error, $10 to correct it after it enters the system, and $100 to deal with it if left unchecked (1-10-100 data quality cost model).
Approach | What happens | Typical consequence |
|---|---|---|
Preventive control | A rule or contract blocks an invalid value before publication | The issue stays close to its source |
Early detection | Monitoring identifies an unusual value, delay, or structural change | A smaller team can investigate before downstream use |
Reactive remediation | Users discover the issue in a report, model, or business process | Reconciliation, rework, and trust recovery take longer |
Perfect data is not the operating requirement. The practical goal is to identify defects while they are local, before reports, models, and business processes depend on them.
Industry evidence summarized by TechTarget reported that average monthly incidents rose from 59 to 67 between 2022 and 2023, while the average revenue share affected rose from 26% to 31% (incident and revenue impact evidence). In this context, the figures point to a prevention question: how quickly can a team detect a defect, identify exposed consumers, and stop further use? Faster detection limits the number of systems requiring correction and keeps remediation closer to the source.
How to Control Data Quality With Validation Timeliness and Monitoring
A workable quality program combines controls at different points in the data life cycle. Validation prevents known rule violations. Anomaly detection finds behavior that rules don't describe. Timeliness monitoring identifies delivery failures, while schema tracking catches structural changes that can break consumers.
Start with explicit expectations
Record-level validation is the right tool for deterministic conditions. Check required fields, accepted values, uniqueness, referential integrity, date relationships, and business rules. A payment record might need a valid account reference. An order might require a nonnegative quantity and a delivery date that follows the order date.
Anomaly detection addresses a different question: does today's behavior differ from the established pattern? A static threshold may miss a gradual shift or flag a normal seasonal change. Baseline learning can help identify unusual volumes, distributions, or metric movements without requiring engineers to write every possible rule.
Monitor delivery and structure
Timeliness monitoring should reflect how consumers use the data. Track expected arrival, missing loads, late partitions, and unexpected early deliveries. A dataset that arrives after a morning decision may be technically complete but operationally useless.
Schema tracking watches for added or removed columns, renamed fields, and data type modifications. It gives producers and consumers a chance to coordinate before a structural change alters a dashboard or model.
Practical rule: Detect the failure closest to the point where it enters the system, then route the alert to the person who can correct it.
A shared dashboard helps data engineers, analysts, and business owners see the same incident, history, and status. In-database execution can keep metric computation inside the customer's environment, reducing unnecessary data movement and aligning monitoring with security requirements. Teams can combine these practices with the data validation rules and continuous quality approach.
Stage | Relative Cost | Business Impact |
|---|---|---|
Prevent | About $1 | Stops an error before it spreads |
Detect and correct early | About $10 | Limits affected systems and reduces investigation effort |
Remediate after failure | About $100 | Extends rework, delays decisions, and damages trust |
The order matters. Prevention protects the process, detection protects the decision, and remediation restores the system after damage has already spread.
Conclusion Building Trust in Data for Analytics and AI
A reliable quality program starts with a choice, not a checklist. Select the three datasets whose failure could most seriously affect revenue, compliance, operations, or an AI system. These datasets become the first proving ground for controls that are specific enough to support decisions.
For each one, write down the decision it supports, the acceptable arrival time, and the conditions that make a record usable. Assign an owner who can act when those conditions fail. Validation then checks whether the data is fit for its purpose, while timeliness controls confirm that it is available when the decision requires it.
Use the same small set of questions for each dataset:
Fitness: Which fields, values, and relationships must be accurate, complete, valid, consistent, and unique?
Timeliness: How late can the data arrive before the supported decision is affected?
Ownership: Who investigates the alert, corrects the source, and confirms recovery?
Evidence: What record shows the failure, response, and outcome?
This approach avoids a common trap: spending equal effort on every table. A low-impact exploratory dataset can wait, while a financial metric, regulatory feed, or production model receives attention first. The goal is not perfect data everywhere. It is dependable data where errors carry consequences, with controls that can be tested and improved.
digna supports this operating model as an in-environment data quality and observability platform. Its modules provide anomaly detection, record-level validation, timeliness monitoring, schema-change tracking, historical analysis, and shared visibility across warehouses, lakes, and pipelines without moving production data outside the customer's environment.
Visit digna to see how its modular platform can help your team validate critical records, track delivery timeliness, detect anomalies, and identify schema changes inside your own infrastructure. Start by documenting the top three datasets, then expand monitoring as the team learns which controls prevent the most consequential failures.
Timeliness is the dimension teams most often leave undefined, and it is the one that decides whether a correct dataset is still useful at the moment of the decision — for the metrics and monitoring patterns behind it, see digna's guide to data timeliness.
Frequently asked questions
Why is data quality important for business ROI?
Because defects travel. One duplicated customer record can inflate demand and one late transaction load can distort cash reporting. Gartner puts the average cost of poor data quality at USD 12.9 million a year, and research cited by MIT Sloan places the revenue drag at 15% to 25% for many companies.
How much does it cost to fix a data quality problem after it spreads?
The 1-10-100 rule is the working benchmark: roughly $1 to prevent an error, $10 to correct it once it has entered the system, and $100 to deal with it if left unchecked. Time-to-detection, not the size of the defect, drives most of that cost.
What are the dimensions of data quality?
Accuracy, completeness, consistency, timeliness, validity and uniqueness. They are not interchangeable: a dataset can be accurate but late, complete but inconsistent, or timely but invalid. That is why a single quality score usually hides the problem that actually needs fixing.
Why does data quality matter more for AI than for reporting?
Reporting often exposes an error when a total fails to reconcile or a dashboard goes stale. An AI system instead turns the same flawed input into a confident classification or recommendation. Only 12% of organizations say their data has sufficient quality and accessibility for effective AI implementation.
How do you start a data quality program?
Pick the three datasets whose failure would most affect revenue, compliance or a production model. For each one, write down the decision it supports, how late it can arrive, and the conditions that make a record usable, then name an owner who acts when those conditions fail.


