CMMI for Data Management: A Practical Maturity Guide
|
7
min read

The most popular advice about CMMI for data management is to start by documenting policies, defining ownership, and preparing evidence for an assessment. That advice is incomplete. A policy that says “monitor data quality” doesn't protect a dashboard when a source adds a column, changes a datatype, delivers a file late, or violates a business rule. Mature data management must prove that controls work throughout the lifecycle, not merely prove that someone wrote them down.
CMMI becomes more useful when teams treat it as an operating model for observable, repeatable, and improvable data processes. Documentation still matters, especially in regulated environments, but it should describe controls that generate operational evidence. The practical question is no longer only whether a governance process exists. It's whether the organization can detect failure, explain its impact, assign ownership, and demonstrate that performance is improving.
Table of Contents
Understanding CMMI for Data Management
From software process to data capability
The Five Maturity Levels and Assessment Criteria
What the levels mean operationally
Why the 25 process areas matter
Mapping Framework Practices to Modern Data Operations
Turn process language into control behavior
Build evidence into the workflow
Moving Beyond Static Governance Artifacts
The lifecycle gap
Building Your Data Maturity Implementation Roadmap
A phased approach
Data maturity KPIs by implementation phase
Accelerating Maturity with the digna Platform
Match modules to maturity evidence
Compare deployment choices
Securing Long-Term Data Reliability and Trust
Understanding CMMI for Data Management
CMMI's history explains both its value and its reputation. The broader process-improvement timeline began with Software CMM work in 1987, followed by the first SW-CMM release in 1991. The integrated CMMI product suite was first published in 2000, establishing a broader foundation for evaluating organizational capability rather than focusing only on individual technical tasks. This history is documented in the CMMI development reference.
The framework also gained credibility in markets where repeatability and auditability weren't optional. The 1999 Gansler Memo required DoD Software Evaluations for ACAT I programs and stated that full compliance with CMMI Capability Maturity Model Level 3, or an equivalent approved evaluation, was the Department's goal. CMMI for Acquisition followed in 2007, CMMI for Services in 2009, and the three major variants were aligned in Version 1.3 in November 2010, according to the CMMI Acquisition Handbook.
From software process to data capability
The dedicated Data Management Maturity, or DMM, model extended that maturity logic into enterprise data practices. It was released in August 2014, after about 3.5 years of development, and was positioned as a structured way to evaluate data management from creation or acquisition through retirement. That lifecycle perspective makes the model relevant to organizations managing warehouses, lakes, operational systems, reporting platforms, and AI pipelines.
The DMM model contains five maturity levels and 25 process areas across strategy, quality, operations, platforms and architecture, governance, and supporting processes. Its value is decomposition. “Improve data governance” is too broad to manage; a process-area view lets a team identify whether the weakness sits in ownership, quality controls, platform practices, lifecycle operations, or measurement. The DMM model material describes the framework as a way to assess capability, strengthen the data management program, and create an improvement roadmap aligned with business goals.
Practical rule: Treat every maturity claim as incomplete until you can connect it to repeatable evidence from the systems that process the data.
That principle changes how enterprise teams use data management frameworks. CMMI isn't just a legacy software engineering checklist, and it isn't useful as a paperwork exercise. It's a structured way to align data strategy, controls, operating behavior, and business outcomes, provided the assessment includes what happens in production.
The Five Maturity Levels and Assessment Criteria
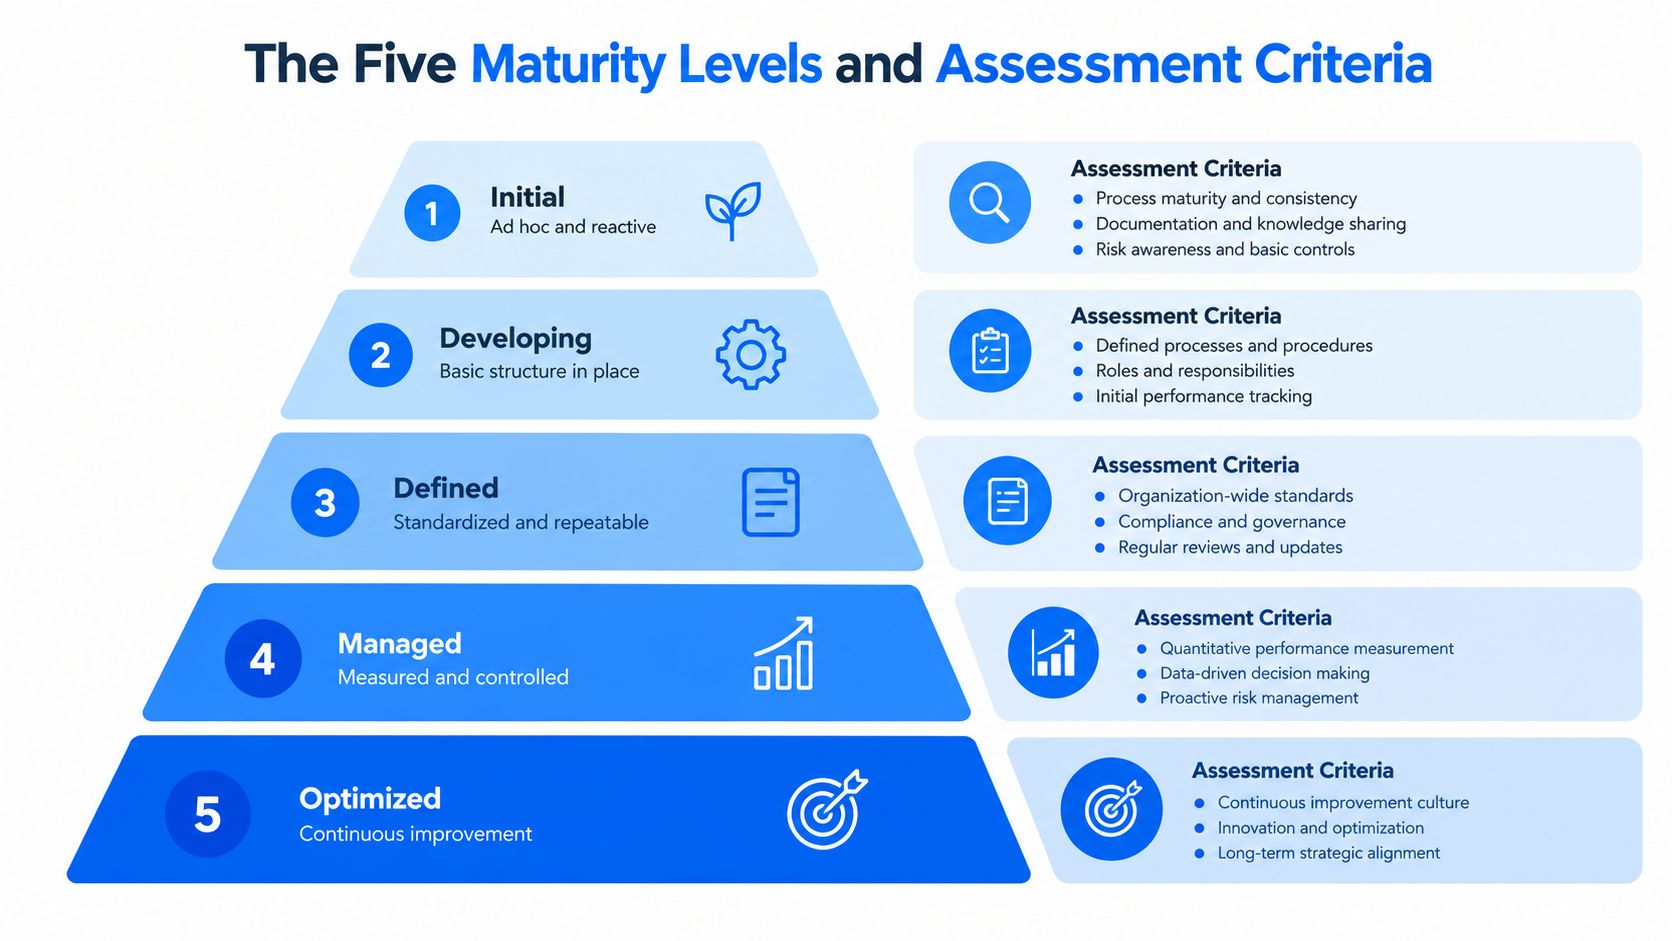
A maturity level describes how consistently an organization performs and improves its processes. The five-level progression moves from reactive, project-level handling toward measured and optimized enterprise capability. The levels shouldn't be treated as labels to display on a slide. Each level requires evidence that the organization manages data with greater consistency, visibility, and control.
What the levels mean operationally
Level 1, Initial, describes unpredictable and reactive work. Teams depend on individual knowledge, manual intervention, and incident-driven responses. Data may still reach users, but the organization can't reliably explain how controls operate across products or domains.
Level 2, Managed, introduces planning and control at the project or team level. A pipeline team may track quality issues and delivery schedules, but practices can vary between departments. Evidence exists, though it remains fragmented and often depends on local conventions.
Level 3, Defined, is the point where enterprise-wide standardization becomes visible. Teams use common process definitions, shared data terms, documented responsibilities, and consistent control patterns. For data operations, this should include common expectations for validation, incident handling, schema change management, and delivery monitoring.
Level 4, Quantitatively Managed, requires more than a dashboard full of status indicators. Teams use quantitative measures to understand process behavior, establish baselines, identify variation, and manage performance against explicit objectives. A mature team can distinguish an isolated defect from a meaningful shift in timeliness, volume, completeness, or another monitored property.
Level 5, Optimizing, applies disciplined continuous improvement. Teams use operational evidence to refine controls, remove recurring failure modes, and improve the way data processes perform. Optimization isn't the same as adding more alerts. It means learning which signals matter, reducing avoidable noise, and changing processes based on observed behavior.
Why the 25 process areas matter
The 25 process areas divide data management into assessable capabilities across strategy, data quality, operations, platforms and architecture, governance, and supporting processes. This granularity helps leaders avoid a misleading enterprise-wide average. A company might have strong platform controls but weak data strategy, or well-defined policies with poor lifecycle monitoring.
The DMM model can support a data governance maturity model assessment that maps capability gaps to practical remediation. An assessment should ask what evidence exists for each relevant area:
Defined ownership: Can the organization identify accountable owners for critical data and controls?
Repeatable execution: Do teams apply the same process across comparable datasets?
Measured performance: Are quality, timeliness, structural change, and incident measures collected consistently?
Management response: Do teams use those measures to prioritize remediation?
Improvement behavior: Can leaders show that recurring issues lead to process changes?
A workshop update described a more granular structure of 6 categories, 15 component areas, 36 business process areas, 18 policies and procedures, and 200 capability measures in the NDIA workshop material. That level of detail reinforces an important point. Assessment quality depends on reproducible evidence, not on how polished the governance documentation looks.
Mapping Framework Practices to Modern Data Operations
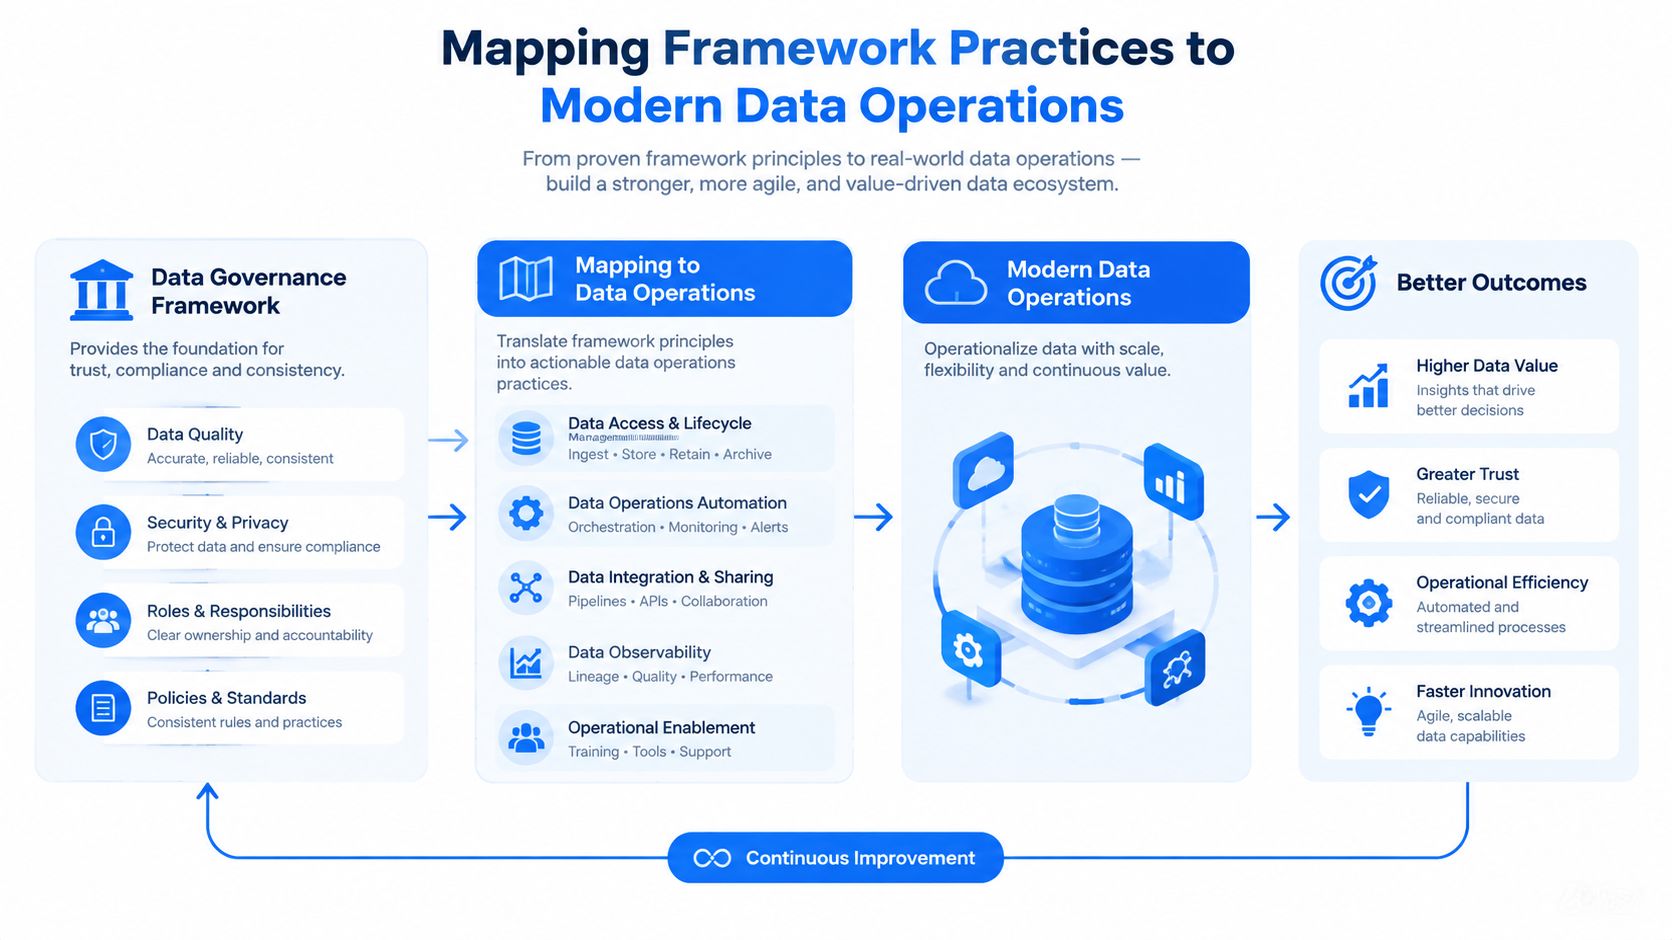
A CMMI process area becomes useful to engineers when it translates into a behavior they can observe and manage. The mapping should start with the business risk, then identify the data signal that reveals failure, the control that responds, and the evidence retained for review.
Turn process language into control behavior
Begin with schema management. Added columns, removed columns, and datatype changes can break downstream consumers, especially when pipelines rely on implicit structure. A written change policy won't identify the failure by itself. Continuous schema tracking should record the previous structure, the observed change, affected assets, and the owner responsible for review. The underlying schema-drift problem is described in this enterprise data observability comparison.
Next, instrument timeliness. Data that arrives late can be as harmful as data that contains invalid values. A delivery control should learn or use expected schedules, identify missing loads, flag delays and early deliveries, and calculate the expected delivery time where possible. That creates evidence for operational consistency instead of relying on a team member noticing that a report hasn't refreshed.
Then apply record-level validation to fields where deterministic logic matters. Regulated or high-impact data often requires versioned catalogs of business rules, acceptable thresholds, and freshness SLAs. A failed validation should retain the rule version, affected records or scope, execution time, outcome, and remediation status. The data quality management guidance describes this approach as a way to enforce consistent data fitness and support auditability.
Build evidence into the workflow
A practical implementation follows four steps:
Select critical assets: Prioritize datasets that support regulatory reporting, financial decisions, clinical operations, customer commitments, or AI workloads.
Define observable expectations: Specify valid structures, business rules, delivery behavior, and acceptable metric patterns.
Automate detection: Run checks where the data already resides, and capture results in a shared incident and history record.
Link response to governance: Assign owners, record decisions, document exceptions, and trend recurring failures.
An observability framework for data becomes more than a monitoring dashboard. It provides the operational layer that connects CMMI expectations to pipeline behavior. Engineers get actionable failure signals, governance teams get traceable evidence, and business owners can see whether critical data remains fit for use.
A mature control doesn't merely say that a dataset is governed. It shows what changed, when the change occurred, who reviewed it, and whether the business impact was contained.
Moving Beyond Static Governance Artifacts
Written policies are necessary, but they aren't proof of resilience. A team can maintain a thorough rule catalog while missing a gradual volume shift, a late upstream delivery, or a structural change that leaves downstream tables technically available but semantically wrong.
The benchmark evidence points to a broader organizational problem. EDM Council reports that Data Strategy, Data Management Strategy, and Business Case remain among the least mature strategy-related capabilities across industries, with fewer than one third of respondents reaching advanced progress in that area, as reported in its industry benchmarks. The implication isn't that teams need more documents. They need sustained funding, prioritization, and adoption across engineering, governance, analytics, risk, and business functions.
The lifecycle gap
A 2026 academic review identified 11 major shortcomings in existing data management maturity literature, including inadequate coverage of the complete data lifecycle, missing practical self-assessment schemes, and weak treatment of legal and ISO compliance. Those findings support a contrarian conclusion: maturity programs often overemphasize static artifacts while underweighting operational evidence. The review is available through IEEE Computer Society.
Static controls fail in predictable ways:
Manual rule maintenance: Rules become outdated as schemas, sources, and business definitions change.
Point-in-time assessment: An audit can confirm that a process existed without showing how it behaved between reviews.
Siloed ownership: Governance may own policy while engineering owns execution, leaving no shared view of failure.
Unmeasured exceptions: Teams approve exceptions without tracking whether they become permanent operating conditions.
Continuous monitoring addresses those weaknesses by capturing behavior over time. In-database observability keeps data inside the customer's environment while computing metrics where the data already lives, supporting anomaly detection, schema tracking, timeliness monitoring, and record-level validation. The in-database observability overview explains why this design reduces unnecessary data movement while supporting operational checks.
The goal isn't to eliminate documentation. It's to make documentation describe controls that run, generate evidence, and trigger accountable action.
Building Your Data Maturity Implementation Roadmap
A maturity roadmap should start with operational risk, not with the level an executive team wants to announce. Assess the critical data products, identify the failure modes that create the greatest business exposure, and then fund the process areas that reduce that exposure first.
A phased approach
Phase one establishes a reliable baseline. Create a practical inventory of critical datasets, owners, lineage, business definitions, policies, and known consumers. Don't attempt to catalog every asset before starting. The initial objective is to identify where failure would affect reporting, compliance, operations, or AI.
Phase two makes controls repeatable. Standardize validation patterns, incident ownership, schema review, and delivery expectations. Teams should collect evidence automatically rather than asking engineers to assemble screenshots and spreadsheets during an assessment.
Phase three introduces quantitative management. Trend the behavior of critical datasets, distinguish normal variation from meaningful anomalies, and connect incidents to service expectations. Measures should help managers decide where to invest, not merely decorate a status report.
Phase four optimizes the operating model. Remove noisy checks, refine thresholds, improve escalation paths, and use historical evidence to prevent recurring failures. Optimization should reduce manual effort while improving confidence in the signals teams receive.
Data maturity KPIs by implementation phase
Implementation Phase | Target Maturity Level | Key Performance Indicators (KPIs) | Required Operational Evidence |
|---|---|---|---|
Baseline and ownership | Initial to Managed | Critical assets identified, accountable owners assigned, known failure modes recorded | Catalog records, ownership assignments, policy inventory, risk register |
Standardized controls | Managed to Defined | Validation coverage, schema-change review coverage, delivery expectations defined, incident workflow adoption | Versioned rules, schema history, timeliness records, incident assignments |
Quantitative management | Defined to Quantitatively Managed | Anomaly frequency, validation failure patterns, delivery variance, time to detect, time to acknowledge | Historical metric trends, baselines, alert history, response timestamps |
Continuous optimization | Quantitatively Managed to Optimizing | Recurring issue reduction, alert usefulness, remediation completion, control refinement | Improvement decisions, post-incident analysis, changed thresholds, trend evidence |
Teams can use a focused data quality implementation to turn the roadmap into work that engineers and governance leaders can share. Keep the decision matrix simple: prioritize controls where the impact is high, detection is currently weak, and remediation is feasible with available ownership.
Decision principle: Fix the blind spots that can silently invalidate important decisions before adding controls to low-risk data.
A roadmap succeeds when each phase produces usable evidence and visible risk reduction. It fails when the organization treats maturity as a certification project disconnected from daily pipeline operations.
Accelerating Maturity with the digna Platform
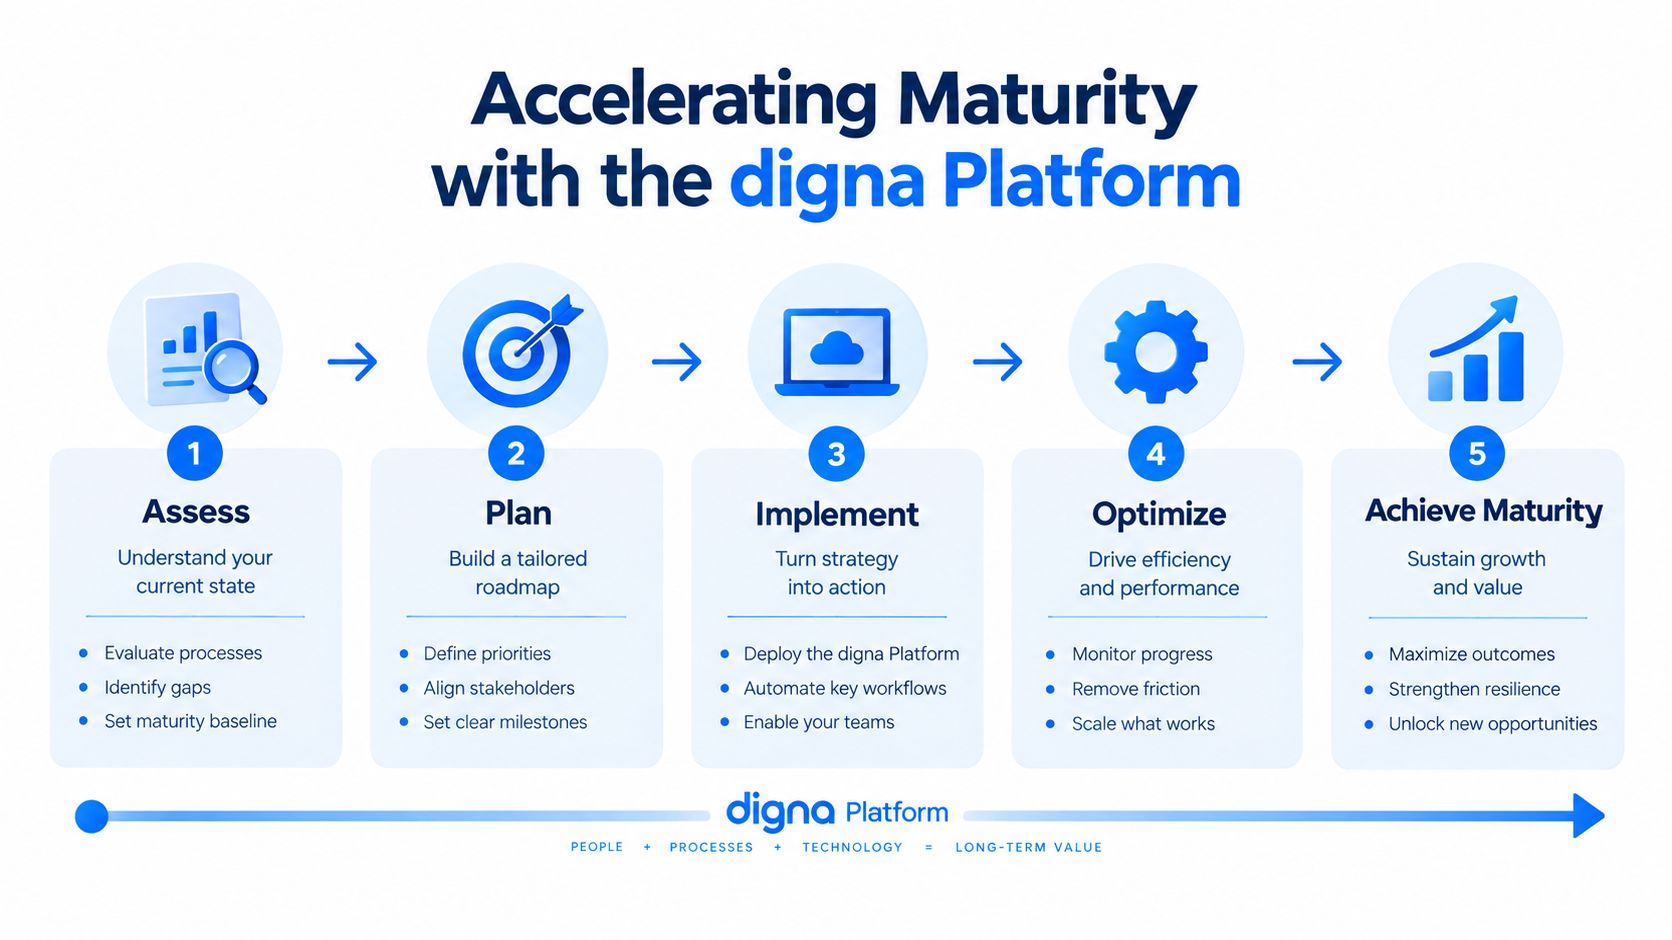
The technology choice should follow the evidence requirement. Teams can combine separate monitoring tools, build internal checks, or use a modular platform that brings structural, behavioral, delivery, and record-level signals into one operating view. The trade-off is straightforward. Custom checks offer precise control but require ongoing engineering ownership, while disconnected tools can create fragmented incidents and inconsistent evidence.
Match modules to maturity evidence
At an early maturity stage, Schema Tracker supplies a visible record of structural changes, including added or removed columns and datatype modifications. That supports a defined review process without requiring engineers to discover every change through downstream failure.
For behavioral monitoring, Data Anomalies uses AI-driven baseline learning and continuous anomaly detection without requiring manual rule setup for every expected pattern. Data Analytics adds historical analysis so teams can examine trends, volatility, and statistical behavior rather than responding only to the latest alert.
Timeliness addresses delivery reliability. It monitors arrival behavior, flags delays, missing loads, and early deliveries, and calculates expected delivery time. Data Validation handles deterministic record-level checks against business rules, making it suitable for regulated fields, audit requirements, and targeted quality controls.
Compare deployment choices
The platform's in-database execution model computes and analyzes metrics within the customer's databases, so production data remains in place. Private cloud and on-premises deployment options allow teams to run the system inside their cloud, VPC, or data center, which aligns with strict security, governance, and data residency requirements.
A shared dashboard gives data engineers, analysts, and stakeholders one place to review incidents, trends, and status. The system also includes a scheduler, data catalog, integrations, and collaboration features from the initial module selection. Modular licensing lets an organization start with one module and expand, with pricing based on a base fee plus active tables per module.
This makes the digna data quality management solution a practical option for teams that need to connect CMMI evidence to production behavior without multiplying tool sprawl. It doesn't replace ownership, policy decisions, or remediation discipline. It automates the observation and evidence collection that those practices require.
Securing Long-Term Data Reliability and Trust
CMMI for data management should be run as a continuous operating discipline, not a periodic documentation exercise. The mature organization connects governance requirements to observable behavior across structure, delivery, business rules, and data patterns. That approach gives leaders evidence that controls operate in production and gives engineers signals they can act on before failures reach consumers.
The first three actions are practical:
Secure executive sponsorship: Tie the assessment to specific risks in reporting, compliance, operations, and AI.
Assess critical data processes: Map ownership, quality, operations, platforms, governance, and supporting processes to the five-level model.
Select automated monitoring: Instrument schema changes, timeliness, anomalies, and record-level validation inside the customer environment.
Higher maturity doesn't come from collecting more policy documents. It comes from making important data behavior visible, measurable, and subject to disciplined improvement. That foundation supports faster incident response, stronger compliance evidence, and sustained trust in enterprise data assets.
digna provides an in-environment data quality and observability platform for anomaly detection, timeliness monitoring, record-level validation, and schema tracking. Visit digna to connect CMMI maturity goals with continuous operational evidence across your critical data estate.
For a maturity view built around data quality specifically rather than process areas, see the data quality maturity model.
Frequently asked questions
What is CMMI for data management?
CMMI is a process-improvement model that describes how consistently an organisation performs defined practices, applied here to data work. It rates maturity by whether processes are repeatable and improvable, not by which tools you own, which is why documentation alone never raises a level.
What are the CMMI maturity levels in practice?
The levels describe behaviour, not paperwork. At the lower levels data work succeeds because individuals make it succeed; higher levels mean the same result happens regardless of who is on shift, because the process is defined, measured and deliberately improved.
Why do the 25 process areas matter?
They stop maturity from being a single vague score. Each area names a distinct capability, so an assessment can show that your measurement practice is strong while your configuration management is not, which is far more actionable than an overall rating.
How do you produce evidence for a CMMI appraisal?
Build it into the workflow rather than assembling it beforehand. Controls that run continuously — validation results, timeliness records, schema change history — generate appraisal evidence as a by-product, which is both cheaper and harder to dispute than a document written for the audit.
How is CMMI different from a data quality maturity model?
CMMI assesses process discipline across the whole of data management, including areas unrelated to quality. A data quality maturity model goes deeper on quality alone. Teams often use CMMI for organisational assessment and a quality model for the operational detail.


