Benefits of Data Quality for Modern Enterprises
|
8
min read

Poor data quality is still one of the fastest ways to bleed value out of a data platform. IBM's 2025 report says 43% of chief operations officers now rank data quality as their most significant data priority, and over a quarter of organizations estimate annual losses of more than USD 5 million from poor data quality, with 7% reporting losses of USD 25 million or more (IBM Institute for Business Value). That's no longer a cleanup problem, it's an operating-model problem.
The teams I've worked with usually feel the pain first in rework, not in headlines. Analysts stop trusting dashboards, engineers chase mismatched counts, and business users build shadow spreadsheets because the official numbers keep shifting. The cost isn't only bad reports. It's slower decisions, more manual validation, and weaker confidence in every AI or analytics initiative built on top of the same data.
Table of Contents
The True Cost of Poor Data Quality
The fastest way to lose trust in a data platform is to call data quality a housekeeping task. The cost shows up in missed SLA deadlines, rework, and decisions made on stale or inconsistent inputs. Gartner's data quality topic places the average annual loss from poor data quality at USD 12.9 million per organization (Gartner data quality topic). Earlier industry work also tied poor data quality to roughly USD 600 billion a year in U.S. business costs, which is why the problem has always been operational, not cosmetic (IBM Institute for Business Value, Gartner study PDF).
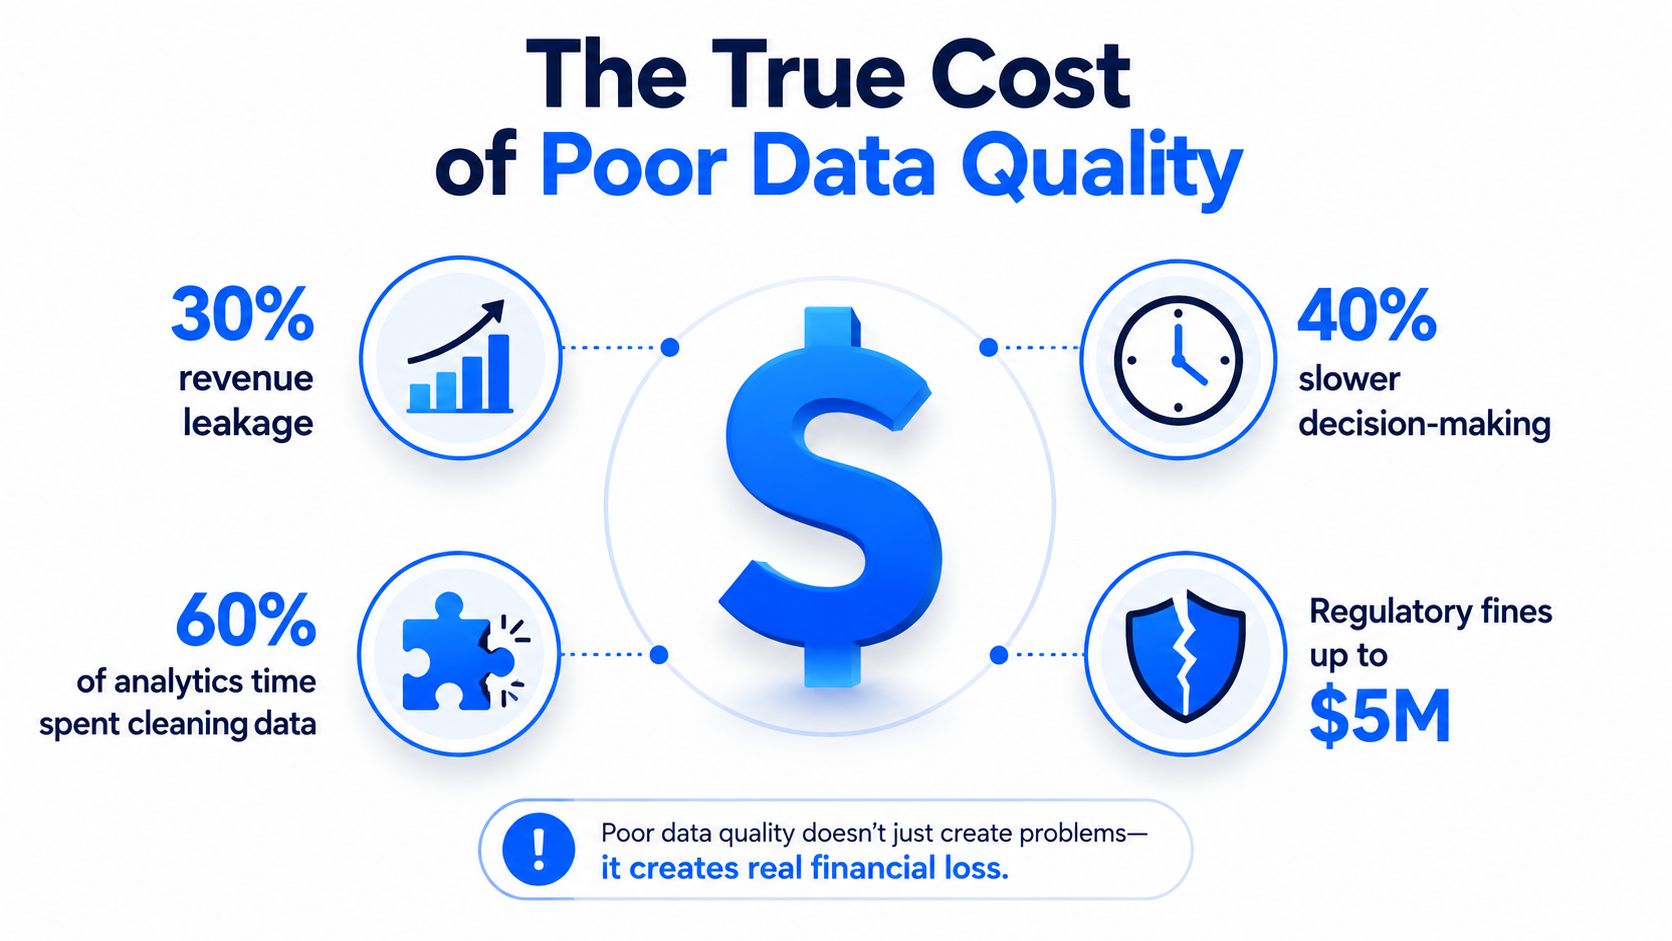
Where the money actually goes
The loss usually lands in three places. Teams burn hours reconciling conflicting numbers instead of shipping work. Bad inputs raise operating costs because every downstream fix is more expensive than catching the issue upstream. Decisions also drift when data is incomplete, stale, or inconsistent.
Practical rule: if a data issue reaches an analyst, a finance owner, and an engineer, the problem is already expensive.
That cost shows up across finance, operations, compliance, and AI programs at the same time. A quick way to make that visible is the data downtime cost calculator, which turns vague frustration into incident cost, lost time, and rework.
The business case is bigger than cleaner dashboards
The value case is not abstract. Research-based business value work linked a 1.9% increase in labor productivity from IT to about USD 21.7 million for the average enterprise, showing how small process gains can create large financial returns when they scale across the organization. That same logic applies to data quality controls, because every avoided remediation cycle preserves analyst time, engineering time, and decision speed.
Manual checks also create hidden documentation debt. Teams that rely on tribal knowledge spend more time explaining why a pipeline failed than fixing the pipeline itself. That is one reason automated documentation workflows for developers matter in the same reliability conversation, because clearer systems are easier to govern and less likely to fail (automated documentation workflows for developers).
The practical takeaway is simple. Bad data does not just create bad reports. It drains productivity, raises operating costs, and weakens confidence in every number leaders approve.
Technical Benefits of Automated Observability
Manual rule sets fail quickly once pipelines change every day. A small set of handcrafted checks can catch known errors, but it misses unknown anomalies, silent schema shifts, and late arrivals that do not break a static rule. Automated observability closes that gap by learning normal behavior, watching for drift, and flagging issues before downstream consumers turn them into broken reports or unstable models.
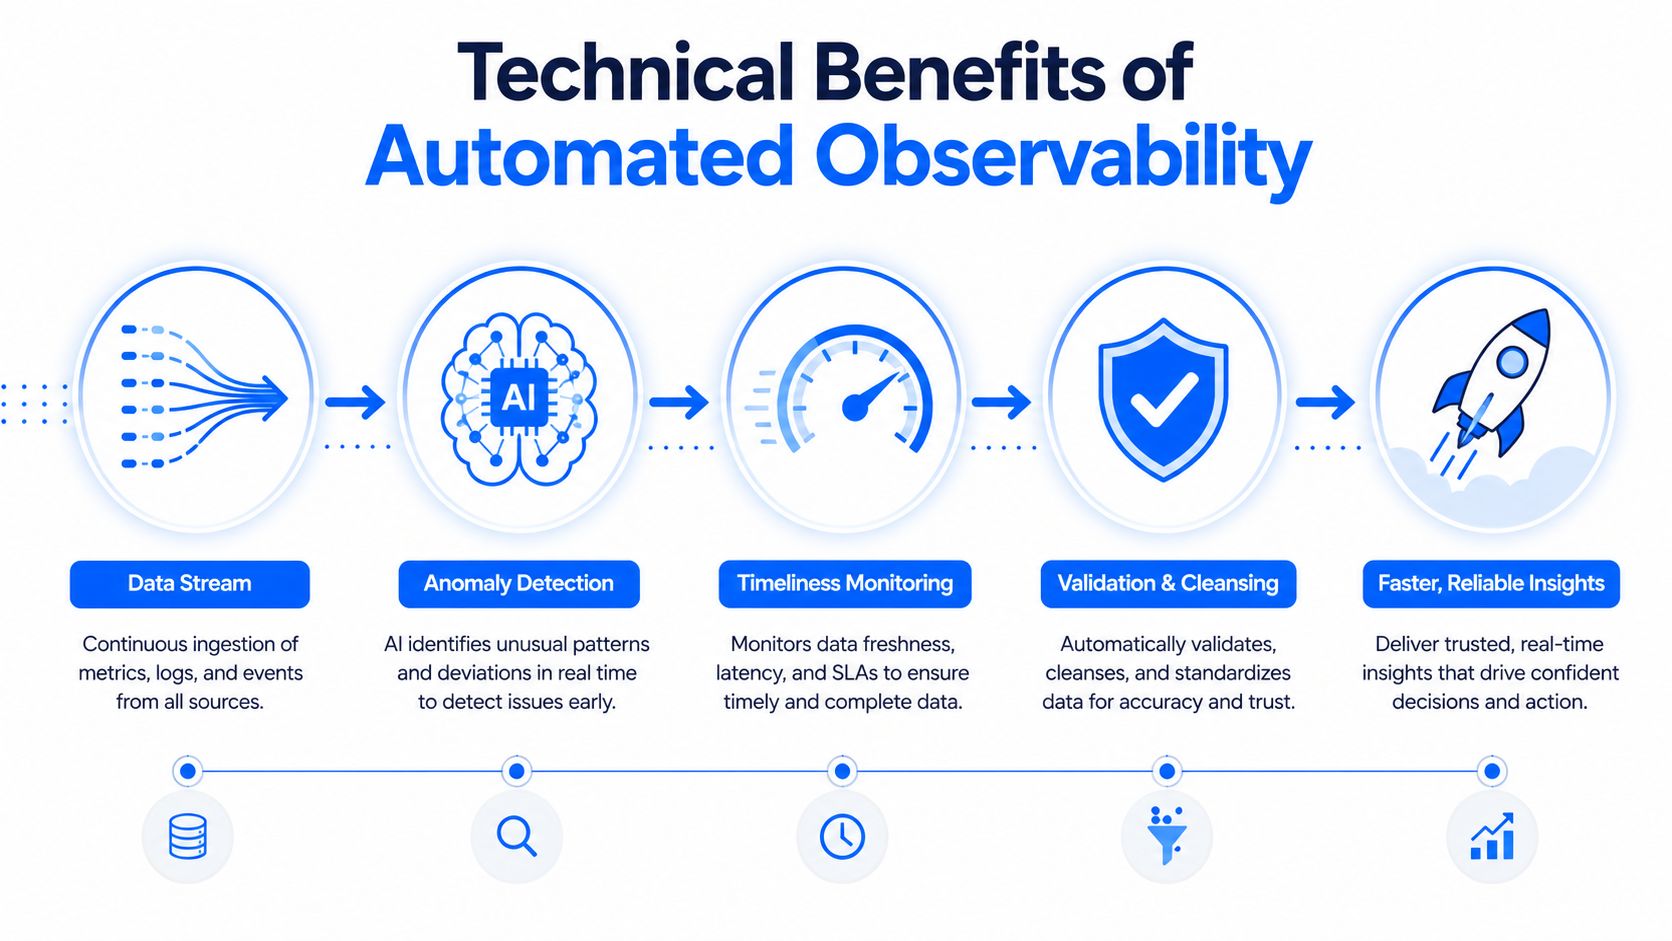
Anomaly detection is about unknowns, not just thresholds
Traditional checks work well for known failure modes, but they are blunt when a dataset changes shape. AI-driven anomaly detection learns expected behavior over time, then raises a flag when volume, distribution, or relationships move outside the baseline. That matters because many costly incidents begin as subtle shifts, not obvious breakages.
Google research on data quality for machine learning emphasizes that trustworthy AI depends on accuracy, completeness, and consistency in training and test data, because unstable inputs weaken model behavior and can distort business KPIs even when pipelines still run (Google research). In practice, detection has to happen before bad records land in dashboards or retraining jobs.
Timeliness monitoring and schema tracking protect the pipe
Late data and changing structure are two of the most common reasons teams lose trust in their pipelines. A published study reported that schema monitoring reduced data integration failures by 67.9% and cut time-to-detection from 19.7 hours to 1.3 hours (Google research). That is a meaningful operational shift, because shorter detection windows mean fewer users see stale metrics and fewer engineers get pulled into fire drills.
Continuous monitoring is cheaper than incident response. Every hour you catch earlier is one less hour spent explaining why the dashboard was wrong.
The cost of waiting shows up even more clearly in drift-heavy environments. One analysis says schema drift accounts for 70% of pipeline failures, and that organizations spend about 40% of development cycles on data-related rework when drift is found late (DataGaps). Even if those figures are not universal constants, the direction is hard to miss. Manual checks do too little, too late.
In-database execution matters
A modern observability layer should work where the data already lives. In-database execution limits movement, keeps security boundaries intact, and reduces the overhead of pulling large tables into a separate validation layer. That is one reason teams evaluate platforms like digna's data observability, because its layer checks data in place rather than duplicating it.
The technical win translates into business value. Better anomaly detection lowers rework. Timeliness monitoring shortens incident windows. Schema tracking prevents silent failures that would otherwise contaminate analytics and AI features. Those are technical controls, but leadership feels the result in fewer broken dashboards, fewer escalations, and less time lost to cleanup.
Data Quality as the Foundation for AI Readiness
AI systems are only as trustworthy as the data they consume. That sounds obvious, but many teams still learn it the hard way. They build models first, then discover that missing fields, stale values, or inconsistent definitions make the outputs unreliable. Once that happens, AI becomes harder to trust, harder to govern, and harder to scale.

AI readiness starts with reliable inputs
Data quality is the control layer for AI readiness. If training sets are incomplete or inconsistent, the model inherits those weaknesses. If production data drifts, outputs degrade even when the code stays the same. The failure often looks like a model problem, but the root cause is data instability.
Forrester's 2025 Data Quality Solutions report says these tools help “turn data reliability and trust into a competitive advantage” and “accelerate AI readiness and adoption” (Forrester). That matches what teams see in production. Data quality is moving from cleanup work to an always-on readiness function.
Real-time governance is becoming the norm
Board.org found that 39% of data leaders struggle to demonstrate governance impact to leadership, which explains why this work still lacks clear proof points in many organizations (Board.org). The answer is operational evidence. Real-time monitoring, lineage, and schema tracking give leaders something concrete to inspect when they need to justify spend or explain an incident.
A governance benchmark preview also reported that 69% of data and analytics leaders use real-time data monitoring as a governance and data quality practice (Forrester). That matches the operating model shift I see most often. Federated teams cannot wait for monthly audits when models, reports, and product decisions keep changing.
The practical takeaway is simple. If AI depends on the data layer, then data quality has to be treated like runtime infrastructure, not a quarterly review item. Teams need data discipline that keeps AI models grounded in reliable inputs, because the point is not prettier dashboards. It is protecting the trust boundary between raw inputs and automated decisions.
Industry-Specific Use Cases and Solutions
Data quality gets real when it's tied to industry risk. Finance, healthcare, and telecom all have different failure modes, but they share the same requirement, the numbers have to be right when the business acts on them. A platform has to handle those differences without forcing every team into the same brittle ruleset.
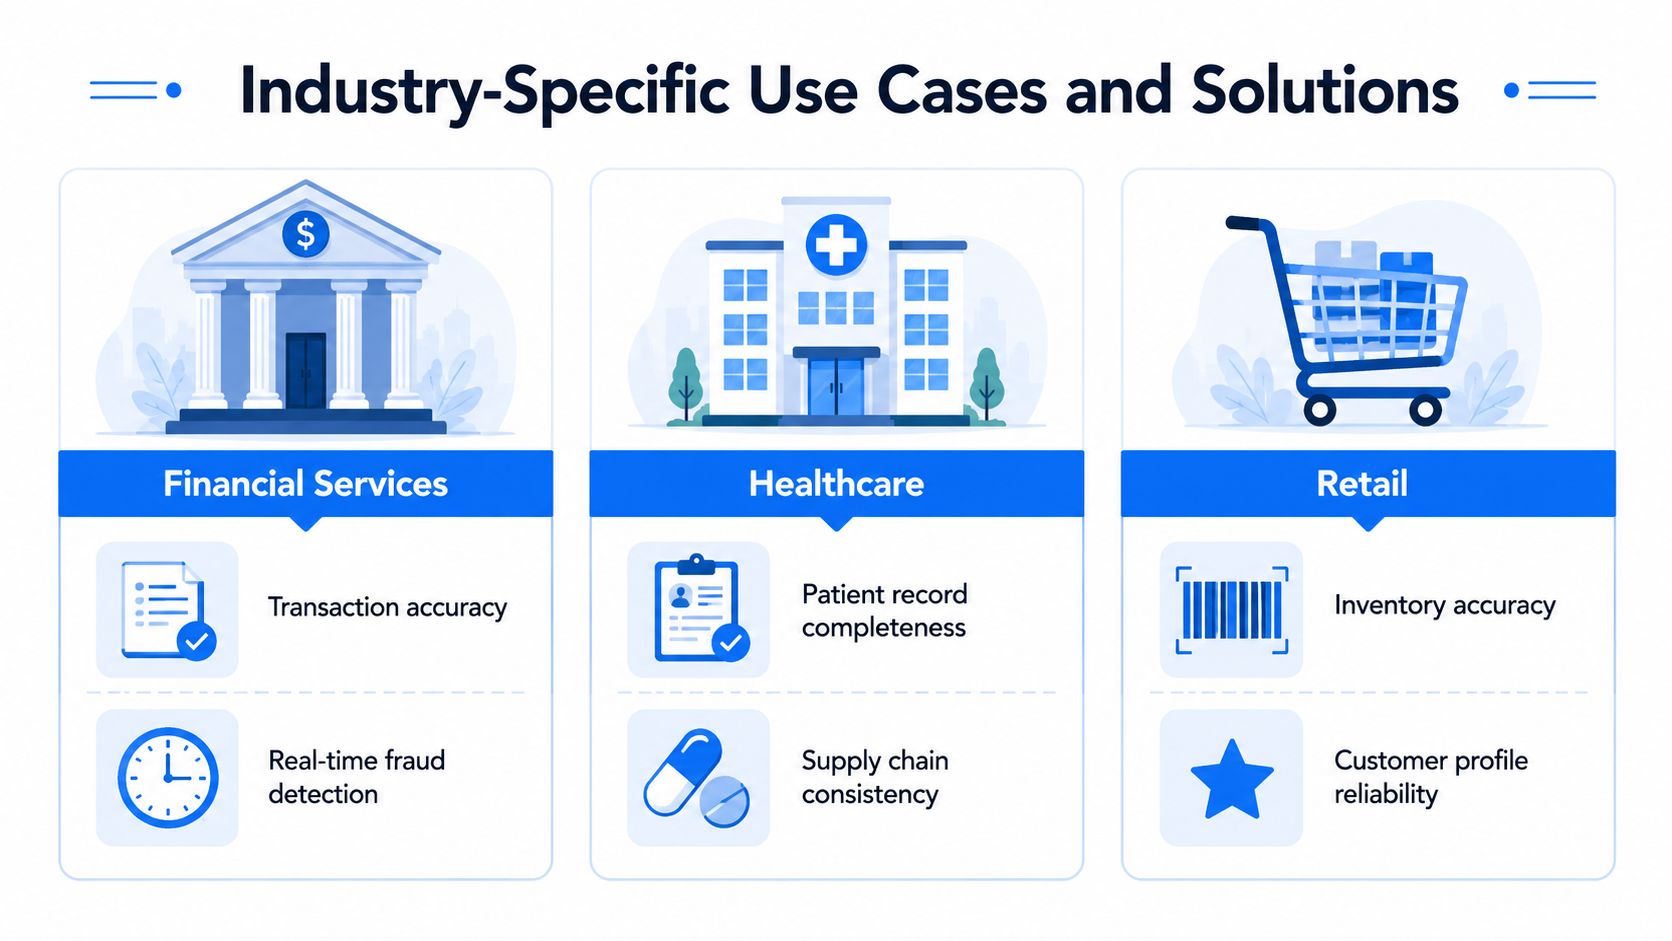
Finance needs traceability and fast exception handling
In financial services, the first requirement is usually confidence in transactional and regulatory data. One missed exception can distort risk reporting or slow an audit response. That's where record-level validation, timeliness monitoring, and schema tracking matter together, because a transaction that arrives late or changes shape at the wrong moment creates a reporting problem before anyone notices.
A modular platform such as digna can fit that environment because it monitors financial, risk, regulatory, and transactional data through validation, anomaly detection, delivery tracking, and schema change monitoring. The value is not just fewer errors. It's better traceability when a business owner asks why a figure changed.
Healthcare depends on completeness and consistency
Healthcare teams care about clinical reliability in a different way. Missing fields in patient records, inconsistent code usage, or delayed arrival of operational data can complicate care coordination and reporting. Automated monitoring helps teams spot those issues early, before downstream dashboards or operational workflows rely on bad inputs.
In regulated settings, the real cost often comes from delay. A late correction can be more expensive than a preventive check.
The same principle applies to supply chain data in healthcare, where consistency matters as much as accuracy. If product or inventory records shift unexpectedly, the issue can spread into operations quickly. Continuous quality controls reduce the chance of chasing corrections after the fact.
Telecom needs scale and stable customer records
Telecommunications teams deal with high-volume customer and operational data, which means small inconsistencies can spread quickly. A duplicate customer profile, a missing event, or a broken schema can affect reporting and service workflows at scale. The practical answer is targeted validation, anomaly detection, and availability checks that watch for degradation as it happens.
That's also where Webclaw's duplicate detection guide is a useful companion resource, because duplicate handling is one of those problems that looks minor until it starts affecting account accuracy and downstream analytics. The bigger point is that industry-specific quality controls work best when they're modular enough to match the actual risk profile of each domain.
Measuring ROI and Governance Impact
Many teams can describe data quality work. Fewer can prove it. That gap is why governance budgets get challenged. Leadership does not want a philosophy of trust. It wants evidence that the program prevented incidents, cut rework, or sped up operations.
Metric Category | Example KPI | Business Impact |
|---|---|---|
Incident reduction | Fewer data incidents per month | Less analyst interruption and fewer escalations |
Detection speed | Shorter time to detect anomalies or schema changes | Smaller blast radius and faster remediation |
Timeliness | Lower rate of delayed data arrivals | More reliable reporting and fresher decisions |
Validation coverage | Higher percentage of critical tables with automated checks | Less manual review and fewer missed issues |
Rework | Less report rebuild or reconciliation effort | Lower labor cost and faster close cycles |
Governance proof | More visible audit trails and lineage evidence | Stronger leadership confidence and compliance support |
Start with operational KPIs, not abstract scores
The strongest scorecards start with incident metrics. Count how often bad data reaches users, how long it takes to find the issue, and how long it takes to resolve it. Those are not vanity metrics. They map directly to analyst time, engineering time, and business delay.
A second layer should measure detection quality. If schema tracking catches a breaking change before it reaches downstream consumers, that is a governance win with a clear operational outcome. If anomaly detection shortens the gap between issue onset and alerting, the team reduces the blast radius. These are the controls that show whether the platform is protecting the business.
Tie metrics to rework and decision latency
Once incident metrics are visible, connect them to the work they remove. Fewer bad loads mean fewer corrected dashboards. Better timeliness means less waiting for refreshed numbers. Stronger validation means less manual sampling and less debate about whether a report is safe to use.
A practical place to ground the narrative is the data quality business case, because finance and operations leaders usually want the same thing, a credible line from control to outcome. That line is strongest when you show which controls eliminated which class of failure.
Build a scorecard leadership will actually read
Keep the scorecard small. Include only the metrics that reflect business impact, not every internal signal the platform emits. If a KPI does not change a decision, reduce a risk, or save time, it does not belong on the executive view.
Rule of thumb: if a data-quality metric cannot be tied to an incident, a process delay, or a cost bucket, it is probably too abstract for leadership reporting.
That is why the most credible programs combine technical metrics with business metrics. They do not just say the data got better. They show that incidents fell, rework dropped, and governance became easier to prove.
Common Failure Modes and Misconceptions
The worst data quality programs usually fail for predictable reasons. The first is overreliance on hand-built rules. Engineers write checks for what they know today, then the source changes tomorrow and the rule set stops covering the problem. The second is assuming data quality is a project instead of an operating discipline.
A widely cited analysis of schema drift says drift accounts for 70% of pipeline failures and that teams spend about 40% of development cycles on data-related rework when it's caught late (DataGaps). That's exactly why periodic manual checks fall short. They can confirm the last known state, but they don't protect against new structures, new values, or new timing patterns.
Why manual rules break under real workloads
Manual checks are fragile because they depend on someone anticipating the next failure. The more pipelines you have, the less realistic that becomes. If every new source requires a fresh set of bespoke validations, the team ends up maintaining checks instead of improving the platform.
A better approach is to use continuous monitoring for the unknowns and targeted validation for the known business rules. That balance is what keeps the system both flexible and auditable.
Why duplicate cleanup is not the whole answer
Duplicate detection matters, but it's only one slice of quality. If teams focus exclusively on duplicates, they can miss timeliness issues, structural changes, and inconsistent business definitions. That's why duplicate handling should sit inside a broader quality model, not act as the entire model.
When teams treat cleanup as a one-time project, the platform regresses as soon as the next feed changes. The better pattern is to assume drift will happen and monitor for it continuously. That's the only way to reduce silent failure.
Implementing a Modern Data Quality Strategy
A modern strategy starts with ownership. Someone has to own each critical dataset, each business rule, and each alert path. Without that, issues get acknowledged but never resolved. The companies that get this right don't rely on vague stewardship language. They assign responsibility at the domain level and make it visible.
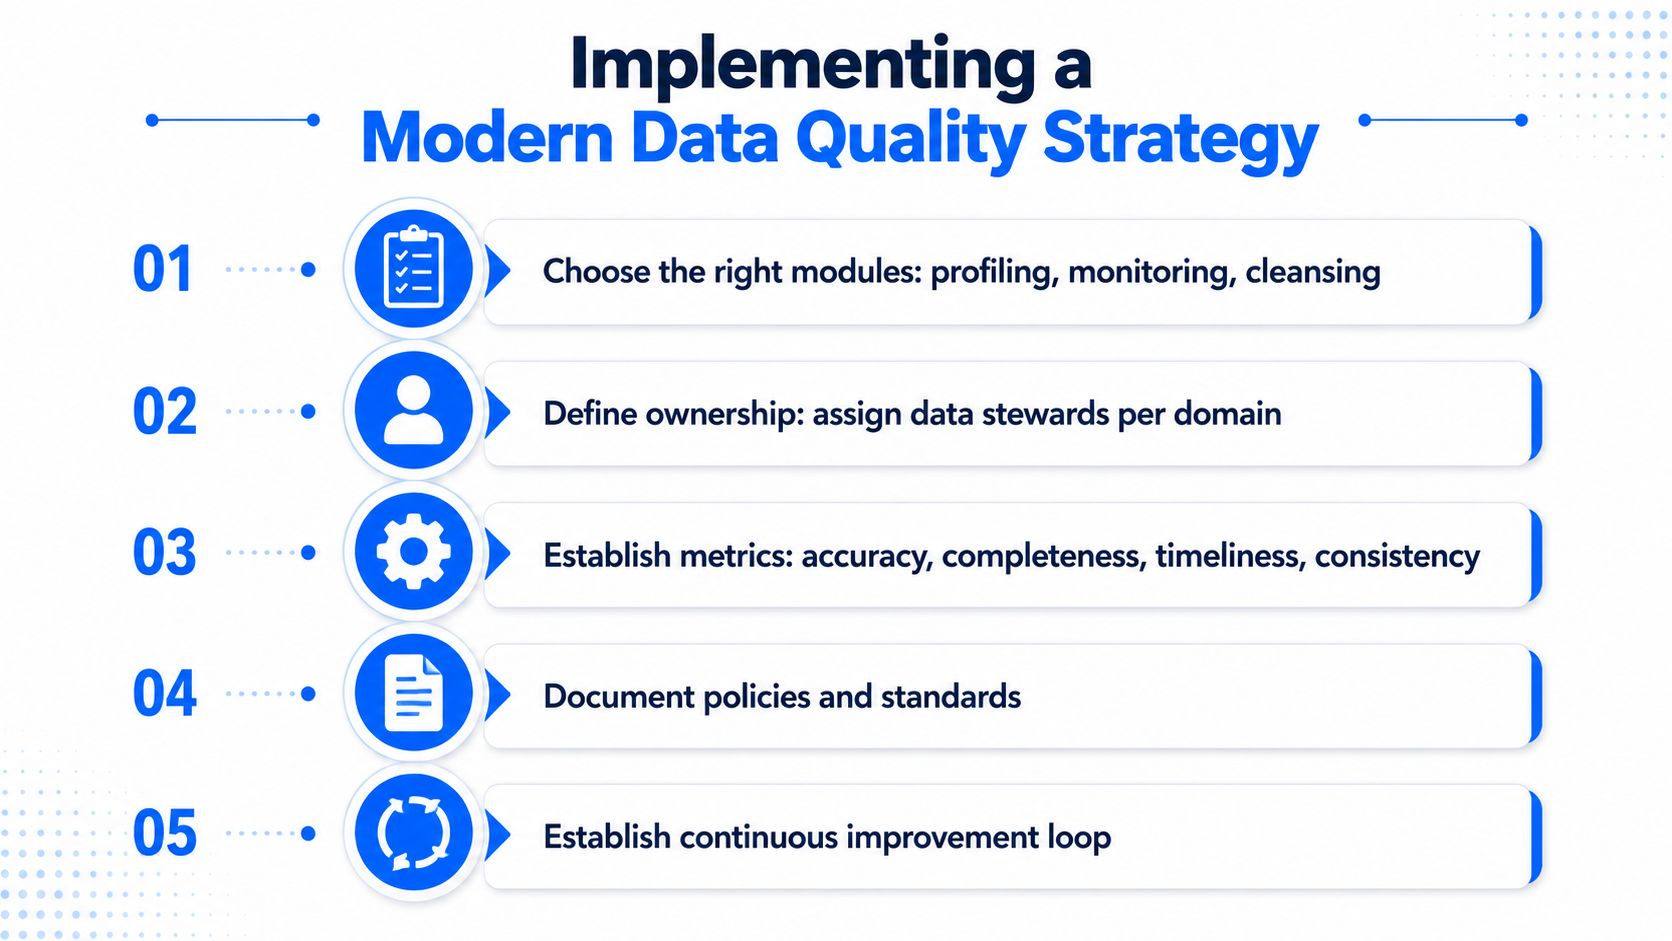
Pick the controls that match the risk
Start with profiling, anomaly detection, timeliness monitoring, schema tracking, and validation. Those five controls cover most of the failure patterns that hit production. A platform should let you begin with one module and expand as the footprint grows, rather than forcing an all-at-once deployment.
The data governance for reliable data resource is a useful companion here because governance only works when rules, ownership, and feedback loops are practical enough to run every day. That's the key filter, whether the controls fit the operating tempo.
Keep the data in place and the feedback loop tight
In-database execution matters because it reduces unnecessary movement and keeps the control layer close to the source of truth. That simplifies security and makes the process easier to scale across warehouses, lakes, and pipelines. It also shortens the path from detection to action, which is where organizations often lose time.
A solid implementation plan should include:
Define ownership clearly. Assign stewards for critical domains so alerts don't fall into a shared inbox and disappear.
Document policies and standards. Write down the rules that matter, especially for regulated or business-critical fields.
Automate feedback loops. Route incidents back to the owners who can fix upstream causes, not just the symptoms.
Measure what leadership feels. Track incident counts, detection speed, rework, and freshness, then report those numbers consistently.
Start small, then expand. Prove the model on a critical dataset before widening coverage.
Build for long-term adoption
The best data quality programs feel less like a compliance burden and more like shared infrastructure. Engineers trust them because they reduce fire drills. Analysts trust them because the numbers stop changing without explanation. Leadership trusts them because the governance story is backed by visible metrics.
A practical implementation guide is also available at data quality implementation, especially if you're trying to move from manual checks to automated observability without losing control over ownership and auditability. That's the point of a modern strategy, less cleanup, more confidence, and a quality layer that scales with the business.
If you're ready to turn data quality into a measurable control layer instead of a recurring cleanup task, visit digna and see how its in-database monitoring, validation, timeliness, and schema tracking can fit into your own stack. The fastest gains usually come from one critical dataset, one clear owner, and one automated loop that keeps bad data from reaching the business again.
Frequently asked questions
Where do data quality benefits show up first?
In rework rather than in headlines. The loss lands in missed SLA deadlines, repeated reconciliation and decisions made on stale or inconsistent inputs, long before it appears in any incident report.
How do executives now rank data quality?
IBM's 2025 report says 43% of chief operations officers rank data quality as their most significant data priority. That places it above most of the initiatives it is usually asked to support.
What are the reported losses?
Over a quarter of organizations estimate annual losses of more than USD 5 million from poor data quality, and 7% report losses of USD 25 million or more, according to the IBM Institute for Business Value.
When has a data issue already become expensive?
When it reaches an analyst, a finance owner and an engineer. At that point three people are paying attention to one defect, which is a reliable signal that the cost has moved past the data team's own time.
Why does calling quality housekeeping backfire?
Because it is the fastest way to lose trust in a data platform. Framing quality as tidying puts it in competition with feature work, and the controls that would have prevented the next incident never get funded.



