Data Quality Reliability: How Teams Actually Measure It
|
8
min read

Monday morning starts with a familiar success. The revenue dashboard loads, totals reconcile with finance, and every chart is green before the leadership review. Nobody sees that late mobile transactions are still being backfilled, a sessionization job has dropped partitions, and a renamed field is producing far more nulls than its baseline. The dashboard looks trustworthy because the visible output has rendered, not because the delivery chain has remained reliable.
That distinction matters as analytics, operations, and AI systems consume the same pipelines. Data quality reliability isn't a checklist applied to a table after the fact. It's an operating property of the entire chain, including freshness, completeness, schema behavior, validity, lineage, and governance. This guide treats reliability as a production concern and shows how to measure it without turning every release into a manual testing bottleneck.
Table of Contents
The Hidden Failure Behind Trustworthy-Looking Dashboards
Why Quality and Reliability Are Not the Same Thing
The investment mistake
The Metrics That Actually Measure Reliability
Rule-Based Checks, Statistical Checks, and AI Anomaly Detection
Stack them by certainty
Observability, In-Database Checks, and Validation Working Together
Operational Guardrails That Prevent Reliability Programs From Stalling
Route alerts to the product
Separate the service levels
Keep controls in the delivery path
What AI-Ready Data Reliability Really Requires
Follow the complete AI input chain
Putting It All Together and What Comes Next
The Hidden Failure Behind Trustworthy-Looking Dashboards
The first problem appears in the event stream. A mobile release changes how transactions are emitted, so some records arrive late rather than in the expected processing window. The ingestion job succeeds because it received data, but the data isn't complete at the moment downstream consumers read it.
Next, sessionization processes the available partitions. Three are missing, yet the transformation still produces a table. Daily row counts remain within a broad historical range because desktop traffic masks the mobile gap. The dashboard refresh completes, and its totals can still reconcile with finance if finance receives a later backfill or uses a different cutoff.
The third failure is structural. An upstream field is renamed, and the transformation preserves the column through a compatibility path. The field's null rate rises, but no alert checks the change against a known baseline. Attribution features now contain less usable information, while the churn model continues training as if the feature retained its previous meaning.
A green dashboard proves that a query ran and returned a result. It doesn't prove that the right data arrived, that every transformation behaved correctly, or that consumers received it within the required window.
This is why teams can trust the visual surface and still make unreliable decisions. A report may be numerically consistent with one reference system while remaining incomplete, stale, or semantically damaged for another use case. A model can also absorb the degradation long before anyone notices a visible reporting error.
The practical response is to monitor the delivery chain, not only the final table. A dashboard needs freshness evidence, partition completeness, schema history, lineage context, and ownership for every critical upstream asset. Teams that focus only on dashboard symptoms can learn more from data quality dashboards, but the deeper fix is to identify which control failed before the dashboard became misleading.
Why Quality and Reliability Are Not the Same Thing
Data quality describes whether data conforms to expected conditions. A value may be valid, non-null, correctly typed, within an allowed range, and linked to an existing reference record. These checks examine the contents and structure of records.
Data reliability asks whether consumers can depend on the data over time and across the delivery process. It includes quality, but also asks whether the expected data arrived, whether the pipeline made it available within its service window, whether its lineage is known, and whether changes were communicated and controlled.
The brick analogy makes the difference concrete. Quality asks whether each brick is solid and correctly shaped. Reliability asks whether the wall arrives on schedule, contains every course, has a known source, and continues to stand as conditions change.
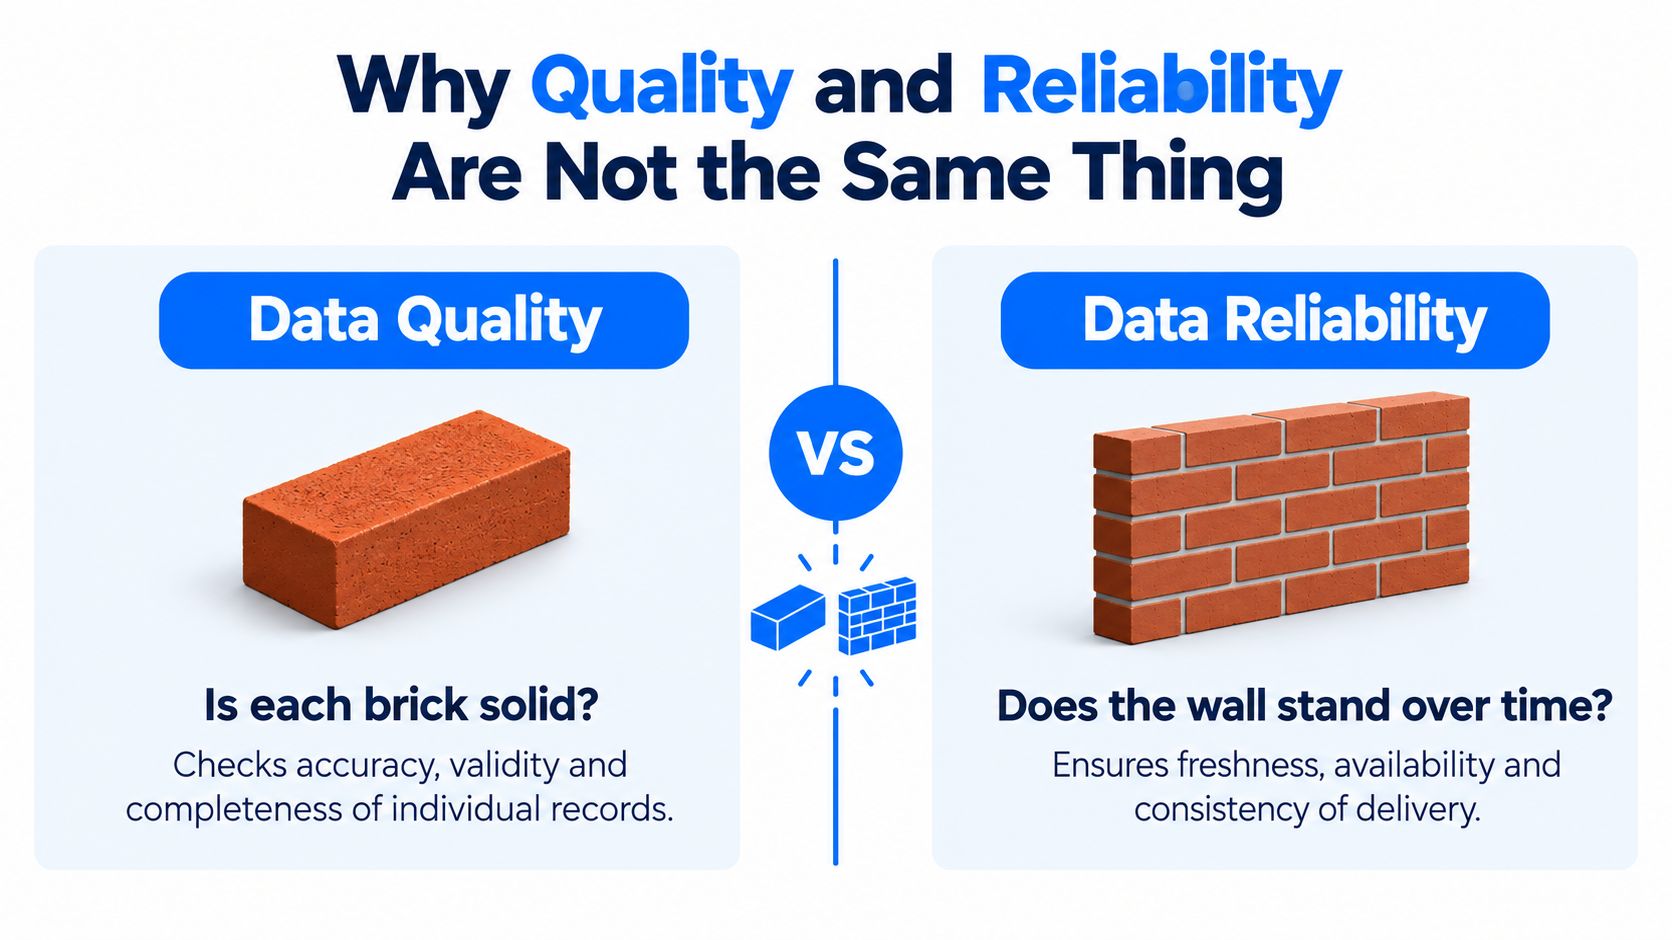
A table can pass row-level validation while failing as a dependable product. Every arrived record might have a valid customer identifier, yet an entire partition can be missing. A schema validator can confirm that a column exists, yet lineage may be broken so nobody knows which source produced it. A dataset can be accurate at rest and still be too stale for an operational decision.
The investment mistake
When teams treat quality and reliability as synonyms, they often buy or build the wrong controls. They add more null checks, type assertions, and domain rules while leaving freshness expectations undefined. They inspect values inside the warehouse but don't monitor late partitions, run duration, upstream dependencies, or downstream impact.
That creates an uneven control system. Deterministic checks protect the brick, while nobody checks whether the wall is complete or whether it arrived when the consumer needed it. The result is a large collection of passing tests attached to an unreliable product.
Reliability therefore needs end-to-end service definitions. A producer and consumer should agree on what must arrive, by when, in what shape, with which business constraints, and with what lineage evidence. Row-level quality remains essential, but it becomes one part of a delivery contract rather than the whole definition of trust.
The Metrics That Actually Measure Reliability
Production reliability becomes manageable when teams translate expectations into observable signals. Five metrics cover the main failure modes: freshness, completeness, schema stability, validity, and distribution drift. They shouldn't be treated as universal pass or fail values. Each threshold belongs in a contract that reflects the consumer's tolerance and the asset's role.
Freshness measures the gap between an event's expected availability and its actual arrival. A useful implementation compares high-watermark timestamps with a service-level window, then alerts when a partition is late or missing. Technical guidance on freshness monitoring describes this SLA-based approach, rather than treating a timestamp as sufficient evidence of health.
Completeness compares what should have arrived with what arrived. The check should operate at partition or delivery-unit level, because a complete set of rows inside an incomplete day can still produce a misleading result. An alert might fire when an expected partition is absent, or when the delivered count falls outside the agreed operating band.
Schema stability tracks additions, removals, renames, and type changes against a baseline or explicit contract. These changes can break transformations, alter meaning, or increase null rates without causing an immediate pipeline failure. Azure Databricks exposes drift fields such as count_delta, avg_delta, percent_null_delta, percent_zeros_delta, percent_distinct_delta, and non_null_columns_delta, demonstrating how teams can quantify structural and distribution changes in a comparison table. Azure Databricks documentation on drift metrics explains this output model.
Validity checks values against constraints and domain rules. They cover nullability, ranges, allowed categories, formats, uniqueness expectations, and referential integrity. A practical alert condition could be any violation of a key constraint, while softer rules can alert when the failure rate exceeds the tolerance agreed with the consumer.
Distribution drift measures movement in numeric, categorical, and null-value behavior. It catches changes that pass static rules, such as a legitimate category becoming unusually dominant or a normally populated field becoming sparse. Schema drift incidents above 5% of fields have been associated with a 30% increase in end-user-reported data quality issues, according to Integrate.io's analysis of schema-drift incidents. Use that as a risk signal, not as a universal production threshold.
Metric | What It Measures | Typical Threshold | Failure Mode Caught |
|---|---|---|---|
Freshness | Expected versus actual arrival latency | A defined SLA window, often with a warning before the hard breach | Late loads, stale dashboards, delayed features |
Completeness | Expected versus delivered records or partitions | Required partitions present and delivery volume within an agreed band | Missing slices, partial loads, dropped events |
Schema stability | Structural change from a baseline or contract | No unapproved breaking change, with review for additive changes | Renames, removals, type changes, downstream breakage |
Validity | Conformance to constraints and business rules | Critical rules must pass, with tolerated rates for non-critical rules | Invalid keys, impossible values, bad references |
Distribution drift | Statistical movement over time | Alert when movement exceeds a calibrated baseline | Population shifts, null spikes, category changes |
These metrics form a contract between producers and consumers. The useful question isn't whether a dataset has “good quality.” It's whether the delivery chain met the conditions required for a specific decision, model, or report. Teams can use a practical framework for measuring reliability to connect those conditions to asset-level monitoring.
Rule-Based Checks, Statistical Checks, and AI Anomaly Detection
No single detection method can see every failure. Rule-based checks are strongest when the expected behavior is explicit. A non-null key, an approved status value, a valid reference, or a required pattern can be expressed clearly and evaluated cheaply at ingestion or transformation boundaries.
Statistical checks solve a different problem. They establish a baseline for behavior that can't be reduced to one deterministic rule, such as row volume, average value, variance, cardinality, null proportions, or arrival timing. A rule might say that a column cannot be null, while a statistical check can notice that nulls have suddenly become common even though the column remains technically populated.
AI-learned anomaly detection adds a third layer. Models can combine several signals and identify correlated behavior that a rule author didn't anticipate. A simultaneous shift in volume, freshness, distribution, and downstream consumption may indicate a release problem even when no individual signal crosses a manually selected boundary.
Approach | Best For | Limitations | Layer |
|---|---|---|---|
Rule-based validation | Contractual guarantees and business constraints | Maintenance burden when logic changes, limited coverage of unknown behavior | Ingestion and transformation boundaries |
Statistical checks | Drift, seasonality, volume, latency, and distribution changes | Requires a useful baseline and careful false-positive calibration | Dataset and pipeline monitoring |
AI anomaly detection | Correlated and emergent risk across multiple signals | Less immediately explainable and dependent on representative history | Cross-signal observability and prioritization |
Stack them by certainty
Start with rules for conditions that must never be violated. These checks should fail loudly when a broken key or invalid reference would make the output unsafe. Put statistical monitoring around metrics that vary naturally, then tune sensitivity against incident history rather than selecting an arbitrary boundary.
AI detection earns its place when the environment has enough behavioral context to learn from. It should surface candidates for investigation, not automatically block every pipeline. Human review still belongs where the anomaly has material business impact, the baseline is changing, or the system can't explain which consumer will be affected.
The right anomaly detection approach for time-series data depends on the signal's behavior and the action attached to an alert. A noisy warning with no owner is not observability. It's another queue for engineers to ignore.
Observability, In-Database Checks, and Validation Working Together
Consider a pipeline that ingests events from Kafka, transforms them with dbt, and serves curated tables from Snowflake. Reliability improves when the team treats observability, in-database checks, and business validation as one control layer distributed across that timeline.
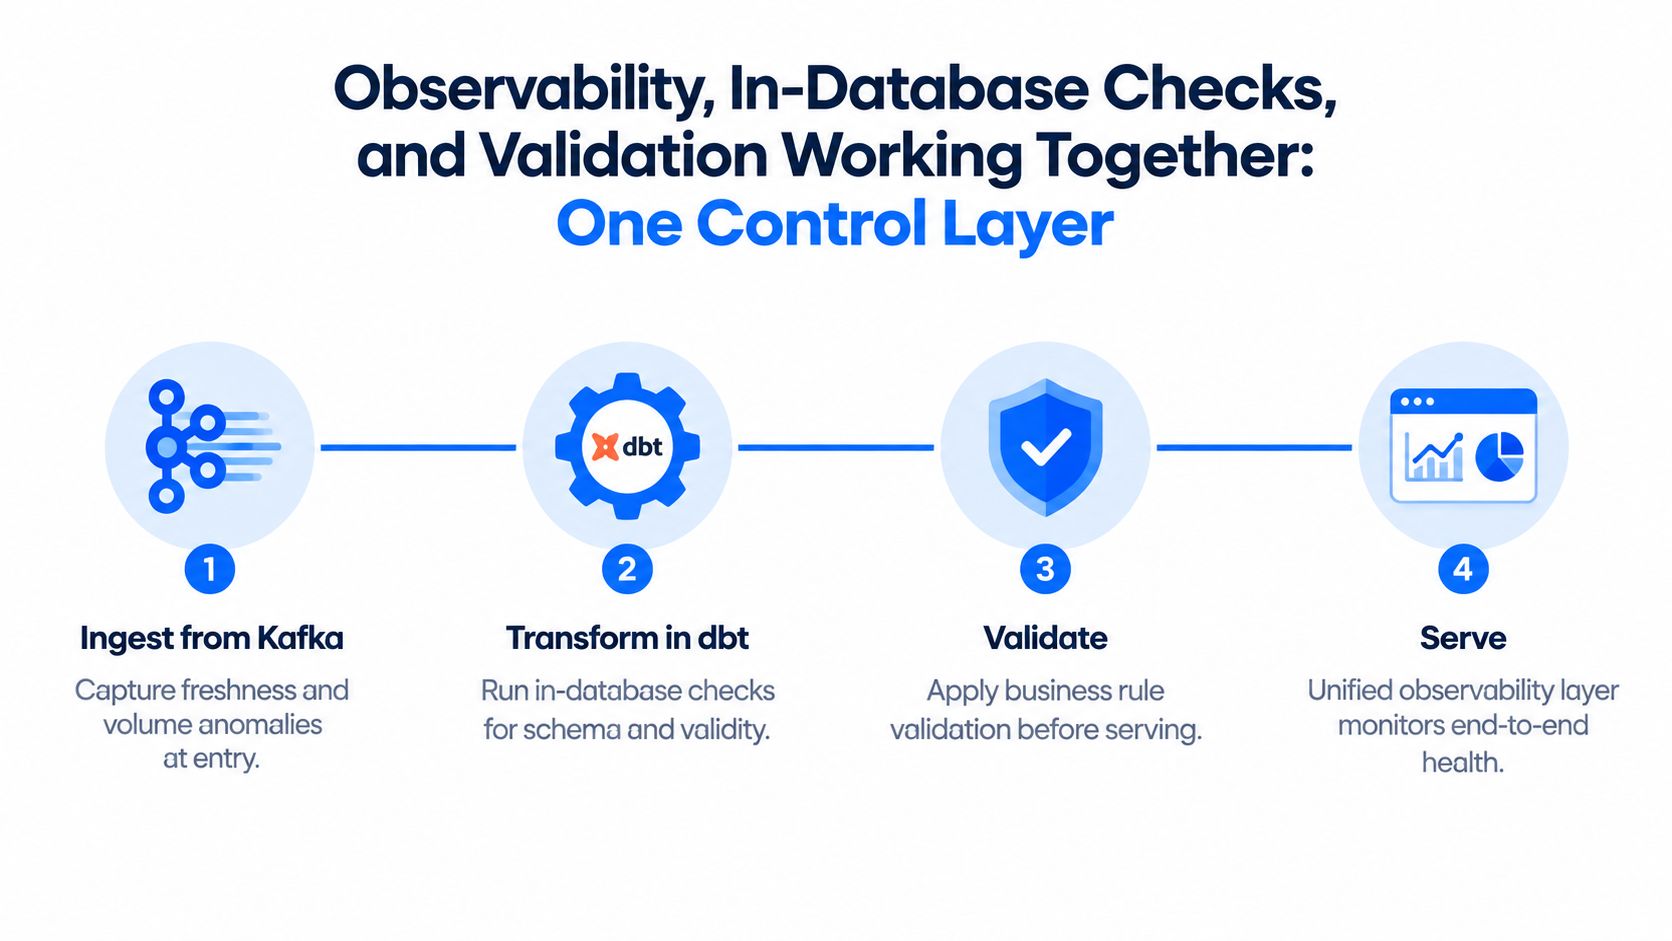
At ingestion, lightweight checks compare arrival timing and volume with the expected pattern. Warehouse-native constraints and scheduled queries can catch missing fields, unexpected types, or abnormal counts close to where the data is stored. These checks won't explain every downstream symptom, but they can stop an obvious structural problem from spreading.
During transformation, dbt tests enforce column contracts and business assumptions. Meanwhile, an observability layer watches run duration, row counts, partition health, lineage, and dependency behavior. If a model finishes successfully but produces an unexpectedly small relation, pipeline telemetry adds context that a column assertion alone can't provide.
After serving, the team compares downstream consumption with upstream expectations. A dashboard may query successfully while receiving a stale partition, so the incident timeline needs to connect the delayed Kafka arrival, the dbt run, the Snowflake table state, and the affected dashboard.
In-database checks see violations where the data lives. Validation sees whether the data obeys business meaning. Observability sees how the surrounding system behaved.
The integration point is a shared set of service-level indicators and a common incident record. Every alert should identify the asset, producer, consumer, breached condition, first observed time, and known lineage. Guidance on data validation rules and continuous data quality helps teams define the rule layer, but the operational value appears when that layer shares context with pipeline monitoring.
Without shared context, teams trade screenshots between tools and debate whether the failure belongs to Kafka, dbt, Snowflake, or the dashboard. With one timeline, they can separate the trigger from the symptom and assign remediation to the team that controls the relevant contract.
Operational Guardrails That Prevent Reliability Programs From Stalling
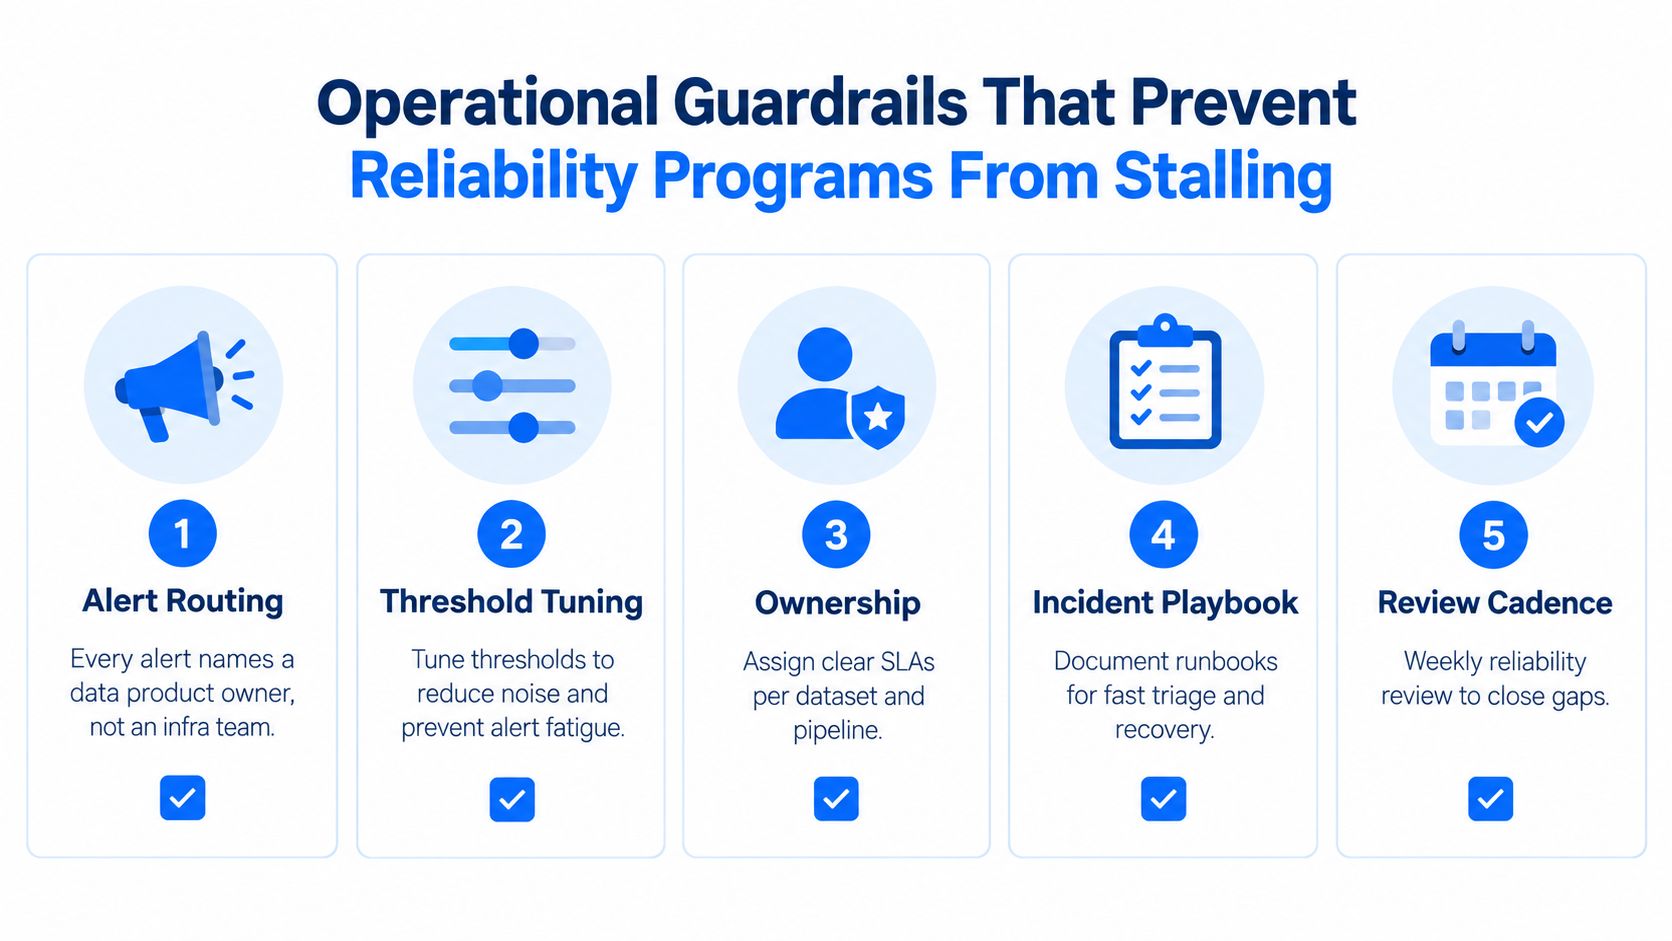
Reliability programs usually stall for organizational reasons before they fail technically. Alerts go to an infrastructure queue, dataset owners aren't named, and every team defines “healthy” differently. Guardrails make the operating model explicit.
Route alerts to the product
An alert should name the affected data product, its owner, and its downstream consumer. Infrastructure teams can own shared execution and monitoring capabilities, while embedded analytics or domain teams own the datasets whose meaning they control. Shared ownership without a primary responder usually means no one acts quickly.
Separate the service levels
Don't collapse every condition into one score or one “data quality SLA.” Define separate expectations for:
Freshness: The permitted ingestion lag, with a warning window before the hard breach.
Correctness: The required share of records passing critical validation rules.
Availability: The expected completion of scheduled pipeline runs.
Impact: The consumers and business processes affected when a breach occurs.
This separation helps teams choose the right response. A late but otherwise correct table may need backfill, while a valid-looking table with broken referential integrity may need quarantine.
Keep controls in the delivery path
Warehouse-native checks, dbt tests, schema-change gates, and contract tests prevent reliability from becoming a separate manual QA phase. AWS SageMaker's documented monitoring workflow separates data capture, baseline creation, and scheduled monitoring jobs, and its baseline uses Deequ to compute schema constraints and statistics. AWS documentation on model data quality monitoring offers a concrete example of turning expectations into scheduled production controls.
Watch for three anti-patterns:
Ownerless dashboards: A visual status page without a responder creates awareness without action.
Threshold decay: Teams gradually widen thresholds until alerts stop firing, rather than fixing the baseline or the source.
Reliability theater: Checkboxes satisfy an audit while late data, broken lineage, and unreviewed schema changes continue to affect consumers.
Review alert quality after incidents. If an alert didn't lead to a decision, change its routing, context, threshold, or action. The goal isn't maximum monitoring coverage. It's dependable detection tied to recovery.
What AI-Ready Data Reliability Really Requires
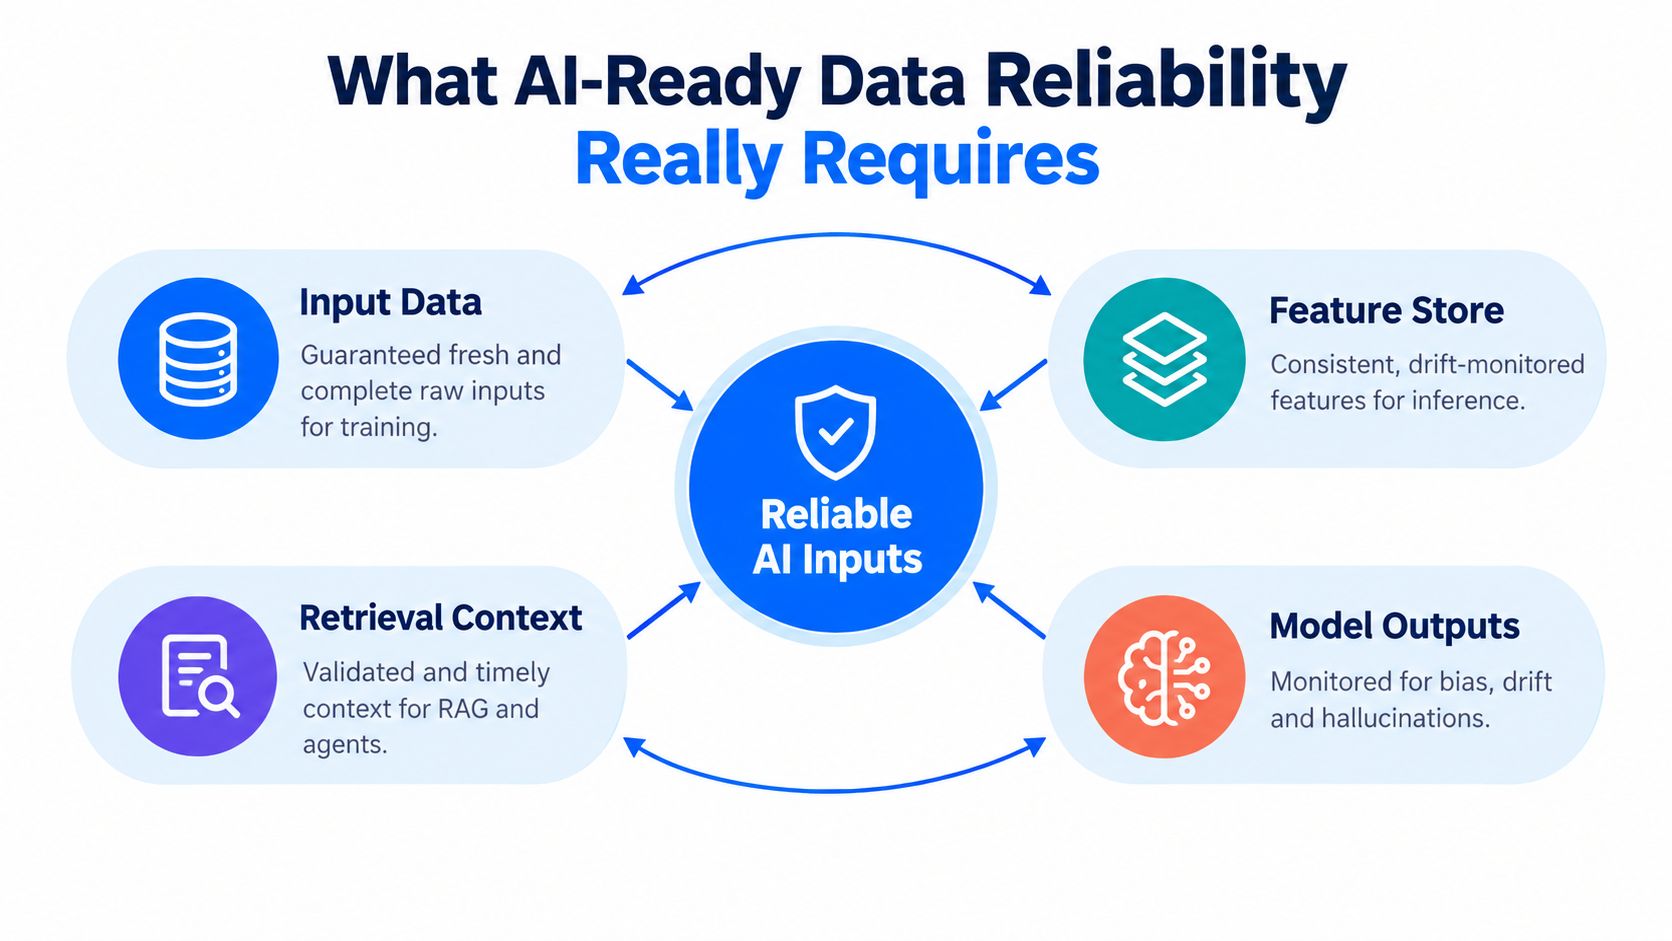
AI readiness doesn't begin when a model is deployed. It begins with evidence that the inputs, features, retrieval context, and outputs remain dependable under production conditions.
Recent reporting frames the gap clearly. 71% of data professionals identify incorrect or hallucinated outputs reaching stakeholders as a top concern, while PwC found that only 51% of respondents establish a clean, structured data foundation before scaling digital initiatives, as summarized in this reporting on AI acceleration and trust. These figures point to an operational problem, not merely a model-evaluation problem.
Follow the complete AI input chain
Raw inputs need freshness and completeness guarantees. Feature stores need consistent definitions and drift monitoring aligned with inference windows. Retrieval-augmented systems and agents need validated, timely context, including evidence that documents haven't been deleted, changed, or sourced from an unmonitored location.
Lineage must connect features and retrieval content back to their sources and transformations. Without that traceability, a model-quality regression can become an open-ended investigation. Engineers need to know whether the change came from source data, feature logic, indexing, retrieval, or the model itself.
Model outputs need their own feedback loop. Monitor bias, drift, and hallucination signals where they can be evaluated, then connect failures to upstream data conditions. Promotion gates should block or pause a release when critical input SLAs slip, rather than letting a model consume known-stale features.
ETSI's framework reflects this broader view by defining 18 measurable data-quality metrics that include reliability, coverage, lineage, traceability, and timeliness, according to the cited reporting. AI readiness therefore follows from the reliability program already protecting analytics and operations. It isn't a separate compliance exercise or a final accuracy checkbox. The principle behind the relationship between AI models and data quality is operational: unreliable inputs produce unreliable downstream behavior, even when the model itself hasn't changed.
Putting It All Together and What Comes Next
A first reliability sprint should be narrow enough to finish and important enough to matter. Choose a revenue-critical dataset, map its upstream and downstream dependencies, and define the conditions that make it safe for its primary consumer.
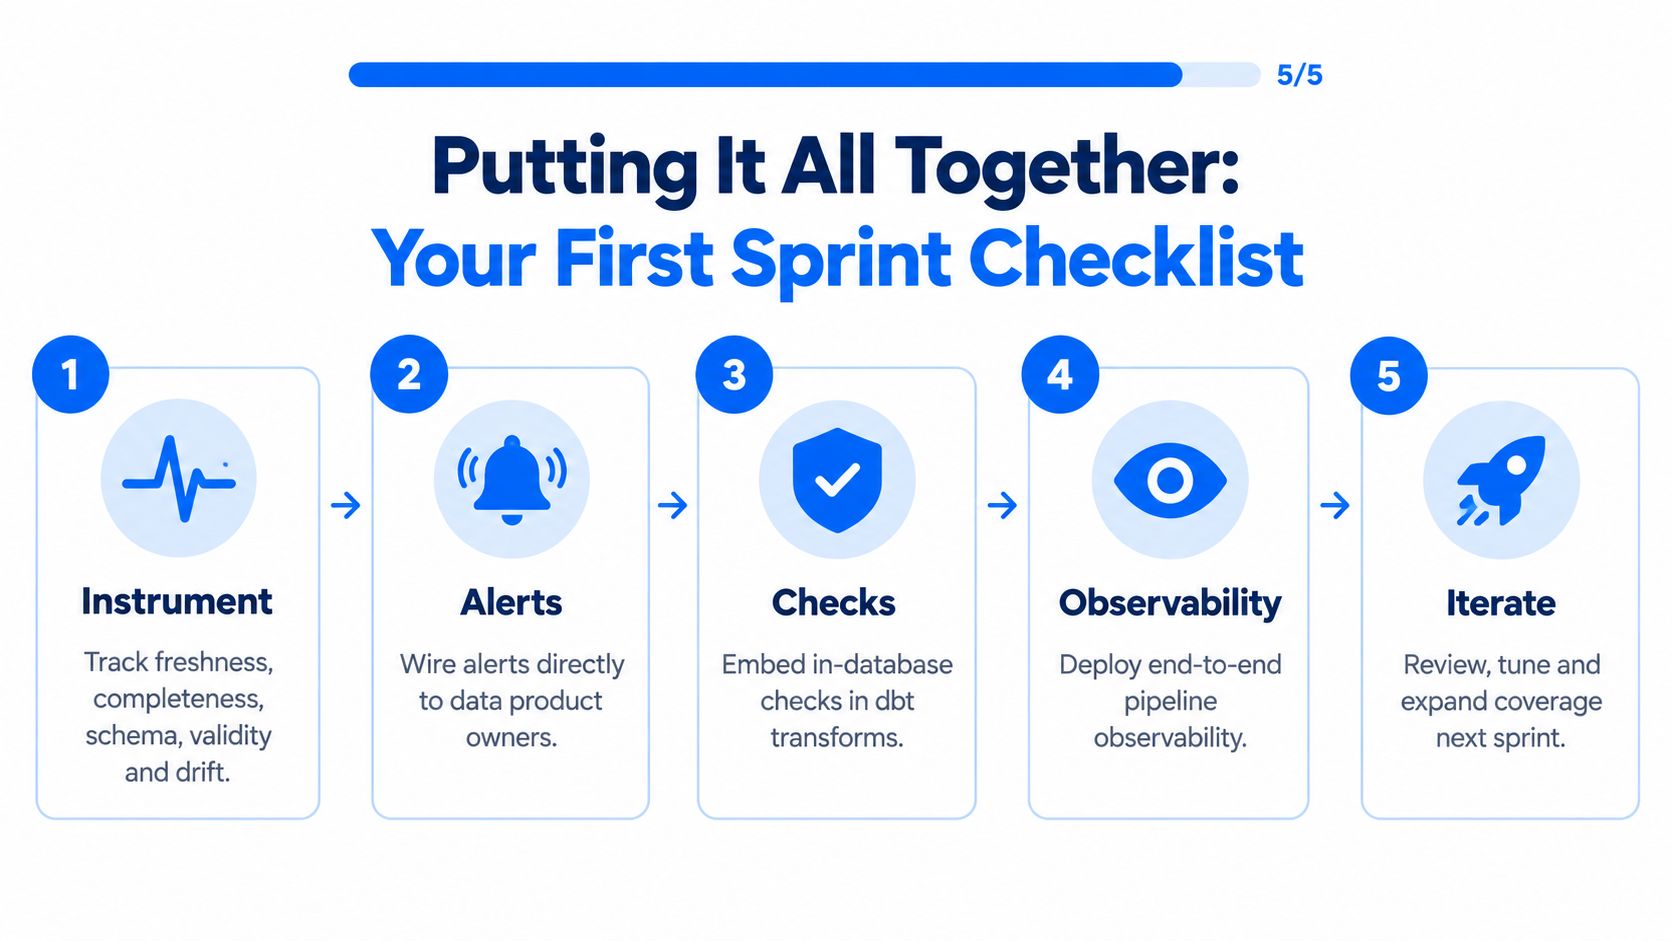
Use this sequence:
Instrument the chain: Track freshness, completeness, schema stability, validity, and distribution drift.
Assign the response: Route every alert to a named data product owner and identify the affected consumer.
Codify the contract: Document freshness, correctness, and availability expectations for the asset.
Place checks deliberately: Use deterministic rules for hard guarantees, statistical checks for drift, and learned detection for correlated anomalies.
Extend protection to AI inputs: Apply the same controls to feature data, retrieval context, and model-facing datasets.
The market is moving toward quantified assurance rather than vague trust language. The operational challenge is making those measurements usable across teams, pipelines, warehouses, and business metrics. Shared reliability scorecards and cross-team SLOs are more useful than isolated tool dashboards because they connect technical health to the decisions that depend on it.
Teams still face a manual-testing bottleneck. Surveys report that 61% rely on manual checks or SQL-based validation, while only 27% use a dedicated observability platform and 14% enforce SLAs organization-wide, according to Integrate.io's 2025 data quality and observability trends report. The practical answer is not to test everything by hand. It's to automate delivery-time evidence, give each control an owner, and treat a breach on a critical asset as a production incident.
Pick that dataset this week. Define three reliability metrics, assign one accountable owner, and review the first breach as an incident with a timeline and a remediation plan, not as an ordinary data ticket.
digna provides an enterprise data quality and observability platform that runs inside your environment, combining in-database validation, timeliness monitoring, schema tracking, and anomaly detection across warehouses, lakes, and pipelines. To connect these controls into a practical reliability program for analytics and AI, visit digna and explore the platform.
For the same controls organized by the failure each one prevents, rather than by the metric that measures it, see the eight data observability use cases and the owner and response path attached to each.
Frequently asked questions
What is the difference between data quality and data reliability?
Quality asks whether each record conforms: valid, non-null, correctly typed, within range. Reliability asks whether consumers can depend on the dataset over time, including whether the expected partitions arrived inside the service window with known lineage. The brick can be solid while the wall is missing courses.
Which metrics actually measure data reliability?
Five cover the main failure modes: freshness, completeness, schema stability, validity and distribution drift. None should be a universal pass-or-fail value. Each threshold belongs in a contract reflecting the consumer's tolerance, and completeness in particular should be checked per partition rather than per row.
When should you use anomaly detection instead of rule-based checks?
Rules fit conditions that must never be violated, such as a non-null key or a valid reference. Statistical checks handle signals that vary naturally, including volume, cardinality, null proportions and arrival timing. AI detection earns its place on correlated shifts across several signals that no rule author anticipated.
Why do data reliability programs stall?
Usually for organizational reasons before technical ones. Alerts land in an infrastructure queue with no named responder, every team defines healthy differently, and thresholds widen until nothing fires. Watch for ownerless dashboards, threshold decay, and checkboxes that satisfy an audit while consumers still receive late data.
What does AI-ready data reliability require?
Evidence along the whole input chain rather than a final accuracy check. Raw inputs need freshness and completeness guarantees, feature stores need drift monitoring aligned to inference windows, and lineage must connect features back to their sources so a model regression does not become an open-ended investigation.


