Total Data Quality Management (TDQM): A Practical Guide
|
8
min read

A quarter-end regulatory report is ready for review. Then finance notices that customer classifications are stale, analytics finds a different count in the warehouse, and the data team discovers that a source schema changed days earlier. Everyone works late to repair the report, but the CDO still faces the uncomfortable question: why wasn't the issue caught upstream?
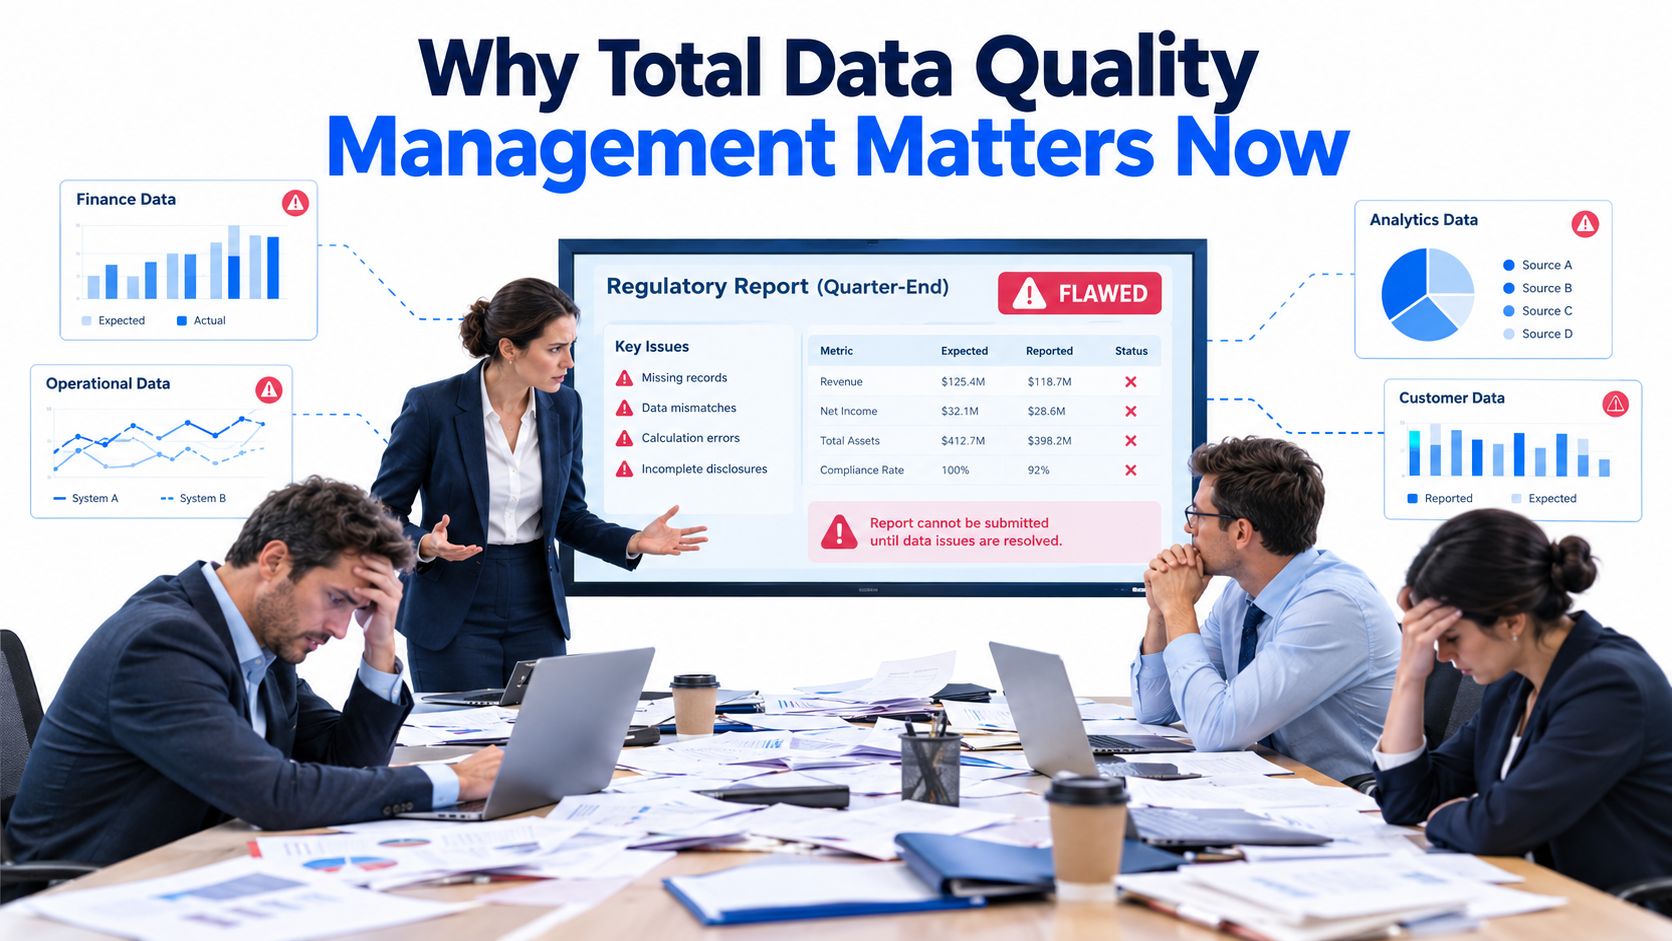
This is the problem Total Data Quality Management (TDQM) addresses. It treats data quality as an end-to-end operating discipline, connecting business requirements, engineering controls, stewardship, monitoring, and remediation. The result isn't another downstream checklist. It's a repeatable way to prevent defects, detect changes, find root causes, and improve the processes that create data.
Table of Contents
Why Total Data Quality Management Matters Now
What TDQM Actually Is and Where It Came From
The information product mindset
The Four Phases of the TDQM Lifecycle
Define
Measure
Analyze
Improve
Dimensions, KPIs, and What You Measure
From audit snapshots to operating signals
A Practical TDQM Roadmap and Common Pitfalls
Assess the current posture
Pilot one critical domain
Scale across domains
Embed quality into delivery
How Modern Platforms Bring TDQM to Life
The architecture behind the modules
What to evaluate technically
Industry-Specific Considerations Across Regulated Sectors
A Short TDQM Maturity Checklist and Where to Go Next
Why Total Data Quality Management Matters Now
Modern enterprises have more ways to create and consume data than ever. Cloud warehouses receive records from SaaS applications, operational databases, event streams, partner feeds, and internal services. Those records then support dashboards, regulatory submissions, customer operations, and AI systems.
A small defect can travel through every layer. A missing customer segment may distort a marketing audience, break a financial calculation, or cause an analytics model to interpret a record incorrectly. A late pipeline can make a dashboard appear healthy while showing yesterday's reality. The technical failure may be local, but the business impact spreads across every consumer.
The underlying cost can be substantial. Industry commentary has estimated that poor data quality may cost organizations between 20% and 35% of operating revenue, with a broader estimate of 15% to 35% for many organizations, as summarized by analysis of the cost of poor data quality. These figures shouldn't be treated as a universal finance formula. They do show why leaders need to connect quality defects with operational risk, rework, missed deadlines, and unreliable decisions.
Practical rule: If a quality issue matters to a report, process, model, or customer, assign someone responsibility for preventing it, not just someone responsibility for repairing it.
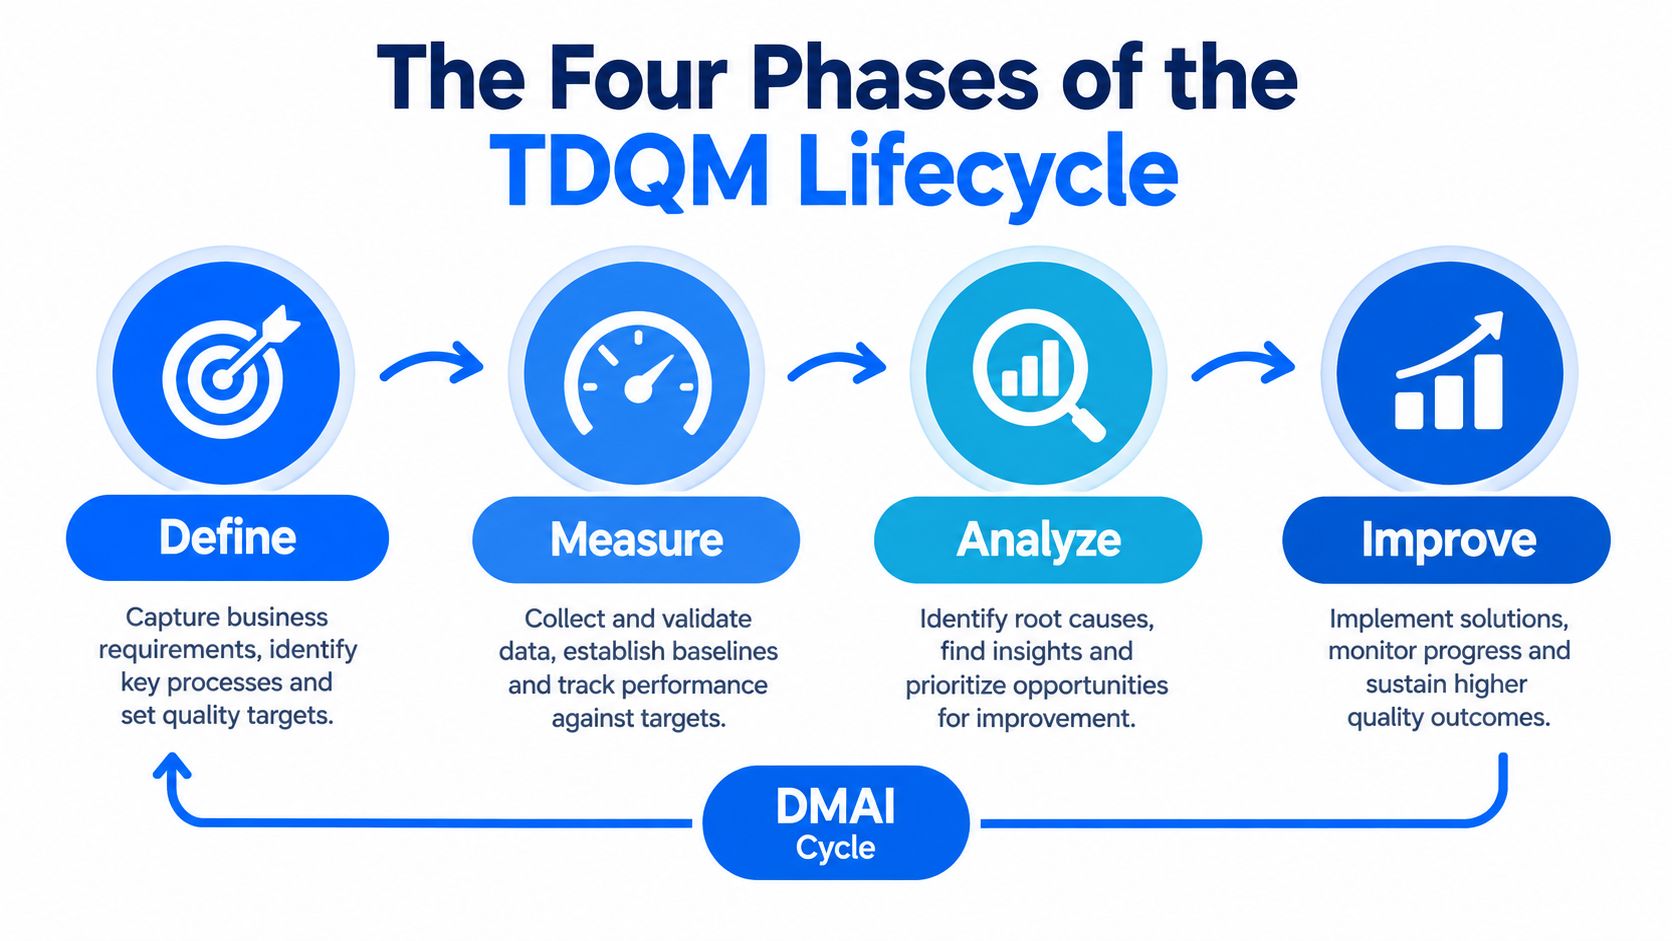
TDQM provides that structure through four connected phases: Define, Measure, Analyze, and Improve. Teams define what “fit for purpose” means, measure the relevant dimensions, analyze defects at their source, and improve both data and production processes. The cycle then starts again as requirements, systems, and consumers change.
A mature program supports fewer firefights, faster AI deployments, lower regulatory exposure, and greater trust in dashboards. Leaders looking to connect quality work to those outcomes can also review the business benefits of data quality.
What TDQM Actually Is and Where It Came From
Total Data Quality Management is an enterprise-wide discipline for planning, measuring, monitoring, and improving data quality throughout the data lifecycle. It covers creation, collection, storage, transformation, exchange, consumption, and reuse. That scope matters because a dataset can be correct at ingestion and become unreliable after a transformation, schema change, delayed load, or poorly governed handoff.
The academic foundation emerged from MIT research in 1992, when the TDQM program was formally launched to establish data quality as a distinct research area. The program grounded data quality theory in statistics, computer science, organizational behavior, accounting, and total quality management, according to the historical TDQM research record.
The information product mindset
A widely cited milestone came with Richard Wang's 1998 methodology, which framed data as the output of an information manufacturing process. That framing changed the central question from “How do we clean this file?” to “How does this process produce information, and what do its consumers require?”
An information product has consumers, owners, quality expectations, delivery conditions, and lifecycle stages. A customer master dataset, for example, may need uniqueness for marketing, accuracy for billing, and timeliness for service operations. Quality isn't absolute. It depends on the use case and the business consequence of failure.
TDQM is related to, but distinct from, adjacent disciplines:
Data governance establishes decision rights, policies, ownership, and accountability.
Master data management focuses on consistent core entities such as customers, products, and suppliers.
Data observability monitors behavior and detects incidents across pipelines and platforms.
TDQM connects these practices into a continuous quality improvement system.
The DAMA DMBOK reference is useful for placing TDQM alongside the wider data management disciplines. The important mindset shift is operational: quality isn't a project that ends after a cleansing exercise. It is a production property that must remain visible as systems and AI consumers evolve.
The Four Phases of the TDQM Lifecycle
TDQM's four phases form a loop, not a one-way project plan. Each phase produces artifacts that make the next phase more useful, and the Improve phase feeds new learning back into Define.
Define
Start with the business process, not the monitoring tool. Identify the critical data elements that support a regulatory report, pricing process, patient workflow, or model. Then document who consumes the data, what can go wrong, and what “acceptable” means for that use.
A definition package might include:
Business requirements: The decisions and processes the dataset must support.
Critical data elements: Fields and relationships that carry material business risk.
Quality model: Dimensions such as accuracy, completeness, validity, and timeliness.
Ownership model: Named data owners and technical custodians.
Quality targets: Rules, service expectations, and escalation conditions.
The output is more than a list of fields. It is a shared agreement between producers and consumers.
Measure
Measurement turns expectations into evidence. Teams profile the data, establish baselines, test business rules, monitor delivery patterns, and capture lineage context. The selected measures should reflect the requirements from Define, rather than whatever a platform happens to expose.
For a customer dataset, measurement might include required-field completeness, duplicate rates, accepted value formats, referential integrity, and arrival behavior. A scorecard should show both the result and its scope, including dataset, partition, time window, owner, and downstream dependencies.
A practical data quality implementation approach should produce a rule catalog, metric definitions, baseline scorecard, and lineage-aware monitoring plan.
Analyze
A failed check is a symptom. Analysis asks why it failed and where the defect entered the process. A null-rate increase might come from a source application change, a broken transformation, an upstream business process, or a legitimate change in customer behavior.
Root-cause analysis should combine rule violations, anomaly patterns, schema history, lineage, and ownership. The objective isn't to create a larger ticket queue. It's to distinguish isolated noise from systemic defects and assign the finding to the team that can prevent recurrence.
Improve
Improvement means fixing the process wherever possible, not repeatedly patching downstream tables. Teams may correct source validation, revise a data contract, change a transformation, add a preventive control, or update a stewardship workflow.
The remediation backlog should rank defects by business impact, affected consumers, regulatory relevance, recurrence, and repair effort. After a change, the team verifies the result, updates the standard, and returns the lesson to Define.
Dimensions, KPIs, and What You Measure
Suppose a customer identifier arrives on schedule but fails validation, appears twice, and disagrees with the billing system. A single “quality score” hides the decisions that follow. TDQM separates the problem into dimensions, then connects each dimension to an owner, a threshold, and an action.
The six core dimensions used widely in enterprise data quality are accuracy, completeness, consistency, timeliness, uniqueness, and validity. IBM describes these dimensions while noting that organizations may also need traceability, availability, reliability, precision, or relevance in its guide to data quality dimensions. A fuller data quality dimensions framework helps teams relate those labels to operational controls.
A dimension becomes useful when it supports a decision. A completeness score needs a defined set of required fields. An accuracy score needs an approved reference or verified source. Without those definitions, a dashboard can reward teams for filling irrelevant values or create confidence in data nobody has validated.
Dimension | KPI | Measurement Method | Typical Threshold |
|---|---|---|---|
Accuracy | Trusted-reference match rate | Compare selected fields with an approved reference or verified source | Set by business risk and use case |
Completeness | Required-field null rate | Count missing values among required fields | Defined per critical data element |
Consistency | Cross-system mismatch rate | Compare shared fields and relationships across systems | Escalate when mismatches affect a downstream process |
Timeliness | SLA breach count | Compare actual arrival with the agreed delivery expectation | Zero breaches for time-critical outputs where feasible |
Uniqueness | Duplicate record rate | Apply identity and key-matching rules within and across datasets | Defined according to entity and process tolerance |
Validity | Rule violation rate | Test formats, ranges, enumerations, and business constraints | Set for each rule and severity level |
From audit snapshots to operating signals
Measurement should sit near the workflow that produces or consumes the data. Pipeline observability can track schema-drift incidents, delivery delays, rule failures, and distribution changes. Governance scorecards can aggregate those signals by domain, while executives need their business meaning, such as affected reports, blocked processes, or unresolved high-risk defects.
AI-era monitoring adds another layer. A model pipeline may pass schema checks while its input distribution shifts, or produce valid outputs from stale features. TDQM therefore connects traditional rules with drift, lineage, and model-observability signals. The platform modules may differ, but the mapping remains clear: profiling and validation support the dimensions, lineage explains scope, alerting starts investigation, and scorecards support governance decisions.
Time-related quality needs precise language. A 2018 review distinguishes currency from timeliness and treats schema validation as a separate control for structural fit against a conceptual model, requirements, or source contents in its review of data quality dimensions. A dataset can arrive on schedule and still describe an earlier business state.
Start with the smallest metric set that exposes risk in one critical domain. Add a measure only when an owner can act on it. Threshold alerts should open an investigation with lineage and context, rather than merely report that a number changed.
A Practical TDQM Roadmap and Common Pitfalls
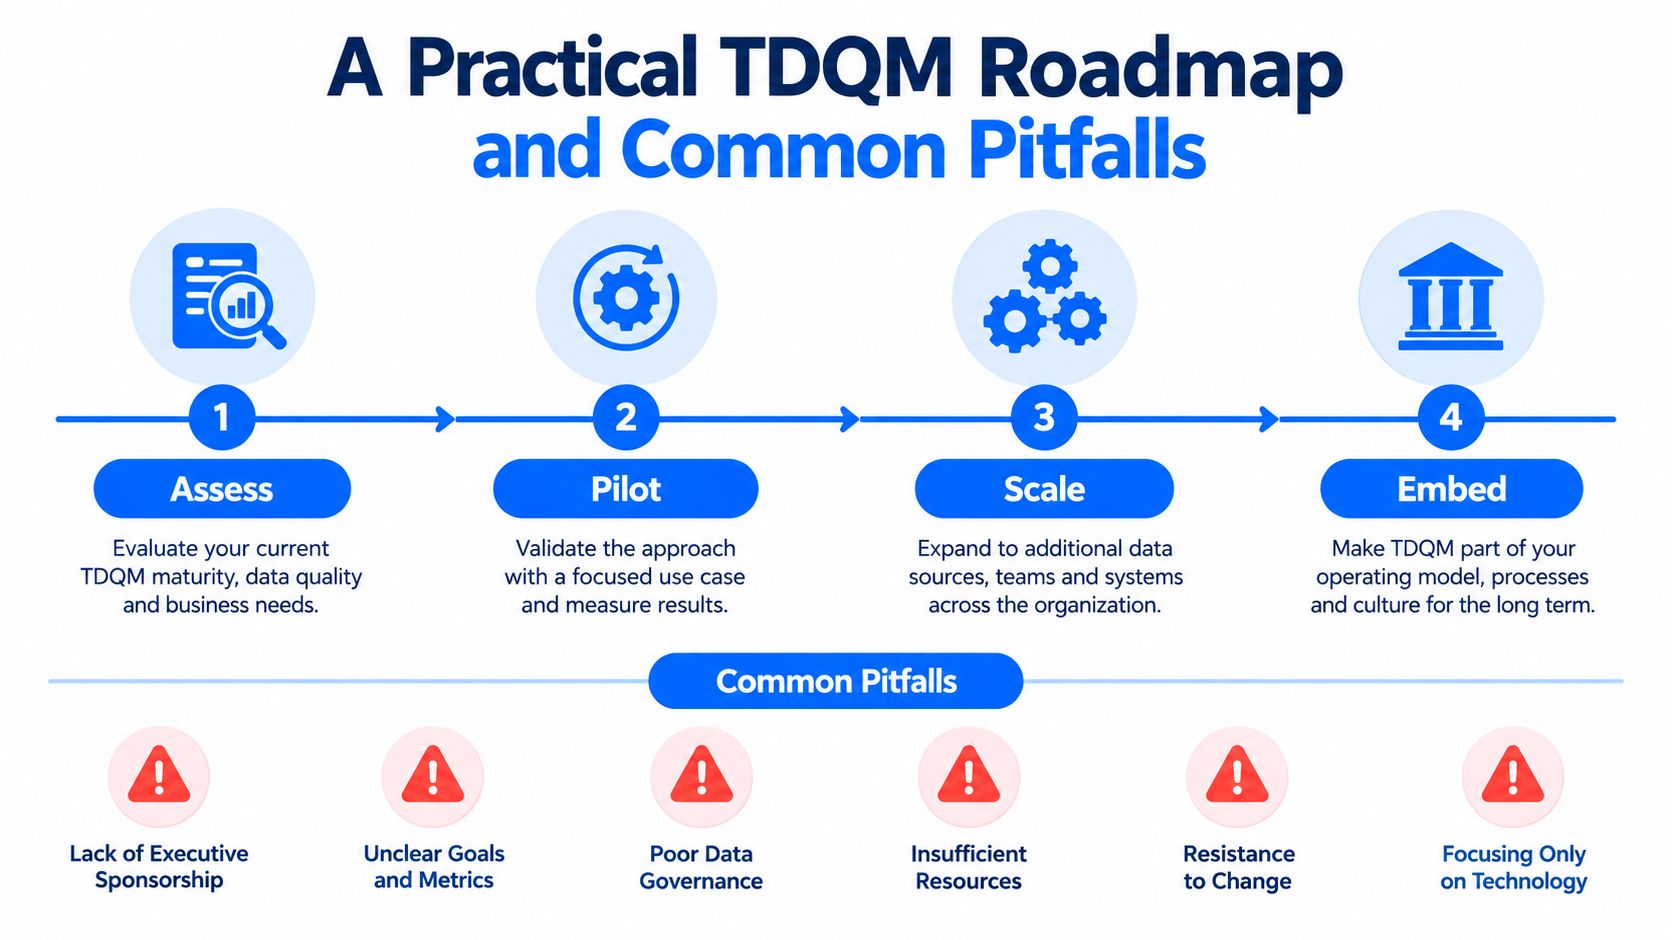
A sustainable TDQM program grows through controlled adoption. Trying to instrument every domain before proving ownership, remediation, and value usually creates a large catalog with little operational influence.
Assess the current posture
Begin with one inventory of critical datasets, consumers, owners, known incidents, existing rules, and delivery expectations. Interview finance, operations, analytics, engineering, and compliance stakeholders. The first deliverable should be a baseline scorecard that shows where quality matters and where evidence is missing.
Pilot one critical domain
Choose a domain with visible business consequences and a cooperative owner. Customer, product, transaction, or regulatory data can all work if the team can trace the flow from source to consumer.
The pilot should create:
A focused rule catalog tied to business requirements.
A remediation backlog ranked by impact and root cause.
A lineage view showing affected producers and consumers.
An escalation path with named decision-makers.
A review cadence for measuring whether fixes hold.
A pilot is successful when teams learn how to make quality decisions, not merely when they produce a green dashboard.
Scale across domains
Once the operating pattern works, create a center-of-excellence charter that defines standards, reusable controls, naming conventions, ownership expectations, and evidence requirements. Domain teams should retain responsibility for their data products, while the central function provides methods, enablement, and consistency.
Embed quality into delivery
The final step is to make quality part of normal engineering and governance workflows. Add quality gates to CI/CD where appropriate, review data contracts with producers and consumers, and require change processes to include schema, lineage, and downstream-impact checks.
A quality program becomes durable when teams can detect, explain, assign, and prevent a defect without waiting for a special project.
Common pitfalls undermine otherwise sensible programs:
One-time cleanup: A corrected table will decay if the source process remains unchanged.
Measurement without authority: A steward who can't influence the producer can only document recurring failure.
Accuracy obsession: Accurate data delivered late can still fail an operational or regulatory use case.
Missing data contracts: Producers and consumers may disagree about fields, formats, delivery timing, and acceptable change.
Weak sponsorship: Teams often deprioritize quality when leaders don't connect it to business risk.
Sustainable programs show recurring ownership reviews, shrinking remediation queues, faster detection, documented root causes, and controls that run inside ordinary delivery processes. Initiatives that lose momentum usually produce reports without changing who owns the underlying process. Guidance on structural causes is available in why data quality projects fail and the structural fixes.
How Modern Platforms Bring TDQM to Life
TDQM becomes operational when a platform connects requirements, metrics, lineage, detection, workflows, and evidence. Tool selection should therefore follow the operating model. A platform that detects anomalies but can't assign ownership may improve visibility without improving quality. A rule engine without lineage may identify a failure while leaving the team unsure where to intervene.
TDQM Pillar | Platform Module | Key Capability | Business Outcome |
|---|---|---|---|
Define | Catalog and profiling | Document critical data elements, consumers, owners, and baseline behavior | Shared quality expectations |
Measure | Timeliness and schema tracking | Monitor arrival patterns, structural changes, and measurable quality signals | Earlier detection of delivery and compatibility risk |
Analyze | Anomaly detection and analytics | Compare current behavior with historical patterns and surface unusual changes | Faster investigation and better prioritization |
Improve | Validation and workflow automation | Apply business rules, create findings, and route remediation | Fewer recurring defects |
Control | Policy and stewardship workflows | Enforce ownership, escalation, evidence, and review practices | Repeatable governance |
The architecture behind the modules
Define and Analyze benefit from statistical profiling and anomaly detection. Baseline learning can identify unusual volumes, distributions, or business metrics without requiring a rule for every possible change. Human review still matters, especially when an unusual pattern reflects a legitimate business event rather than a defect.
Measure depends on more than row counts. Schema tracking can identify added or removed columns and data type modifications. Timeliness monitoring can compare observed delivery behavior with expected schedules, while lineage shows which reports, models, and downstream tables may be affected.
Improve requires deterministic controls. Record-level validation can enforce business rules, multi-column uniqueness checks can protect entity integrity, and referential checks can identify broken relationships. Workflow automation then turns findings into assigned remediation rather than passive alerts.
What to evaluate technically
At enterprise scale, ask whether checks can execute in-database, whether push-down SQL reduces unnecessary data movement, and whether the platform handles semi-structured sources as well as relational tables. For AI use cases, test whether the system can provide context for unusual embeddings, documents, transcripts, or model-generated outputs, rather than limiting quality to tabular null and format checks.
digna is one platform option that combines in-database execution, anomaly detection, timeliness monitoring, validation, schema tracking, analytics, and stewardship-oriented workflows inside the customer's environment. Selecting such a platform is an architectural decision because it determines where evidence is produced, how data stays in place, and how teams connect quality findings to the lifecycle.
Industry-Specific Considerations Across Regulated Sectors
A quality threshold has meaning only in its operating context. The same late record may be inconvenient in one domain and operationally dangerous in another.
Industry | Top TDQM Dimensions | Representative KPI | Typical Risk Scenario |
|---|---|---|---|
Finance | Accuracy and validity | Reconciliation or rule-violation rate | An invalid or inconsistent trade attribute affects surveillance or reporting |
Healthcare | Uniqueness and consistency | Patient duplicate and cross-system mismatch rate | Duplicate records fragment a clinical history or obscure a contraindication |
Telecom | Timeliness and consistency | Late-load and reconciliation exception count | Delayed CDRs or rating mismatches create billing and revenue risk |
Public sector | Completeness and traceability | Required-field completeness and lineage coverage | An incomplete cross-agency record affects eligibility or a citizen-facing decision |
In finance, a trade surveillance feed may arrive on time but contain an invalid instrument classification. A reconciliation process can then compare records that are structurally present but semantically wrong. Accuracy and validity deserve priority, while lineage helps teams show how a reported figure was produced. Regulatory stakeholders become data consumers, not merely reviewers. Readers who need the broader meaning of what is regulatory compliance can use that legal overview as context for why evidence and control ownership matter.
Healthcare teams face a different failure pattern. A patient may appear more than once because identifiers differ across systems, while an HL7 or FHIR schema change can break an interface without immediately producing an obvious dashboard error. Uniqueness and consistency therefore carry significant weight, and the analysis must connect duplicate or mismatched records to the clinical workflow they affect.
Telecom operations depend heavily on event timing. Call detail records, roaming data, and rating inputs may arrive through multiple partner pathways. A delayed record or mismatch between a roaming partner and the rating engine can produce reconciliation exceptions or revenue leakage. Timeliness monitoring should be paired with consistency checks across the involved systems.
Public-sector programs often combine data from agencies with different definitions, ownership models, and collection practices. Incomplete records can affect eligibility, service delivery, or a citizen-facing decision. Entity resolution, master data controls, lineage, and audit trails help teams explain which information supported an outcome and where the record originated.
A Short TDQM Maturity Checklist and Where to Go Next
Use this compact model to locate your current operating level:
Level 1, Reactive: Teams cover a few dimensions, investigate after incidents, and rely on informal ownership.
Level 2, Proactive: Teams measure selected critical datasets on a recurring cadence and maintain basic rules and owners.
Level 3, Managed: Domains use scorecards, lineage, remediation workflows, quality gates, and documented standards.
Level 4, Continuous and AI-augmented: Teams combine automated monitoring, learned baselines, stewardship, and continuous controls across structured and unstructured data.
The next frontier is broader observability for documents, embeddings, transcripts, images, audio, and other non-tabular assets. Recent market analysis identifies unstructured data as a first-class criterion in 2025 data-quality evaluations, with tooling expected to profile and remediate these assets in the discussion of augmented data quality solutions. Start small: baseline one critical dataset, automate one anomaly check, and appoint one accountable domain owner.

digna helps enterprises monitor data quality and observability inside their own environment through validation, anomaly detection, timeliness monitoring, schema tracking, and in-database analysis. Visit digna to connect TDQM principles with practical controls for the datasets that support your analytics and AI systems.
For the vocabulary behind the Define and Measure phases, see what data quality management covers.
Frequently asked questions
What is total data quality management?
TDQM is an end-to-end operating discipline that treats data as a product with customers, connecting business requirements, engineering controls, stewardship, monitoring and remediation instead of bolting a cleanup step onto the end of a pipeline.
What are the four phases of the TDQM cycle?
Define, Measure, Analyze and Improve. Define states what fitness means for a given information product, Measure instruments it, Analyze finds why results deviate, and Improve changes the process rather than patching the symptom, then the cycle repeats.
What does the information product mindset mean?
It means treating a dataset like something manufactured for a customer, with specifications, a production process and an owner accountable for defects. That framing is what makes upstream prevention the default response instead of downstream correction.
Which KPIs suit a TDQM programme?
Ones that behave as operating signals rather than audit snapshots. A quarterly quality percentage tells you little; detection and resolution times, recurrence rates and the share of issues caught before a consumer reports them tell you whether the cycle is working.
Where do TDQM programmes usually go wrong?
By scaling before proving. The pattern that works is assess the current posture, pilot one critical domain, then scale across domains and embed quality into delivery. Programmes that start enterprise-wide generate findings nobody owns.


