TDWI Data Quality Framework: A Practical Guide
|
8
min read

TDWI's 2022 State of Data Quality research found that 66% of enterprises had some data quality metrics in place, but only about one in eight consistently measured and communicated those metrics through reports, dashboards, or similar channels. TDWI's research exposes the problem clearly: many organizations can detect data issues, but far fewer have turned quality into an operating discipline.
That's where the TDWI data quality framework becomes useful. It gives data governance teams a shared way to discuss ownership, controls, business impact, and tooling. It helps you connect a maturity assessment to the capabilities you need in a modern observability platform, so a score becomes a practical decision aid rather than another presentation artifact.
Table of Contents
Why Data Quality Needs a Maturity Model
What unstructured quality work costs
The Five Maturity Stages Explained
Nascent
Early
Established
Comprehensive
Advanced/Visionary
Core Dimensions the TDWI Framework Measures
Roles and Responsibility
Data Quality Management
Assurance and Impact
Tools
From Profiling to Continuous Controls
Build the loop deliberately
Combine batch and real-time controls
Mapping the Framework to Modern Observability Platforms
Match each dimension to proof
Deployment, Privacy, and Cost Considerations
Keep computation close to the data
Prefer signals with context
Turning the Assessment into a 90-Day Action Plan
Days 1 to 30 build governance
Days 31 to 60 install controls
Days 61 to 90 measure and expand
Why Data Quality Needs a Maturity Model
A data team can maintain hundreds of validation rules and still lack a dependable quality capability. Consider a retailer whose finance analysts find duplicate customer records before each monthly report. A senior analyst compares exports in a spreadsheet, chooses the records that appear trustworthy, and sends corrections to an application owner. The report is repaired, but the team still cannot explain how often the defect appears, which upstream process creates it, or whether marketing and supply-chain reporting has the same problem.
The work addresses a real error, yet it relies on personal knowledge and last-minute intervention. That distinction separates performing data cleansing from managing data quality as a capability. A mature practice makes ownership, evidence, escalation, and prevention repeatable.
TDWI's 2022 research found that 58% of enterprises with data quality metrics said those metrics didn't cover all types of data. This limitation matters because isolated checks can create false confidence. A team may measure completeness for customer data while overlooking timeliness in regulatory feeds, structural changes in warehouse tables, or duplicate products in an operational system.
What unstructured quality work costs
Without a maturity model, quality work often settles into four recurring patterns:
Manual remediation: Analysts repeatedly repair spreadsheets, extracts, and reports.
Late discovery: Regulators, executives, or customers find defects after publication.
Unclear ownership: Engineers, analysts, and business stewards debate who should correct the source.
Weak measurement: Leaders hear about incidents but cannot compare quality across domains or over time.
A maturity model gives these symptoms a shared structure. It asks where the organization stands, which practices are missing, and what capability should come next. TDWI presented the Data Quality Maturity Model as a new assessment framework in 2024, framing it as a guide for ongoing improvement rather than a one-time audit. The framework's assessment guidance covers roles, management practices, assurance, business impact, and tools.
Practical rule: A quality score matters only when it changes what the team funds, assigns, monitors, or fixes next.
The model also gives governance leads a clearer conversation with business leaders. Instead of declaring that “data quality is poor,” they can show that ownership is informal, monitoring covers selected datasets, and remediation lacks a consistent service expectation. Those findings support a focused investment plan.
The assessment works as a diagnostic lens. Observability capabilities supply operational evidence that the organization is progressing from reactive correction toward prevention and measurable control. For a broader governance comparison, teams can review digna's data governance maturity model. Used together, these perspectives help turn an abstract maturity score into questions about lineage, anomaly detection, rule coverage, incident workflow, and accountable owners.
The Five Maturity Stages Explained
TDWI's published assessment materials identify five maturity stages: Nascent, Early, Established, Comprehensive, and Advanced/Visionary. TDWI's assessment guide uses these stages to place quality practices on an ordered progression rather than treating them as pass or fail.
The labels in day-to-day conversations can vary, so teams should use TDWI's official stage names when completing the assessment. The behavioral progression is easier to understand when you focus on what people do.
Nascent
At the Nascent stage, quality work is mostly invisible until someone encounters a problem. A finance analyst manually fixes a spreadsheet, an engineer patches a pipeline, or a business user sends an urgent message to a colleague who knows the source system. Ownership belongs to whoever notices the defect, and success means the immediate deliverable goes out.
Early
An Early organization recognizes that data quality needs attention and begins documenting expectations. Teams may run periodic profiling, identify common defects, and name informal data stewards. The key change is awareness, but measurement remains inconsistent and remediation still depends heavily on individual initiative.
Established
At the Established stage, teams respond to incidents through a repeatable process. A failed uniqueness check creates a ticket, someone owns the investigation, and the team records the outcome. Success is measured through incident response, rule results, or issue closure, but controls may still focus on known problem areas rather than preventing defects across the environment.
Comprehensive
An organization shifts from reacting to preventing. Profiling, validation, lineage, and monitoring operate across important domains, while ownership and escalation paths are visible to engineering and business teams. Quality signals connect to service expectations and downstream consequences, so a delayed regulatory feed receives different attention from a low-impact internal dataset.
Advanced/Visionary
At the Advanced/Visionary stage, teams continuously tune the program. They review whether metrics still reflect business risk, remove low-value alerts, refine anomaly baselines, and use historical evidence to guide investment. A regulated bank may deliberately remain at a strong Proactive capability for a domain because its controls and audit requirements are appropriate, while a digital-native company may reach an optimizing capability with a different control design.
Stage | Typical Behavior | Ownership | Success Signal |
|---|---|---|---|
Nascent | Manual fixes after defects appear | Whoever finds the issue | The immediate task is completed |
Early | Periodic profiling and basic documentation | Informal stewards or specialists | Known defects are identified |
Established | Repeatable incident response | Named owners for remediation | Issues are tracked and resolved |
Comprehensive | Preventive controls across critical data | Embedded stewards and accountable teams | Fewer surprises and clearer impact |
Advanced/Visionary | Continuous tuning and optimization | Shared governance with active measurement | Metrics, controls, and investment improve over time |
These stages aren't badges of honor. They're signals about capability. A team can be advanced in customer identity management and nascent in platform timeliness, so assessment results should guide domain-specific action rather than produce a single organizational label. For a deeper comparison of the model and its practical use, see digna's data quality maturity model.
Core Dimensions the TDWI Framework Measures
TDWI's model examines maturity through Roles and Responsibility, Data Quality Management, Assurance and Impact, and Tools. These dimensions work like four lenses on the same operating system. A team may have capable software but unclear accountability, or strong stewardship without evidence that poor quality affects business results. The data quality dimensions explained in this guide provide useful context for separating these concerns.
Roles and Responsibility
This dimension asks who can make quality decisions and who must correct defects. At an early stage, colleagues may know a particular steward as “the person to ask,” but that expectation rests on personal reputation rather than a defined mandate.
Maturity increases when ownership is built into daily work. Critical domains have named owners, stewards know their decision rights, and teams track responsibilities with visible measures. A retailer might start with one customer-data specialist serving every department. Later, merchandising, loyalty, finance, and e-commerce can each own defined data elements, while a central governance lead coordinates shared standards.
Data Quality Management
This dimension covers the operating loop that turns defects into assigned work. TDWI's guidance includes profiling, cleansing, and ongoing maintenance, with activities such as standardization, parsing, validation, and duplicate elimination. TDWI's data quality best practices stress repeated, automated profiling because upstream processes can recreate the same defect after each correction.
A mature retailer does not remove duplicate customer records once and close the task. It profiles incoming records, standardizes formats, applies approved matching logic, assigns remediation, and checks whether the source continues producing duplicates.
Assurance and Impact
Assurance asks whether the organization can show that its controls operate as intended. Impact asks whether quality issues are connected to consequences that business and risk leaders recognize.
Those consequences may include restated reports, exposed revenue, unreliable inventory decisions, or evidence that a regulatory submission used approved data. Teams do not need to force every defect into a financial estimate. They do need a way to rank failures by downstream importance, because a missed check on a critical customer feed may matter more than a formatting issue in a low-use dataset.
Tools
Tool maturity can range from spreadsheet inspections and custom scripts to platforms that combine validation, anomaly detection, lineage, policy enforcement, and collaboration. Judge the tool by the work it supports: Can the team see what changed, identify affected consumers, assign an owner, and confirm remediation?
The platform should also connect controls to the dimensions above. A lineage view supports impact analysis, ownership metadata supports stewardship, and alert history supports assurance. TDWI's broader guidance names cleansing, matching, house-holding, de-duplication, standardization, and appending third-party data as practical quality activities. Its discussion of data quality management keeps the framework grounded in operating tasks rather than an abstract score.
From Profiling to Continuous Controls
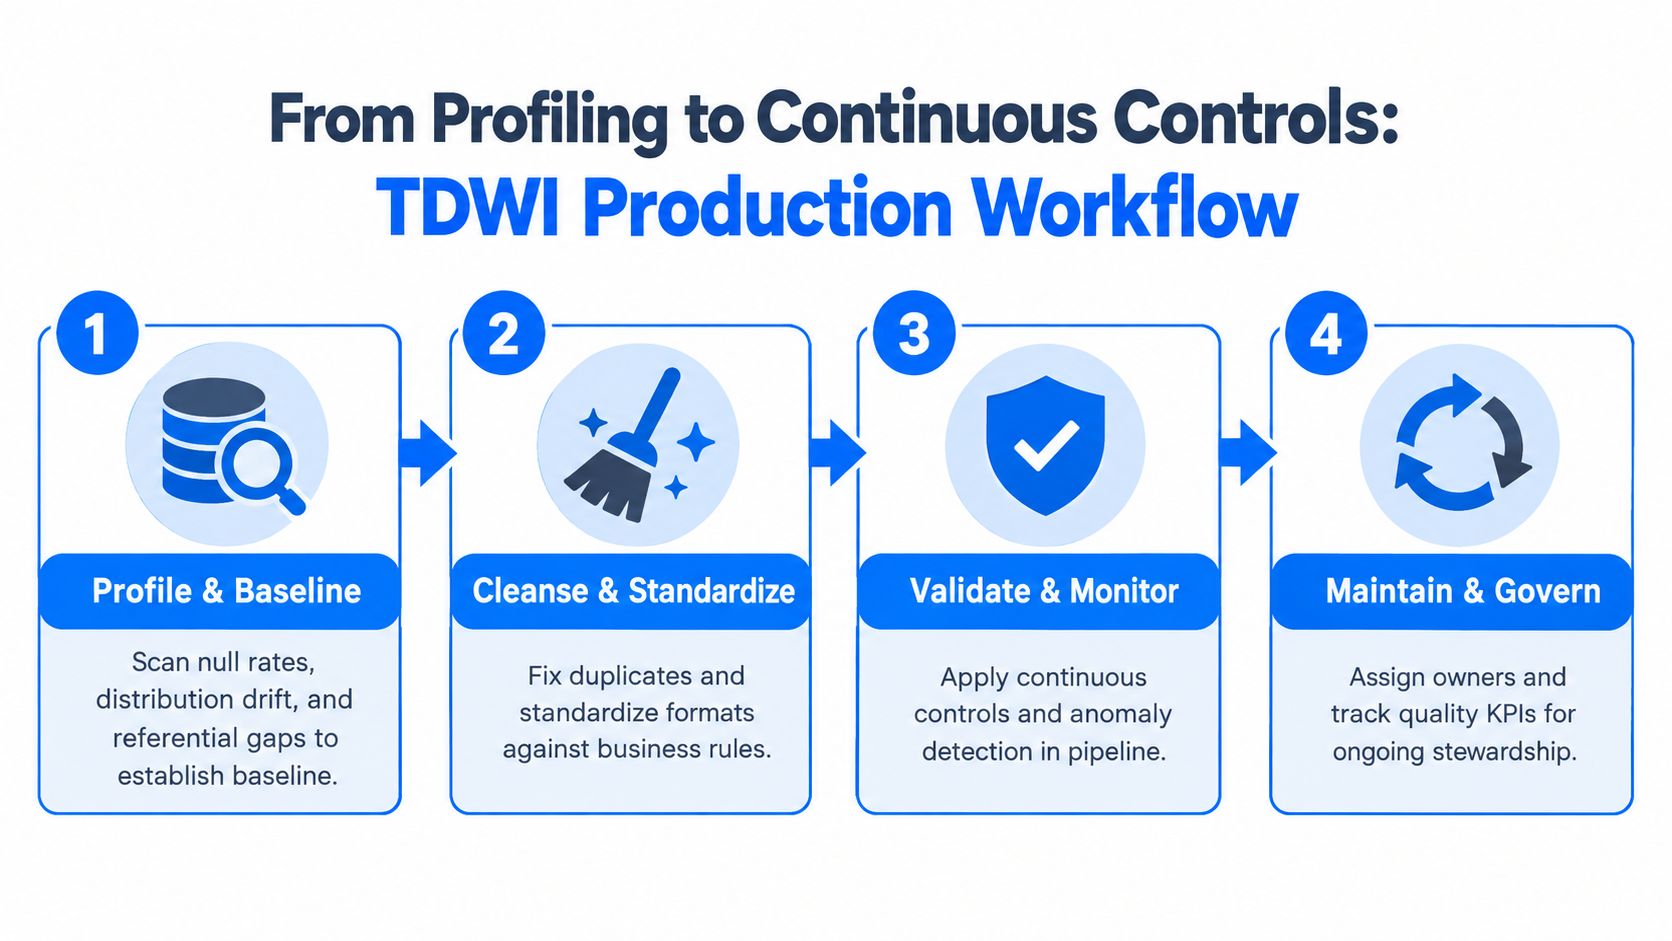
A reliable quality program begins with evidence. Choose a representative dataset and examine null patterns, value distributions, duplicate behavior, and referential relationships. These observations form a baseline for monitoring. Repeated profiling then shows whether a defect is isolated or reflects a recurring upstream process.
Build the loop deliberately
Use the findings to cleanse and standardize data against business rules. Parsing can separate combined fields, standardization can align formats, and duplicate elimination can consolidate records according to approved matching logic. A cleansing script should expose defects, not conceal them. Record the root cause and assign an owner so the source process can be corrected.
A failed uniqueness check should create a steward task with context rather than a red status alone. The task should name the affected dataset, identify the failed rule, indicate the likely source, and list downstream consumers that may require review.
Documented data profiling techniques help teams repeat this examination consistently instead of treating each investigation as a one-off exercise.
Combine batch and real-time controls
Batch checks suit large scheduled workloads and nightly transformations. Real-time validation belongs at ingestion points, where the organization can reject, quarantine, or route suspect records before they reach downstream consumers.
TDWI describes real-time validation as a “data quality firewall” and pairs continuous maintenance with both batch and real-time controls. Its guidance also emphasizes that defects often begin in upstream business processes. Downstream cleansing may repair the visible record, but it will not prevent recurrence unless the source process changes.
A firewall is valuable only when someone has defined what happens to the record after it is stopped.
This loop separates maturity stages. Occasional profiling followed by post-delivery fixes remains reactive. Repeated profiling, controls placed at the right points, assigned remediation, and review over time build preventive capability. Platforms that preserve profiles, rule results, ownership, and remediation history make that progression visible, turning the TDWI framework into an operating assessment rather than an abstract scorecard.
Mapping the Framework to Modern Observability Platforms
The framework becomes more useful when each dimension is translated into a capability you can inspect in a platform demo or internal architecture review. The question isn't whether a vendor has a long feature list. It's whether the platform produces evidence that supports ownership, management, assurance, impact, and operational control.
Match each dimension to proof
Roles and Responsibility should appear in ownership metadata, steward assignment, escalation paths, and collaboration workflows. If a platform detects an anomaly but can't show who receives it or what happens next, it supports detection without governance.
Data Quality Management maps to rule definitions, reusable rule libraries, record-level validation, profiling, anomaly detection, timeliness monitoring, and schema tracking. These capabilities should cover both deterministic expectations, such as allowed values, and behavioral changes, such as an unusual distribution shift.
Assurance and Impact depends on lineage, issue prioritization, incident history, and service-level tracking. A failed check becomes more useful when the team can identify the affected report, pipeline, or business process and document the resolution.
Tools includes the execution model and the operating interface. Look for automated validation, freshness or timeliness monitoring, schema change tracking, dashboards, integrations, and audit-ready history. A platform that runs checks inside the customer environment may also fit constraints that prevent unnecessary data movement.
TDWI Dimension | Observability Capability | Expected Evidence |
|---|---|---|
Roles and Responsibility | Ownership metadata, steward assignment, escalation workflow | Named owner, assigned incident, documented resolution |
Data Quality Management | Rule libraries, profiling, validation, anomaly detection | Baselines, rule results, recurring-defect history |
Assurance and Impact | Lineage, prioritization, SLA tracking | Affected consumers, severity rationale, response record |
Tools | Timeliness, schema tracking, dashboards, automated controls | Arrival history, structural-change log, visible quality status |
A practical audit prompt is simple: choose one critical table and ask your team to demonstrate the full path from detection to resolution. Can you show the baseline, the failed control, the owner, the affected downstream asset, the response expectation, and the evidence that the issue was fixed? If any part requires a separate spreadsheet or a personal explanation, that gap belongs in your maturity roadmap.
For implementation guidance, compare your current operating model with these data observability best practices.
Deployment, Privacy, and Cost Considerations
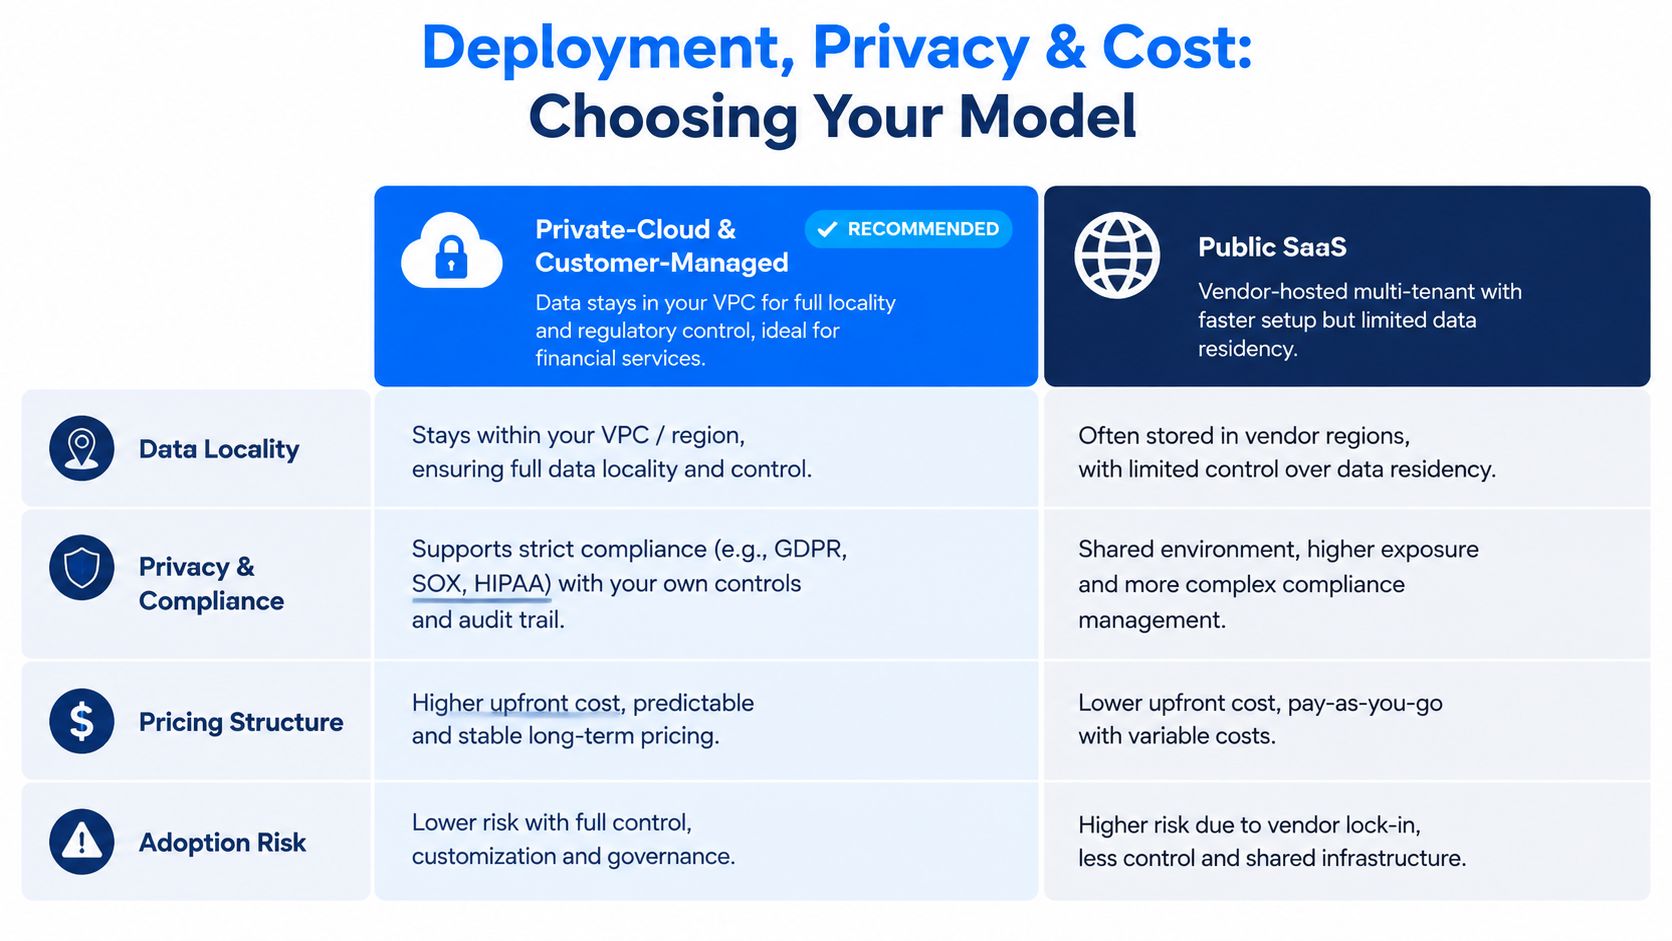
A quality platform's deployment model can determine whether regulated teams adopt it at all. In financial services, healthcare, telecom, and public-sector environments, metadata about lineage, rules, exceptions, and sensitive data domains may require the same careful treatment as the records those controls describe.
Private-cloud and customer-managed deployment keep processing inside the organization's cloud, VPC, or data center. That arrangement supports data locality, internal access controls, and audit requirements, although it places more responsibility on the customer's infrastructure and operations teams.
Keep computation close to the data
In-database execution offers a different tradeoff. Checks and metric computation run within the organization's existing database or warehouse, reducing data movement and aligning with security requirements. The customer still needs to understand the compute implications, because quality workloads use the organization's own platform resources.
A public SaaS model may provide faster initial setup, but data residency, connectivity, tenant boundaries, and security review can limit adoption. Neither model is automatically correct. The right choice depends on the sensitivity of the data, the organization's operating model, and the evidence required by auditors.
Prefer signals with context
More monitoring can create more noise. A long list of marginal checks may overwhelm engineers with alerts that lack business meaning, while a smaller set of high-context signals can focus attention on anomalies tied to critical reports, compliance obligations, or revenue processes.
Cost governance should reinforce that discipline. A usage-stable model, such as a base fee plus charges tied to active production tables and selected modules, makes teams examine what they monitor instead of accumulating dormant rules. Before selecting a platform, ask whether pricing is driven by checks that run, scans, alert volume, data movement, or monitored assets, and whether the model remains understandable as coverage expands.
Turning the Assessment into a 90-Day Action Plan
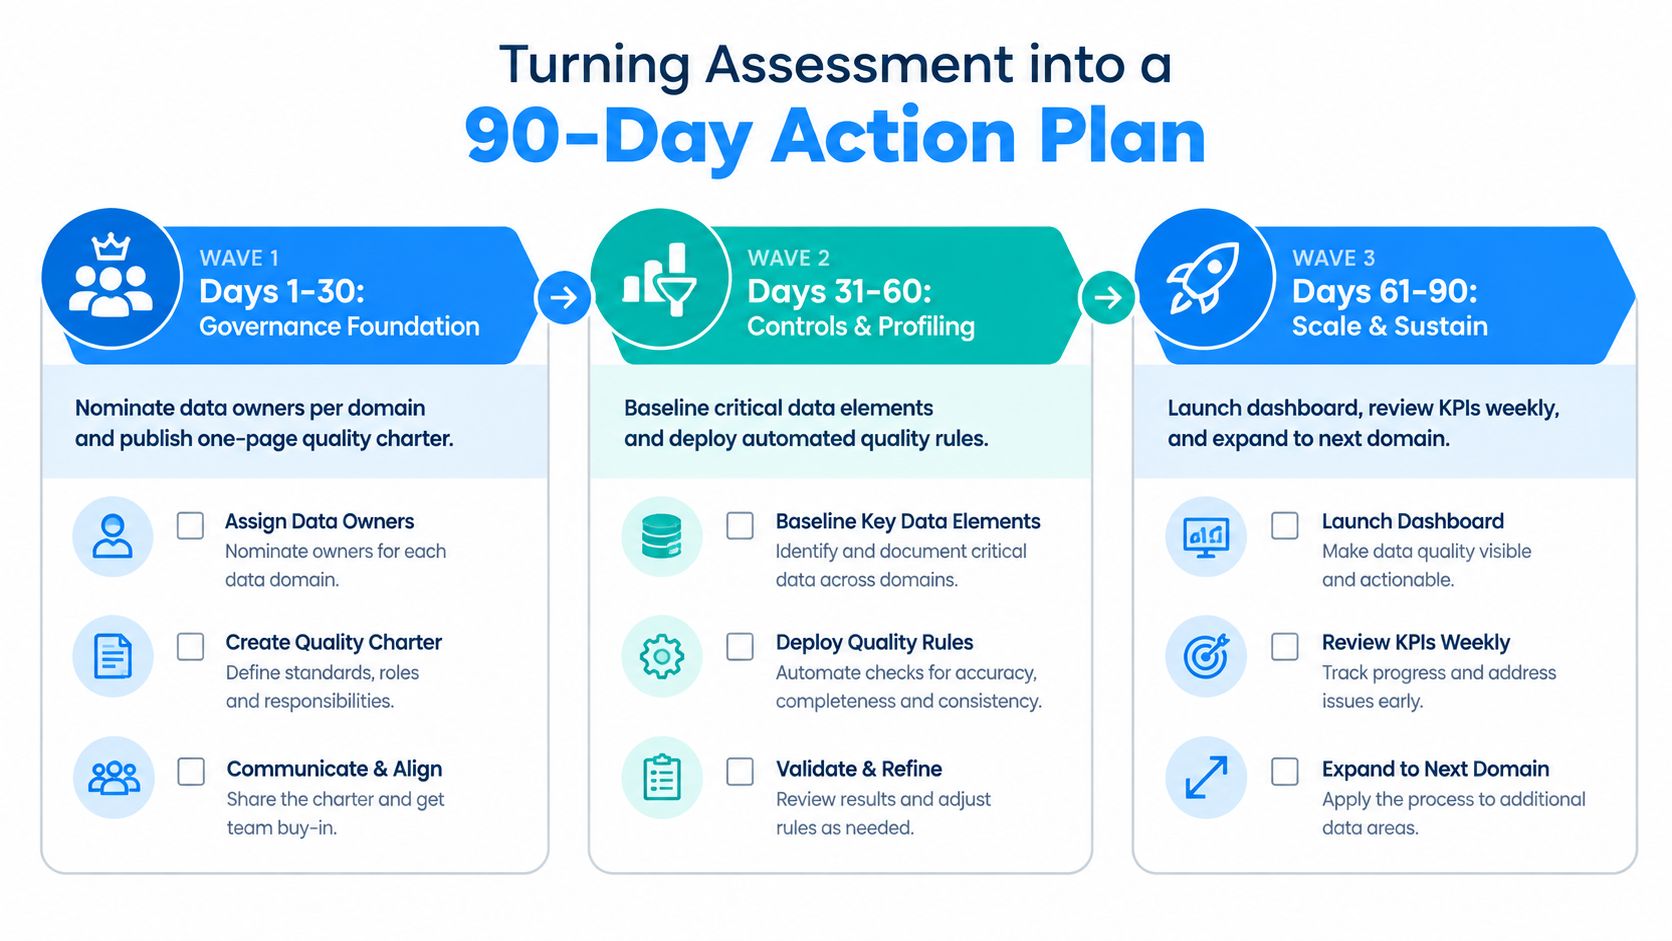
A maturity assessment becomes useful when it produces a short sequence of accountable actions. Use the results to choose one critical domain, one or two important pipelines, and a small set of metrics that represent the framework's dimensions. The aim isn't to transform the entire enterprise at once. It's to create a working pattern that can be repeated.
Days 1 to 30 build governance
Start by nominating data owners for the chosen domain. Publish a one-page quality charter that defines the data's purpose, critical elements, ownership, escalation path, and decision rights.
Baseline three to five quality metrics across the framework's dimensions, such as validation outcomes, timeliness, schema stability, issue response, or business impact. The TDWI assessment guide says the tool returns scores by dimension and for the overall data quality capability, so record both the current score and the evidence behind it.
Days 31 to 60 install controls
Deploy automated profiling on the top two pipelines. Select a gold table or similarly critical asset and place a data quality firewall before downstream consumption, with a documented action for suspect records.
Connect anomaly detection to a high-value dashboard and require someone to review the resulting signals. The goal is not to generate every possible alert. It's to learn whether the team can distinguish a meaningful change from normal variation, assign the right owner, and close the loop.
Days 61 to 90 measure and expand
Re-score the organization against the five-stage model and document what changed in practice. Record new ownership, active controls, reviewed incidents, and unresolved gaps, then extend the pattern to the next domain.
Use this checklist before the quarter ends:
Charter drafted: The domain's purpose, rules, and escalation path are documented.
Owners assigned: Business and technical responsibilities are named.
Metrics baselined: Selected measures have a known starting point.
Profiling live: Automated profiling runs on the priority pipelines.
Firewall triggered: The team has tested the handling of suspect records.
Anomalies reviewed: Owners have investigated and classified signals.
Reassessment scheduled: A date exists for the next maturity review.
Roadmap refreshed: The next domain and investment decisions are recorded.
Schedule a quarterly review so quality practices don't regress when a key steward changes roles. TDWI's model is designed to show where an organization has been, where it is, and where it still needs to go, which makes reassessment part of the operating rhythm rather than an occasional diagnostic exercise.
digna offers an in-environment data quality and observability platform with anomaly detection, timeliness monitoring, schema tracking, and in-database validation for teams applying the TDWI framework. Visit digna to evaluate how its capabilities could support your next maturity assessment and 90-day quality plan.
The dimensions this framework scores are covered in more depth in the dimensions of data quality.
Frequently asked questions
What is the TDWI data quality framework?
It is a maturity model that scores a data quality programme across defined stages and dimensions, giving governance teams a shared way to discuss ownership, controls, business impact and tooling rather than arguing from impressions.
What are the five TDWI maturity stages?
Nascent, Early, Established, Comprehensive and Advanced or Visionary. The progression is about whether quality work is ad hoc or operationalised — measured, communicated and acted on — not about how many checks exist.
Which dimensions does the TDWI framework measure?
Four: roles and responsibility, data quality management, assurance and impact, and tools. Assessing them separately exposes the common failure where tooling is advanced but ownership is not, which no single score would reveal.
Why do most organisations stall on measurement?
TDWI's 2022 research found 66% of enterprises had quality metrics, but only about one in eight consistently measured and communicated them. Detecting issues is the easy half; turning that detection into a reported, owned operating signal is where programmes stall.
How do you turn a TDWI assessment into action?
Work in 90 days: establish governance and ownership in the first thirty, install controls in the next thirty, then measure and expand. Starting with tooling before ownership produces alerts that reach nobody with the authority to act.


