Data Quality Maturity Model: A Practical Guide for 2026
|
6
min read

Your team probably knows the pattern. A dashboard breaks just before an executive review. A KPI shifts, nobody can explain why, and the data team spends the day tracing joins, refresh schedules, and source tables instead of shipping useful work. A machine learning feature goes live, then someone notices the input data changed shape two days ago. Trust drops faster than the issue gets resolved.
This usually isn't a tooling failure by itself. It's a maturity problem. Teams often have smart engineers, strong analysts, and expensive platforms, but no shared operating model for what “good data” means, how it gets measured, and who acts when quality degrades. That's why a data quality maturity model matters. It gives Heads of Data a way to move from scattered fixes to a system that improves reliability, accountability, and business confidence over time.
Table of Contents
The Hidden Costs of Immature Data Practices
The visible problem is the broken dashboard. The expensive problem is everything that follows.
When data practices are immature, teams work in a constant reactive loop. Analysts maintain side spreadsheets to “correct” trusted numbers. Engineers add one-off checks that only make sense to the person who wrote them. Business teams stop asking whether a metric is useful and start asking whether it's safe to believe at all. That shift is where data programs lose momentum.
In a survey of 196 organizations, 91% had not yet reached a transformational level of maturity in data and information, which shows how common reactive and limited-scope practices still are, according to Intelligent Data Strategies on the data quality maturity curve. So if your organization still treats data quality as a sequence of incidents, you're not dealing with an unusual failure. You're looking at a very common operating state.
What immaturity looks like in practice
A Head of Data usually sees the same symptoms repeat:
Reports are technically available but socially distrusted. Teams consume them, then verify them manually before acting.
Data defects surface downstream. Sales spots a bad number after the board pack is built, not when the source changed.
Ownership is blurred. Governance says quality matters, engineering says the business should define rules, and operations assumes somebody else is watching.
Improvement work never gets funded. Firefighting always feels more urgent than prevention.
Practical rule: If your team spends more time explaining exceptions than improving controls, maturity is lower than your dashboards suggest.
Why this hurts business outcomes
Immature data practices slow decisions. They also distort priorities. Leaders fund more reporting, more reconciliation, and more manual review because they can see those costs, while the root issue remains untouched.
The data quality maturity model is useful because it reframes the conversation. Instead of asking, “Why did this incident happen again?” you ask, “What capabilities are missing that make this incident predictable?” That's a much better question for budget, staffing, governance, and platform design.
Understanding the Data Quality Maturity Model
A Head of Data usually meets the maturity model after a familiar meeting. Finance questions a KPI that looked stable last month. Operations says the source changed. Engineering says no rule was defined. Governance points to a policy nobody used in production. The model matters because it turns that argument into an operating diagnosis.
A data quality maturity model gives you a structured way to assess how well quality is managed across the organization, and what capability should come next. Used properly, it helps you avoid two common mistakes. Teams either treat quality as a series of one-off fixes, or they launch an enterprise program that is far broader than their current operating discipline can support.
Why the model works in practice
The value of the model is sequencing.
If the organization is still finding defects through escalations and spreadsheet checks, the priority is repeatable controls on critical data. If different domains already run local checks, the priority is standard definitions, ownership, and workflows. If those standards exist, the next question is whether teams can measure performance, prove compliance, and improve based on evidence rather than opinion.
That progression sounds obvious, but many data teams skip steps. They buy tooling built for advanced monitoring before they have agreed thresholds. They publish governance standards before data owners have accepted remediation duties. They stand up scorecards before anyone trusts the underlying rules. A maturity model helps prevent that kind of overreach.
It also creates a practical bridge between theory and implementation. In real programs, each stage should map to capabilities you can turn on, govern, and measure in a platform such as digna. Otherwise the model stays abstract. The point is not to label the organization. The point is to decide which controls, workflows, and accountabilities need to exist in production.
What a maturity model should assess
Strong models look beyond policy statements. They test whether quality is defined, measured, owned, and acted on in day-to-day operations.
The Enterprise Data Quality Management Maturity Model, for example, uses a hierarchical assessment structure with defined practices and measures, supported by surveys, interviews, document review, and analysis of quality metrics, as described in the EMISA Journal paper on enterprise data quality maturity assessment. That is a useful standard because it treats maturity as observable behavior, not presentation material.
In practice, a credible assessment should show:
How quality is defined for business-critical data products and domains
Who owns thresholds, exceptions, and remediation decisions
What evidence exists, including rules, metadata, incidents, and performance metrics
How issues move from detection to resolution through a repeatable workflow
Which capabilities are missing and should be prioritized next
A maturity assessment should reward operating discipline, not documentation volume.
The best models also create a common language across business and technical teams. Data engineers can tie incidents to failed controls. Business leaders can tie the same failure to decision risk, reporting delay, customer impact, or compliance exposure. That shared view is where implementation gets easier. It becomes much simpler to justify a rule engine, ownership workflow, or monitoring layer when everyone can see which maturity gap it closes.
The Five Stages of Data Quality Maturity
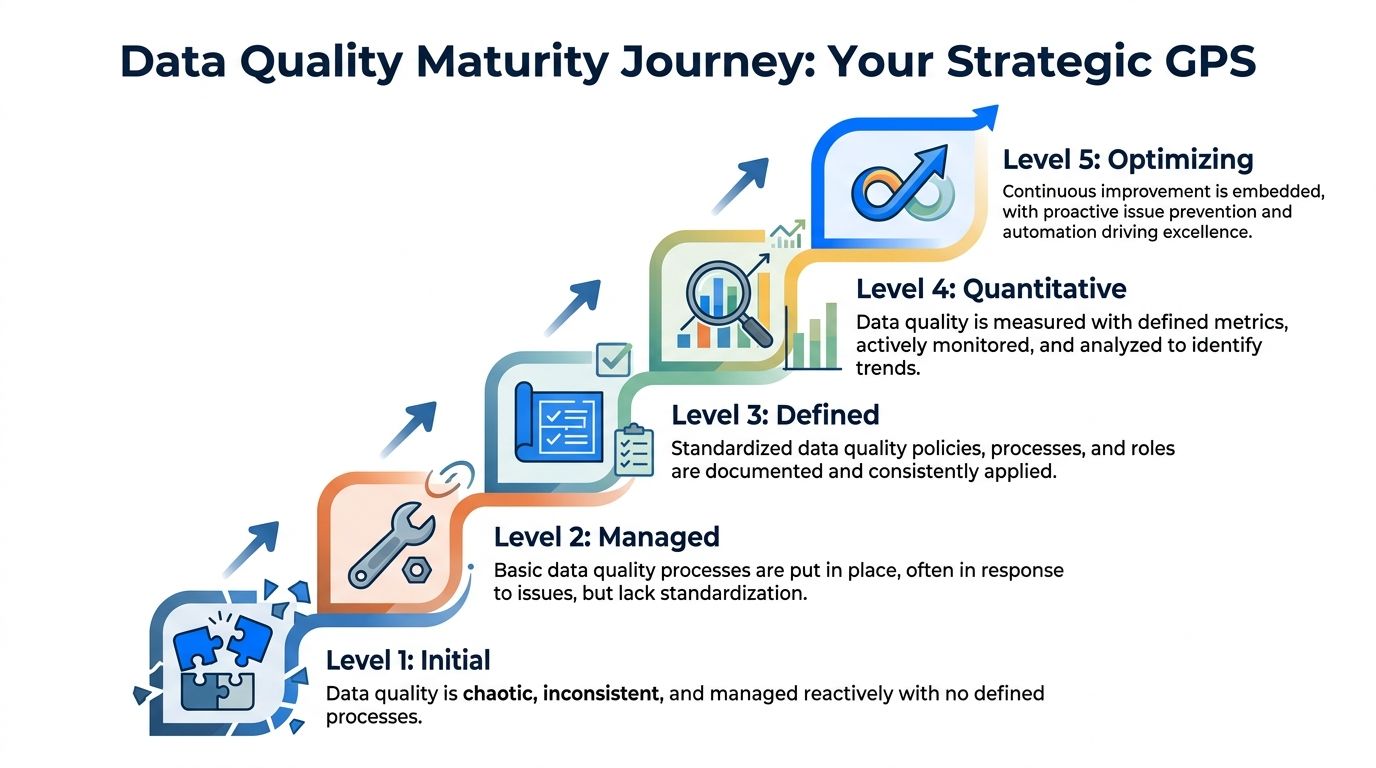
Most modern maturity models still follow the five-level structure established by the foundational Capability Maturity Model: Initial, Repeatable, Defined, Managed, and Optimized, each representing a different degree of discipline, measurement, and automation, as outlined by NESTcc's summary of maturity model stages.
How maturity changes the business conversation
At lower stages, the business asks, “Can I trust this number right now?”
At higher stages, it asks, “How quickly can we use this data to improve performance?”
That's the shift you want. Quality maturity isn't about perfect data. It's about making trust operational.
Stage by stage characteristics
Stage | Primary Characteristic | Processes | Technology | Business Impact |
|---|---|---|---|---|
Initial | Reactive and inconsistent | Issues handled after failures appear | Basic queries, manual checks, spreadsheet reconciliation | Low trust, slow decisions, constant firefighting |
Repeatable | Local controls exist | Some recurring checks and issue handling in limited areas | Point solutions, scripted validations, team-specific monitoring | Reduced chaos in pockets, uneven reliability |
Defined | Standardized across teams | Policies, roles, and workflows are documented and used consistently | Shared rules, profiling, schema and freshness monitoring | Better accountability, more predictable delivery |
Managed | Quantitatively controlled | Metrics are tracked, reviewed, and tied to improvement actions | Dashboards, trend analysis, alerting, measurable thresholds | Higher confidence, earlier detection, stronger governance |
Optimized | Continuous improvement and automation | Feedback loops improve controls before incidents spread | Automated anomaly detection, adaptive baselines, integrated observability | Proactive quality management, scalable trust, better readiness for analytics and AI |
A few practical observations matter here.
At the Initial stage, teams often believe they're more advanced than they are because they have talented people performing heroic recovery work. Heroics are not maturity. They're a temporary substitute for it.
At Repeatable, organizations usually create value quickly by focusing on a small set of critical datasets or reports. During this stage, targeted business-rule validation and clear issue ownership start to pay off. The trade-off is fragmentation. One team improves, another still works blind.
At Defined, the operating model becomes visible. Data owners, stewards, analysts, and engineers know which checks exist and what happens when they fail. This stage often feels slower at first because standardization adds discipline. In practice, it reduces rework.
Teams usually underestimate how much trust improves once issue handling becomes predictable, even before full automation arrives.
At Managed, quality becomes measurable in a way leadership can use. Trend lines matter. Timeliness matters. Defect patterns matter. The organization stops debating whether incidents are isolated and starts seeing recurring failure modes clearly.
At Optimized, automation closes the gap between detection and response. Controls are still designed by people, but machines handle more of the routine monitoring, baseline learning, and signal detection, allowing the quality program to stop depending on a few experts remembering what “normal” looked like last quarter.
How to Assess Your Current Maturity Level
A Head of Data asks three leaders the same question: how good is our data quality process? The engineering manager points to pipeline tests. The analytics lead points to recurring report fixes. The operations lead points to weekly exceptions handled by analysts. All three answers can be true, and the organization can still be operating at a lower maturity level than leadership assumes.
Assessment works only when it is tied to observable behavior. The goal is to identify what the organization can do repeatedly, at acceptable cost, on the data that matters most.
Start with evidence, not opinion
Assess a narrow slice first. Pick the data products that carry real consequence: revenue reporting, claims decisions, customer communications, regulatory submissions, or the inputs feeding executive dashboards.
Then test maturity in the order quality programs succeed or fail. First, identify the critical data elements. Second, define what acceptable quality means for those elements. Third, examine how issues are triaged, assigned, and resolved. Fourth, confirm that checks and controls are running against those requirements. Data Crossroads on data management maturity for data quality describes this sequence well, and it matches what works in practice.
That order matters because many teams buy monitoring before they have decision-grade rules. The result is predictable: lots of alerts, little agreement on what deserves action.
A modern platform such as digna helps here because it forces the assessment out of slideware and into operating evidence. You can see whether rules exist, whether they run consistently, whether incidents are owned, and whether quality is improving over time.
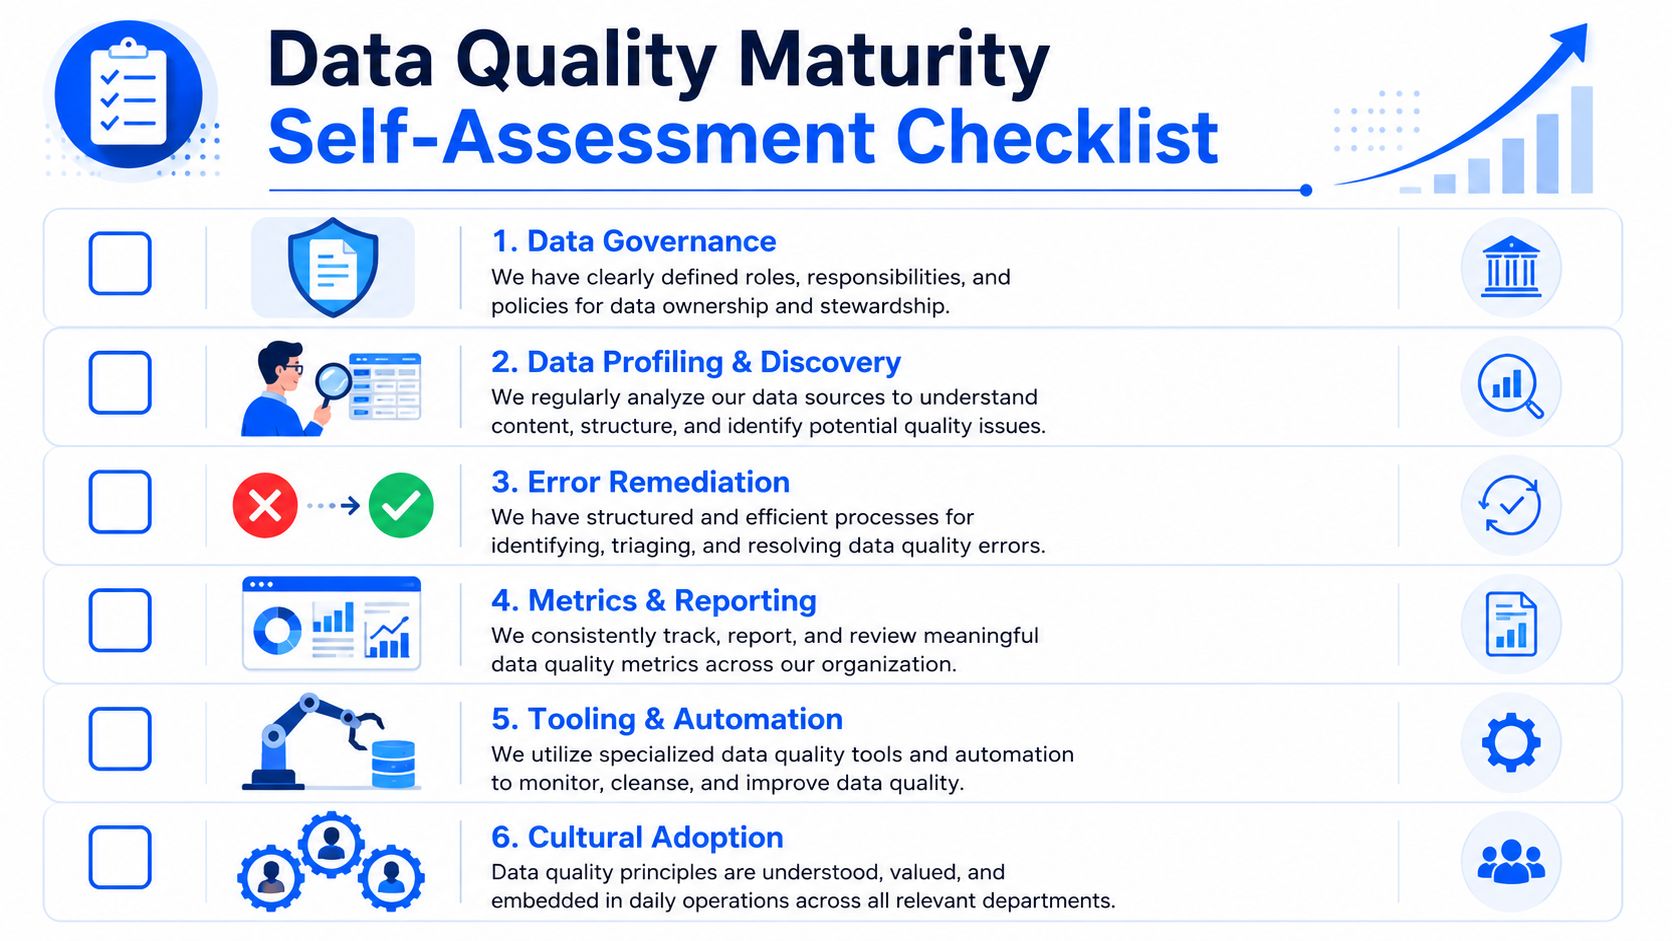
A practical self-assessment checklist
Use these prompts with engineering, analytics, governance, and business stakeholders:
Critical data scope: Which datasets drive revenue, compliance, customer experience, or executive decisions? If the answer is "everything," the scope is still too broad to assess well.
Rule clarity: Can teams describe what good data looks like in plain language and translate that into executable checks?
Issue workflow: When a quality incident appears, is there a documented path for triage, ownership, root-cause analysis, and resolution confirmation?
Measurement discipline: Are teams tracking a small set of data quality metrics tied to business risk over time, or are they only reacting to incidents?
Operational monitoring: Are checks embedded in pipelines and near key consumption points, or do they appear only during audits and escalations?
Decision support: Can business users see the health of the data they rely on? Good reporting practice matters here, and teams that need to strengthen that layer can learn from Wonderment Apps on business intelligence.
Cultural adoption: Do business users understand thresholds, definitions, and the effect of poor data, or is quality still treated as an engineering support task?
Ask for artifacts, not assurances.
A policy document shows intent. A rule library, alert history, ticket trail, exception log, and remediation record show that the process is operating. If the organization cannot produce those artifacts for a critical dataset, the maturity score should stay low, no matter how confident the stakeholders sound.
Short workshops usually surface the truth faster than long surveys. Put the dataset owner, the engineer who loads the data, the analyst who transforms it, and the manager who uses it in the same room. Ask each person to define the dataset, describe its failure modes, and explain what happens when quality drops. If the answers differ, the assessment has already found a gap.
This is also where platform capability becomes a useful test. If digna can map a dataset to rules, owners, incidents, thresholds, and trend reporting without heavy manual reconstruction, the organization is closer to Defined or Managed. If that information lives across spreadsheets, inboxes, and tribal knowledge, the maturity level is lower, even if talented people keep the business running.
Building Your Roadmap to Data-Driven Excellence
Once the assessment is done, the essential work begins. Many programs often stall at this stage. They produce a maturity score, circulate a slide deck, and move on. That's reporting, not transformation.
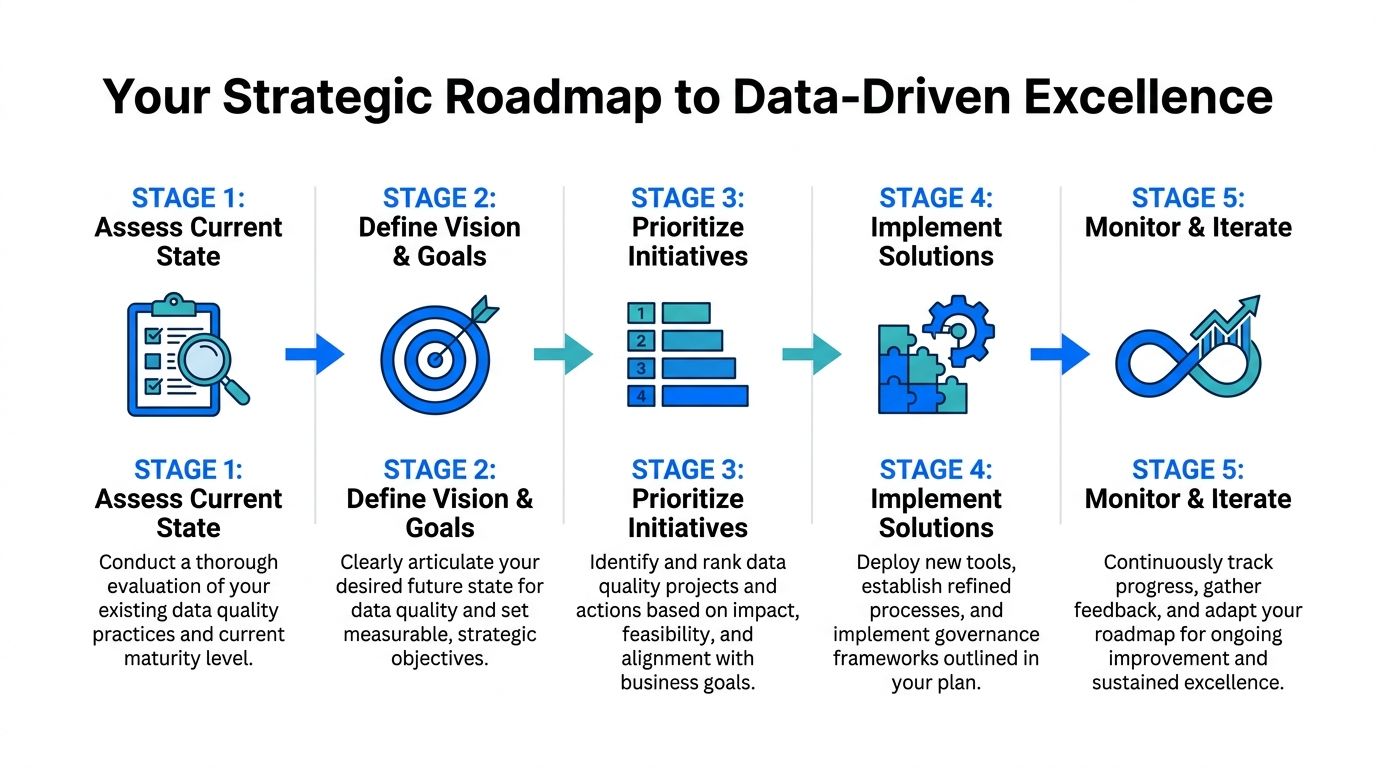
A roadmap should connect maturity gaps to business outcomes. It should tell you what to improve first, who owns it, and how progress will be measured over time.
Prioritize by business risk and decision impact
The right roadmap doesn't start with the longest backlog. It starts with the highest-consequence failure modes.
For most organizations, that means ranking initiatives by a few practical questions:
Which data issues can distort executive decisions or customer-facing operations?
Which failures repeat often enough to justify standard controls?
Which datasets support strategic analytics or AI use cases and therefore need stronger trust guarantees?
Which improvements are realistic in the next operating cycle?
This is also where adjacent disciplines matter. If your reporting layer is weak, quality improvements won't be visible to decision-makers. Teams building stronger analytics programs often benefit from practical guidance on business intelligence and data visualization approaches from Wonderment Apps, especially when quality metrics need to be communicated clearly outside the data team.
Why people work belongs in the roadmap
Many maturity programs over-invest in controls and under-invest in behavior. That's a mistake.
The People dimension is frequently underserved in maturity models, even though 70% of data quality gaps originate from human error and process misalignment, and organizations with formal data literacy programs achieve 3.5x faster maturity progression, according to Das42's guide to data maturity assessment.
That has direct roadmap implications:
Define ownership clearly. If stewardship is optional, remediation will stay slow.
Train non-technical users. Business teams need to understand definitions, thresholds, and escalation paths.
Tie quality to business KPIs. Quality work gains traction when leaders can connect it to decisions, risk reduction, and delivery speed.
Limit scope intentionally. Broad transformation slogans create fatigue. Focused wins create credibility.
A strong roadmap is a living operating plan. It evolves as controls mature, teams learn, and the business raises the bar for reliability.
Mapping Maturity Levels to Modern Platform Capabilities
The theory often breaks down in practice. Teams understand the stages intellectually, but they can't translate “Managed” or “Optimized” into platform capabilities, workflows, and operating controls.
That gap is real. Only 12% of organizations have successfully embedded maturity metrics into their data observability platforms, which shows how hard it still is to move from static assessment to continuous operational governance, according to Monte Carlo's analysis of the data quality maturity curve.

From abstract stages to operational controls
A modern platform should support different maturity levels without forcing every team into the same depth of implementation on day one.
At lower maturity, you need simple controls that reduce avoidable errors. At mid-maturity, you need consistency and shared visibility. At higher maturity, you need adaptive monitoring, trend analysis, and automation that can scale across changing pipelines.
That means mapping the maturity model to actual platform functions:
Repeatable stage capabilities: Record-level validation for business rules, scoped to critical datasets.
Defined stage capabilities: Shared schema monitoring, timeliness checks, documented thresholds, and cross-team visibility.
Managed stage capabilities: Metric trends, incident patterns, measurable baselines, and leadership reporting.
Optimized stage capabilities: AI-assisted anomaly detection, feedback loops, and continuous monitoring embedded into day-to-day operations.
Static assessments help you label maturity. Operational platforms help you change it.
What a modern platform should enable at each level
A platform like digna makes this mapping concrete because its components align closely with how organizations progress.
At the Repeatable stage, digna Data Validation supports user-defined, record-level rules. This is the right fit when teams need to enforce core business logic for specific assets without pretending the entire estate is standardized. It's useful for audit-sensitive tables, regulated processes, or recurring quality defects where clear rules already exist.
At the Defined stage, digna Schema Tracker and digna Timeliness become more important. Schema drift and late-arriving data often cause downstream breakage long before anyone labels it a quality problem. Monitoring structural changes, expected delivery time, and delay patterns gives teams a standard control layer that multiple domains can share.
At the Managed stage, digna Data Analytics adds historical observability analysis. This capability allows mature organizations to move beyond mere incident detection, instead reviewing trends, identifying recurring weak points, and determining which controls require tightening, simplification, or expansion.
At the Optimized stage, digna Data Anomalies is the bridge from static thresholds to adaptive monitoring. It learns normal behavior with AI and statistical methods, which helps teams detect unexpected shifts without manually maintaining an ever-growing ruleset. That's especially relevant for large estates where fixed thresholds become brittle.
A few architectural choices also matter operationally:
In-database execution: Analysis runs inside the customer environment, which supports private cloud and on-prem requirements while reducing unnecessary data movement.
Unified interface: Engineers, analysts, and stakeholders can inspect trends, timeliness, anomalies, and schema changes in one place.
Enterprise fit: Warehouses, lakes, and complex pipelines need controls that work at scale, not just on a handful of curated assets.
For teams trying to raise the organization's skill base alongside platform maturity, structured education also has a place. Programs such as an online MBA in data science and AI from JAIN Online can help data leaders develop the mix of technical and managerial fluency that maturity programs demand.
The practical lesson is simple. Don't buy a platform because it claims to be “AI-powered.” Use a platform because its capabilities match the maturity stage you're in and the one you need to reach next.
Making Data Maturity a Continuous Practice
Data maturity isn't a project you complete. It's a management discipline you keep running.
The cycle is straightforward. Assess current controls. Prioritize the highest-risk gaps. Implement the next layer of process and platform capability. Monitor outcomes. Then repeat. Teams that treat maturity this way build trust steadily because they improve the operating system behind the data, not just the symptoms around it.
That also means quality work can't sit apart from the broader architecture. If your pipelines, applications, and reporting stack remain fragmented, controls will too. Many organizations find it useful to strengthen the systems layer in parallel, especially when they need to integrate business systems efficiently with a clearer platform strategy.
The most reliable programs keep quality visible in daily operations, not only in quarterly governance reviews. That requires continuous data quality monitoring in production workflows, clear ownership, and a habit of revisiting what “good” means as the business changes.
Start smaller than you think. Pick critical data. Define the rules. Make failures visible. Build the muscle. Mature data organizations aren't the ones with the thickest framework documents. They're the ones that keep improving the system every month.
If you're ready to move from periodic assessment to operational data quality, digna gives teams a practical way to detect anomalies, validate records, monitor timeliness, and track schema change inside customer-controlled environments. It's built for organizations that want data quality maturity to show up in production, not just in slides.