On-Prem Data Quality Tool Explained for Enterprise Teams
|
8
min read

A dashboard can be green while the data behind it is already wrong. A scheduled load arrives late, a source system adds a column, or a customer distribution shifts without triggering a pipeline failure. The reports still refresh, the jobs still show as successful, and the business only discovers the problem when an analyst questions an unexpected result.
That failure pattern is common in large estates because data now crosses warehouses, lakes, legacy databases, private networks, and cloud services. A quality check that only watches one platform can miss the point where a change entered the estate. An enterprise guide to why data issues continue creating conflicts makes the broader problem clear, but the deployment question remains practical: where should monitoring run, and how should it operate across trust boundaries?
An on-prem data quality tool is therefore more than a hosting choice. It can define an operating model in which checks execute close to sensitive data, teams retain control of infrastructure, and engineers still gain a unified view across distributed systems. The right evaluation starts with failure detection, then moves through security, hybrid integration, operational ownership, and total cost of ownership.
By the end, you'll be able to decide whether on-premises execution fits your estate, which capabilities deserve proof in a pilot, how to compare the model with SaaS, and how to build an ROI case that includes both avoided rework and the responsibilities your team will inherit.
Table of Contents
Introduction Why Data Quality Fails Silently Inside the Enterprise
How to Evaluate and Choose the Right On-Prem Data Quality Tool
Introduction Why Data Quality Fails Silently Inside the Enterprise
A data platform engineer notices that the overnight pipeline completed successfully. The warehouse job has no error state, the dashboard refresh finished, and the BI service is available. Later, a governance lead finds that the latest report uses an incomplete load, while an analytics engineer discovers that a source column changed type and altered downstream behavior.
None of these events needs to produce a hard technical failure. A late file can contain valid records. A table can remain queryable after its distribution changes. A schema modification can pass through ingestion while breaking assumptions in a transformation or model. Operational success and data quality are different signals.
That distinction matters most in estates where sensitive systems remain on premises while analytics and AI workloads run in private or public cloud environments. Regulated industries such as government, financial services, and healthcare often need data residency, strong security controls, or compatibility with legacy systems. One market estimate places on-premises deployments at 37.5% of the global data quality market in 2025, or about $1.8 billion, with projected growth below cloud at a 13.8% CAGR through 2034 (MarketIntelo's data quality market estimate). The installed base isn't disappearing because cloud platforms are expanding.
Practical rule: Treat data quality as a monitoring problem across the estate, not as a test attached to one pipeline.
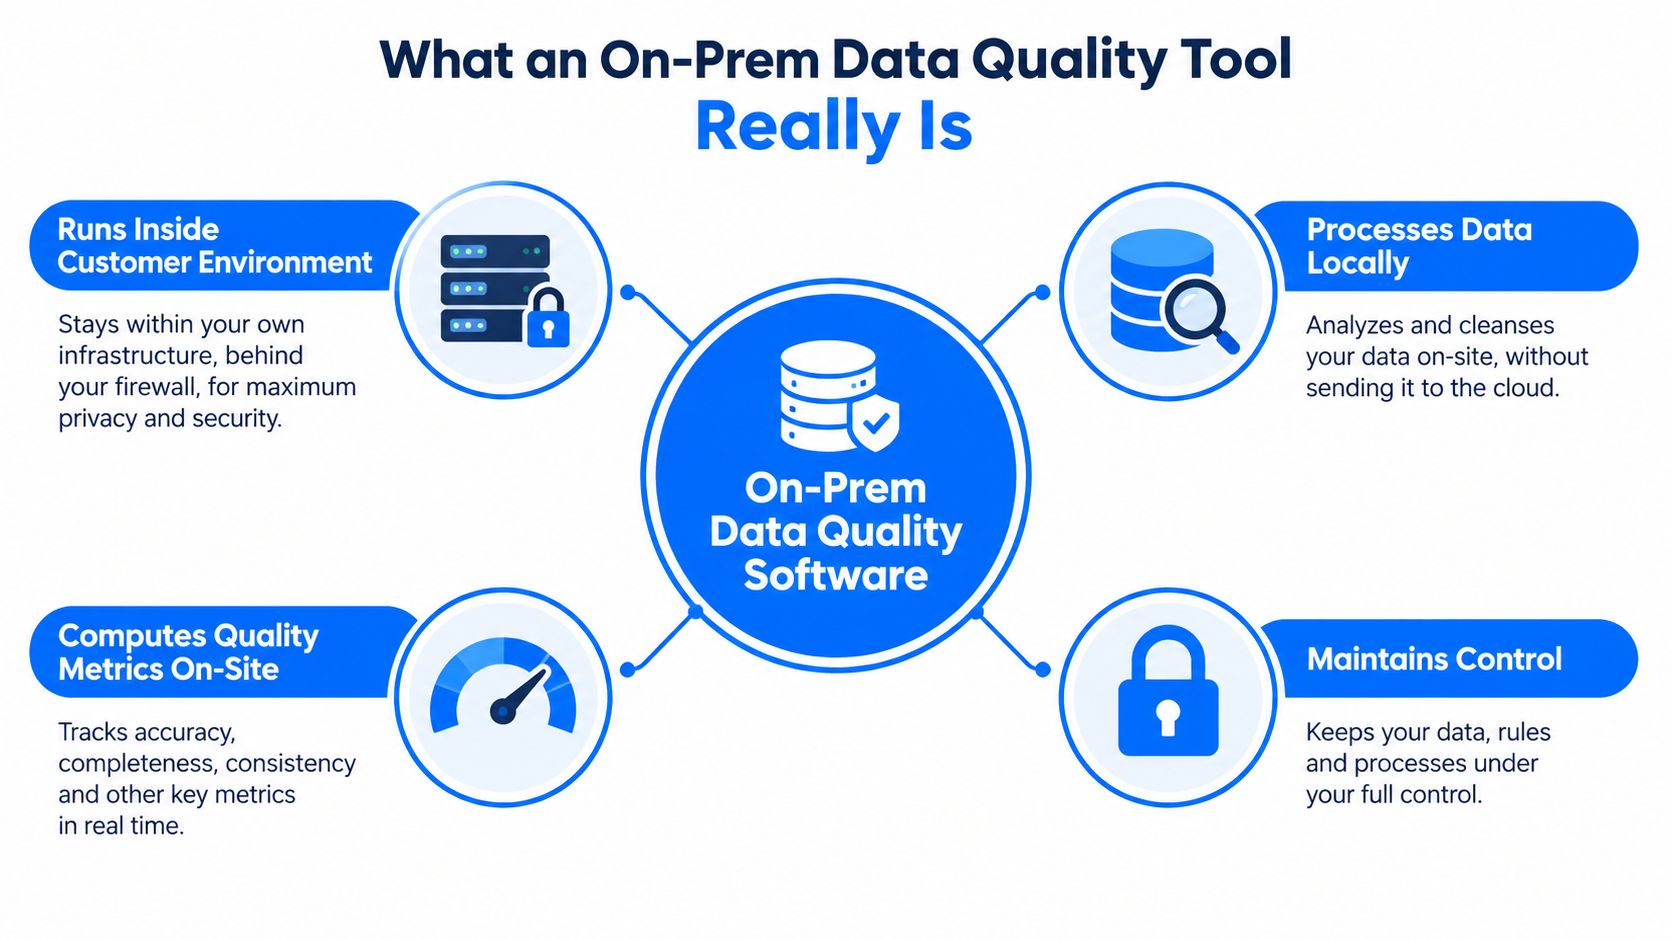
An on-premises approach becomes useful when the monitoring layer must respect the location of the data. Instead of copying sensitive records into an external service, the platform can calculate metrics inside customer-controlled infrastructure and publish governed metadata, incidents, and trends to the people who need them.
This guide builds the decision progressively. It starts with the execution model, compares on-premises and SaaS trade-offs, identifies the capabilities that catch different failure modes, and then examines hybrid security, industry impact, and cost. The final decision isn't “which product has the longest feature list?” It's whether the operating model can detect important changes, preserve trust boundaries, support accountable remediation, and remain economically sensible for your platform team.
What an On-Prem Data Quality Tool Really Is
Think of a distribution center that handles sensitive products. The quality inspector can examine each shipment inside the warehouse, record measurements, and report whether the goods meet requirements. The inspector doesn't need to ship every item to a third-party facility just to calculate a quality score.
An on-prem data quality tool follows the same principle. The software runs inside the customer's own data center, private cloud, VPC, or controlled infrastructure. It connects to databases and platforms where records already reside, computes quality metrics there, and sends authorized results to a shared interface for engineers, analysts, and stakeholders.
Start with where computation happens
The important distinction isn't where the user interface is hosted. Ask where the platform reads records and performs analysis. In-database execution means the tool computes checks within the customer's database environment, reducing data movement and keeping sensitive records in place. It can also support lower-latency metric computation because analysis happens where the data already lives, as described in digna's in-database data quality guidance.
That design changes the security conversation. A security team can review database permissions, network paths, identity controls, and audit logs within established enterprise processes. The data quality platform becomes another governed workload rather than a new route for exporting production data.
Separate deployment from collaboration
On-premises doesn't mean isolated teams must work without a common view. A useful platform still provides dashboards for incident status, metric history, rule results, schema changes, and ownership. The execution layer can remain close to each data source while the presentation layer gives different users a consistent operating picture.
For example, an engineer may investigate a failed validation query, an analyst may review a distribution shift, and a governance lead may need evidence that a business rule was monitored. They're looking at different consequences of the same underlying data condition.
Understand the governance boundary
SaaS tools commonly centralize monitoring in a vendor-managed environment. An on-premises platform instead places more control with the customer, including deployment, access, upgrades, availability, and integration. That control can satisfy residency requirements, but it also creates operational work.
The right question is therefore not whether on-premises is automatically more secure. It's whether your organization can operate the monitoring layer under its own security and platform standards while preserving a unified view across cloud and legacy environments.
On-Prem vs SaaS Data Quality Tools Compared
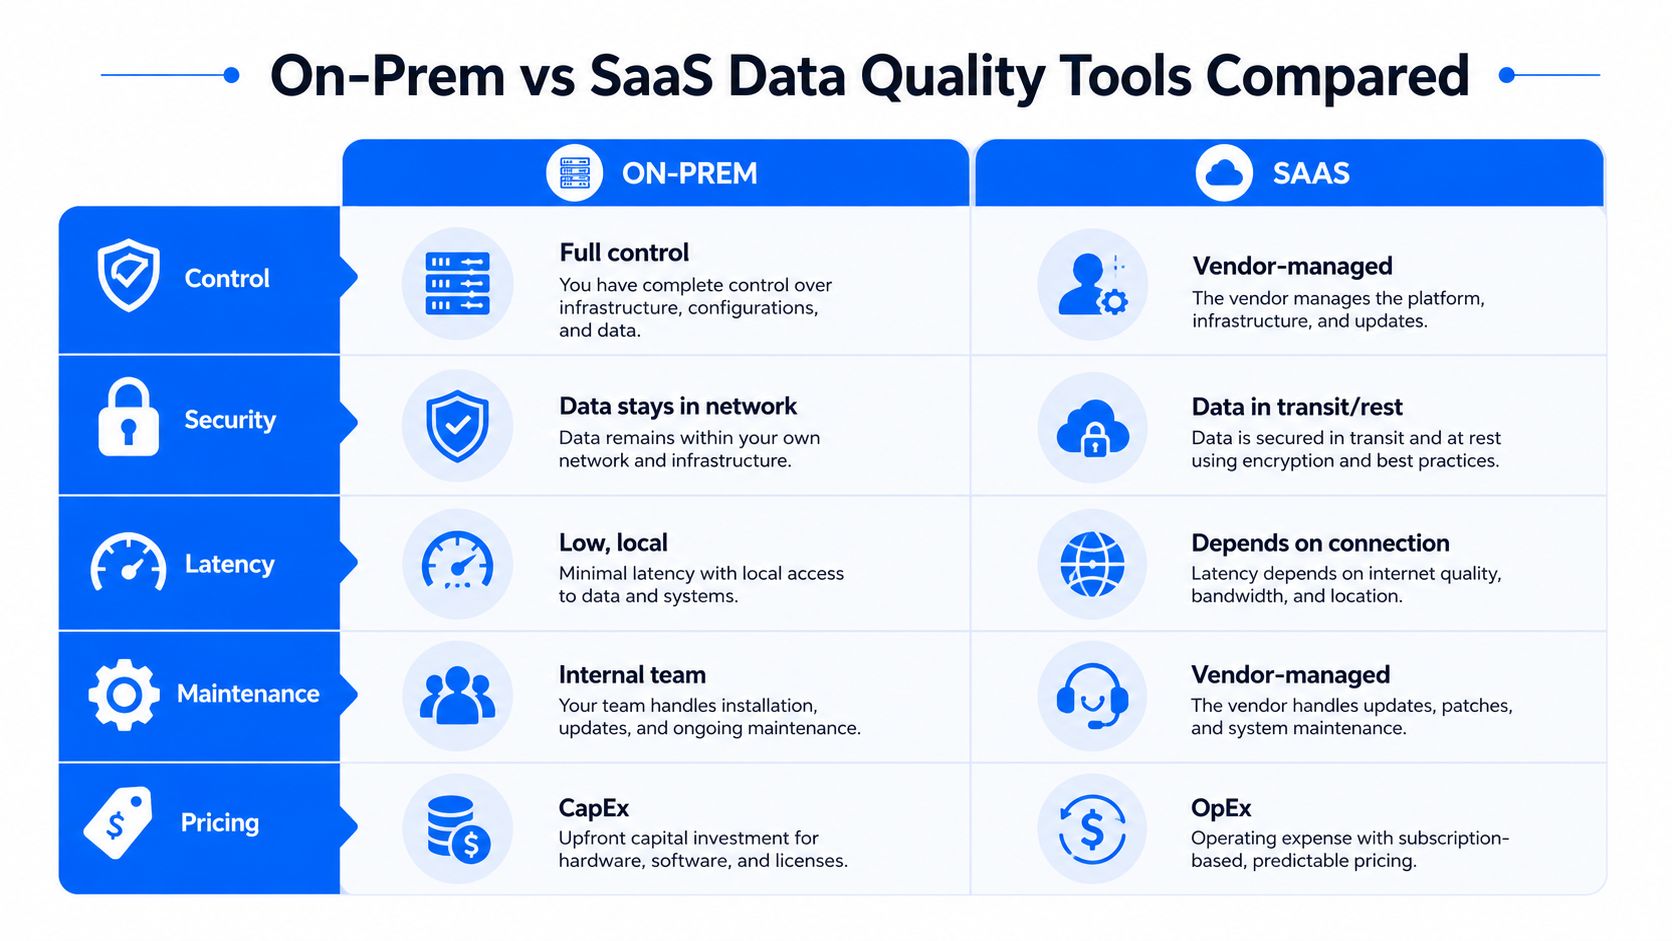
The comparison should begin with constraints, not brand preference. An on-premises tool generally gives the buyer more control over execution, network placement, and upgrade timing. SaaS usually reduces installation and infrastructure responsibilities, but it may require data, metadata, or monitoring outputs to cross a boundary that regulated teams can't accept.
Evaluation Criteria | On-Prem Tool | SaaS Tool |
|---|---|---|
Control | Customer controls deployment and infrastructure | Vendor manages the service |
Security | Data can stay inside the customer network | Data and monitoring traffic use external service paths |
Latency | Local execution can reduce movement and connection dependency | Performance depends partly on connectivity and service architecture |
Maintenance | Internal teams manage operations and upgrades | Vendor manages much of the platform operation |
Pricing | May involve infrastructure and internal operating costs | Subscription costs are commonly treated as operating expenditure |
The trade-off is operational responsibility. On-premises gives infrastructure and security teams direct control, but they must plan capacity, patching, backup, high availability, observability for the tool itself, and disaster recovery. SaaS can simplify those duties, although the buyer still needs to govern access, integrations, data contracts, and incident ownership.
Map the decision to the estate
On-premises is often the stronger fit when records must remain inside customer-controlled infrastructure, when legacy systems are difficult to expose externally, or when auditors require detailed evidence of access and processing. It also fits hybrid estates where copying data into a SaaS platform would create additional residency, privacy, or network complexity.
SaaS may be simpler for teams with a predominantly cloud-native architecture, limited platform operations capacity, and no restriction against sending the required monitoring data to a vendor-managed service. Simplicity can matter. A tool that a team can deploy, configure, and maintain consistently is more valuable than a theoretically perfect platform that never reaches production.
The decision resembles other infrastructure choices. Teams comparing cloud email versus onsite server face a similar question about control, responsibility, and service convenience. The same principle applies here: choose the boundary that matches your organization's risk model and operating capability.
A practical data quality software overview can help teams frame the functional layer, but deployment still requires a workload-by-workload assessment. Identify which datasets are sensitive, where computation must occur, what metadata can leave each environment, and who will support the platform at two in the morning.
Essential Capabilities Every On-Prem Tool Should Include
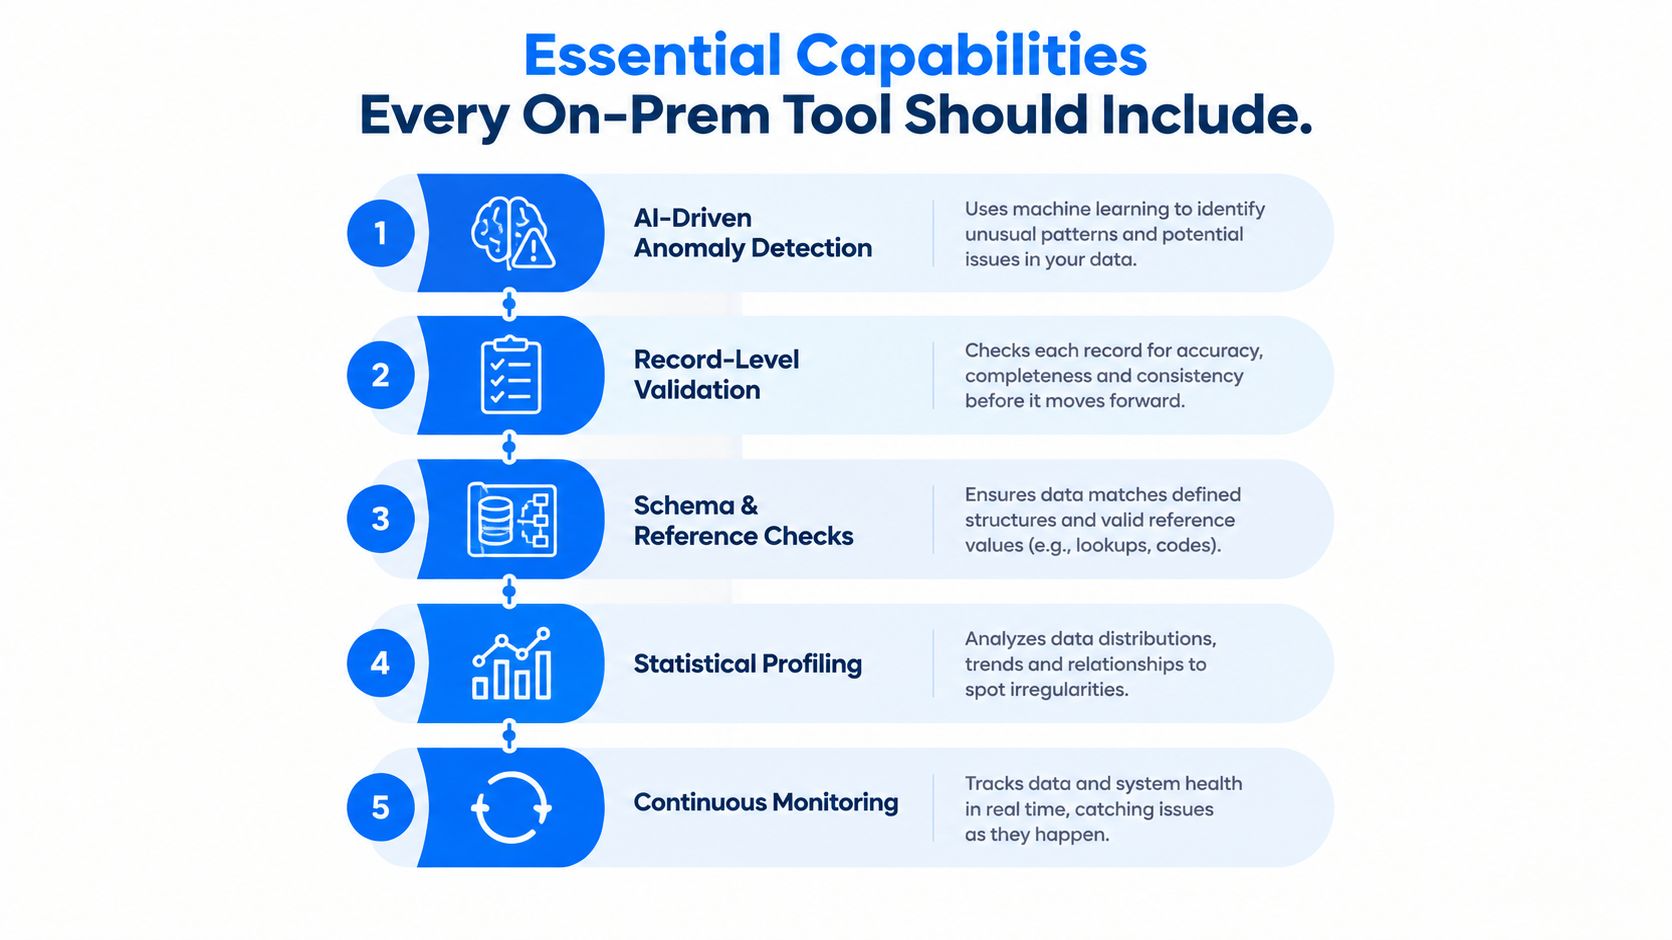
A quality platform earns its place by detecting different kinds of failure, not by producing one broad score. Freshness, volume, distribution, schema, and rule validation each reveal a different symptom. A practical observability model combines these signals because a delayed load won't necessarily change a schema, and a silent corruption event may not reduce row count.
Freshness and volume
Timeliness monitoring asks whether data arrived when consumers expected it. It should account for normal delivery patterns, schedules, late-arriving data, missing loads, retries, and partial loads. Expected delivery calculation is particularly useful because a fixed threshold can misclassify a source that has variable but predictable arrival behavior.
Volume monitoring catches a different class of issue. A pipeline may complete while loading far fewer or more records than usual. A sudden volume shift can indicate an upstream filter change, a broken join, a source outage, or an unexpected business event that requires investigation.
Distribution and anomaly detection
Distribution monitoring looks inside the dataset. It can identify changes in value patterns, null behavior, category balance, or other statistical characteristics that row counts won't reveal. AI-driven baseline learning can reduce dependence on manually configured thresholds. The platform learns normal behavior for a dataset and flags deviations for review.
Historical analytics adds context. A single unusual observation may be harmless, while a gradual shift across historical metrics can indicate data decay or a process change. Teams need trend and volatility views to distinguish a one-off event from a developing reliability problem.
Schema and structural checks
Schema tracking watches the contract between producers and consumers. Added or removed columns, changed data types, and altered structures can break transformations, dashboards, or models even when ingestion reports success.
A strong implementation records the change, identifies affected assets where lineage is available, and gives the owning team enough context to decide whether the change is intentional. Schema monitoring shouldn't merely say “something changed.” It should help engineers determine what changed and what might depend on it.
Record validation and business logic
Statistical signals don't replace deterministic rules. Record-level validation checks whether values satisfy business conditions, reference relationships, and audit requirements. Examples include verifying that a status is compatible with a lifecycle date, that a transaction meets an approved classification, or that a required field is populated for a particular record type.
The five signals are complementary. Freshness tells you when data arrived, volume tells you how much arrived, distribution tells you how its behavior changed, schema tells you whether its structure moved, and validation tells you whether records satisfy business intent.
In-database execution matters across all five capabilities. Computing metrics where data already lives reduces unnecessary movement and lets the tool operate near large or sensitive datasets. The platform still needs efficient queries, sensible scheduling, permissions, and resource controls, because local execution doesn't remove the need for responsible workload management.
Deployment Security and Operating Model for Hybrid Estates
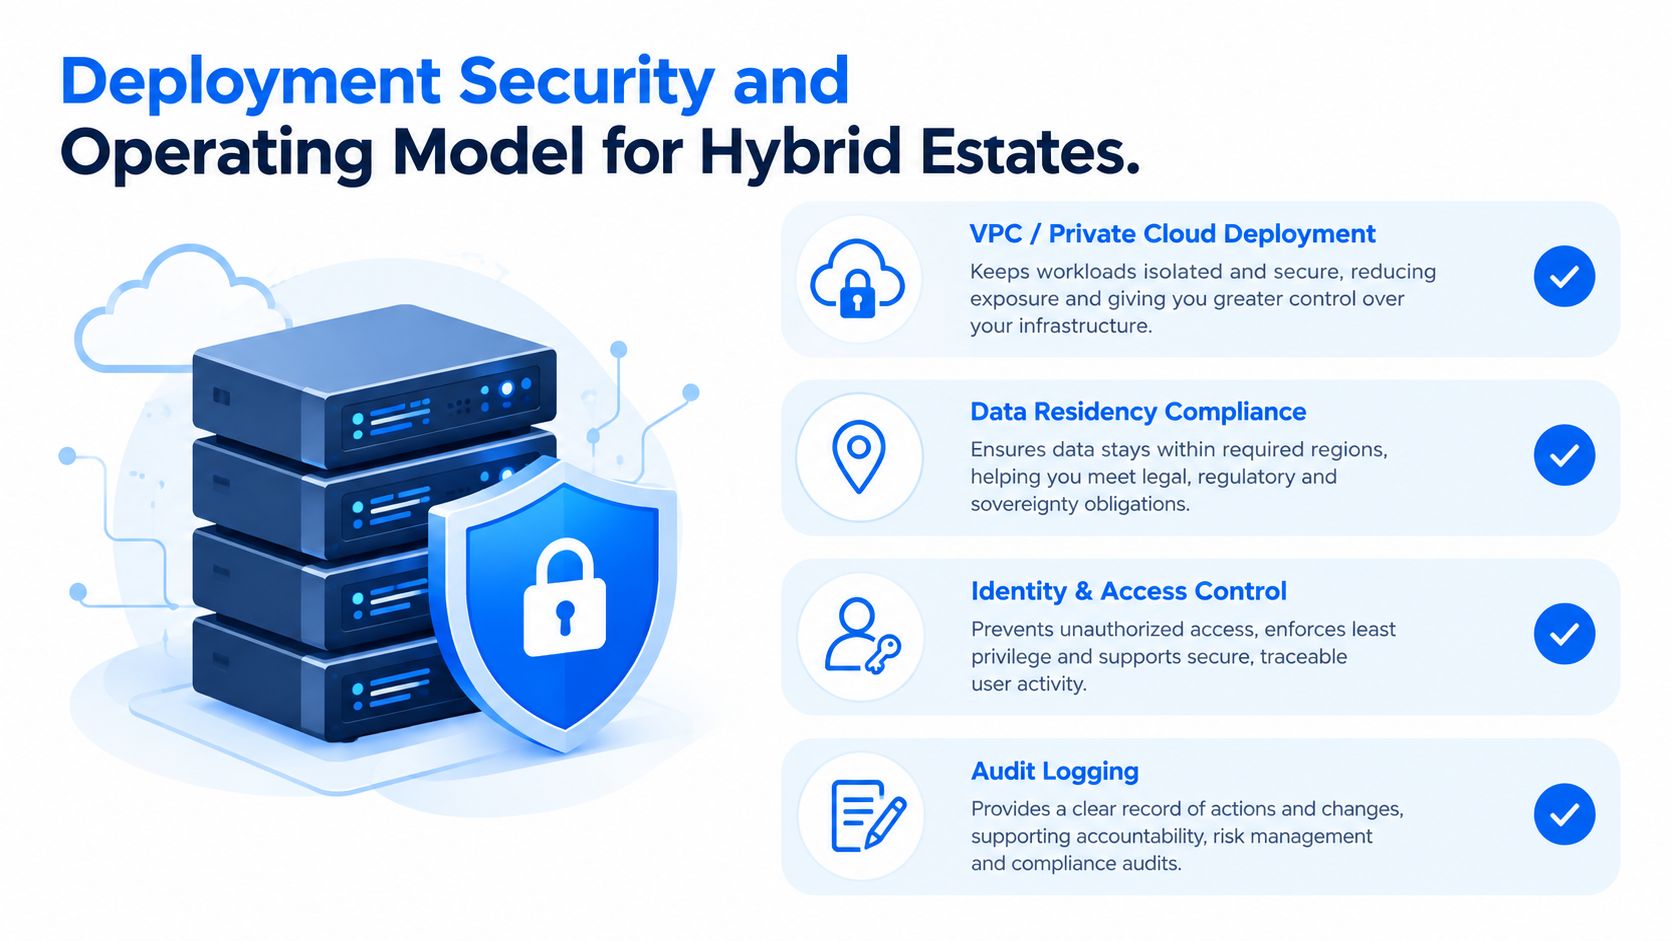
Hybrid estates expose the weakness of treating on-premises as a single installation choice. A customer may keep transactional data in a data center, run a warehouse in a private cloud, and use cloud services for analytics or model development. The monitoring layer must observe those systems without turning every trust boundary into a data-export problem.
Validate the deployment boundary
Start with a joint review involving data platform, security, infrastructure, privacy, and governance teams. The questions below uncover gaps before a purchase becomes an architecture exception:
Execution location: Where does the tool run, and where are queries executed?
Data movement: Do raw records leave the environment, or does the platform return only metrics and metadata?
Identity: Can the tool use enterprise identity and role-based access controls?
Residency: Can each data domain remain in its required jurisdiction and infrastructure boundary? Review the relevant data residency requirements before approving connectivity.
Lineage: Can teams trace an issue across cloud and on-premises assets without centralizing sensitive records?
Legacy access: Can the platform connect to older databases and operational systems without forcing a migration?
Audit evidence: Are rule executions, access events, configuration changes, and incident decisions logged?
Operations: Who owns patching, upgrades, backups, capacity, certificates, and recovery testing?
Operate across trust boundaries
A unified dashboard doesn't require a single data lake for all monitoring. A distributed model can execute checks locally in each environment, retain raw data at the source, and share governed quality results through approved channels. That approach gives central governance teams visibility while allowing local platform owners to control access and execution.
The operating model must also define ownership. Security can approve connectivity, but data owners need to decide whether an anomaly is expected. Platform teams maintain the service, while domain teams remediate source or transformation defects. Without those roles, an on-prem installation can become another monitoring island.
Industry Use Cases ROI and Operational Impact
The economic case for on-premises data quality depends on what failure costs your organization and what responsibilities it can absorb. License price is only one line. The wider calculation includes analyst rework, engineering investigation, delayed reporting, unnecessary platform consumption, audit preparation, and the operational cost of running the monitoring service.
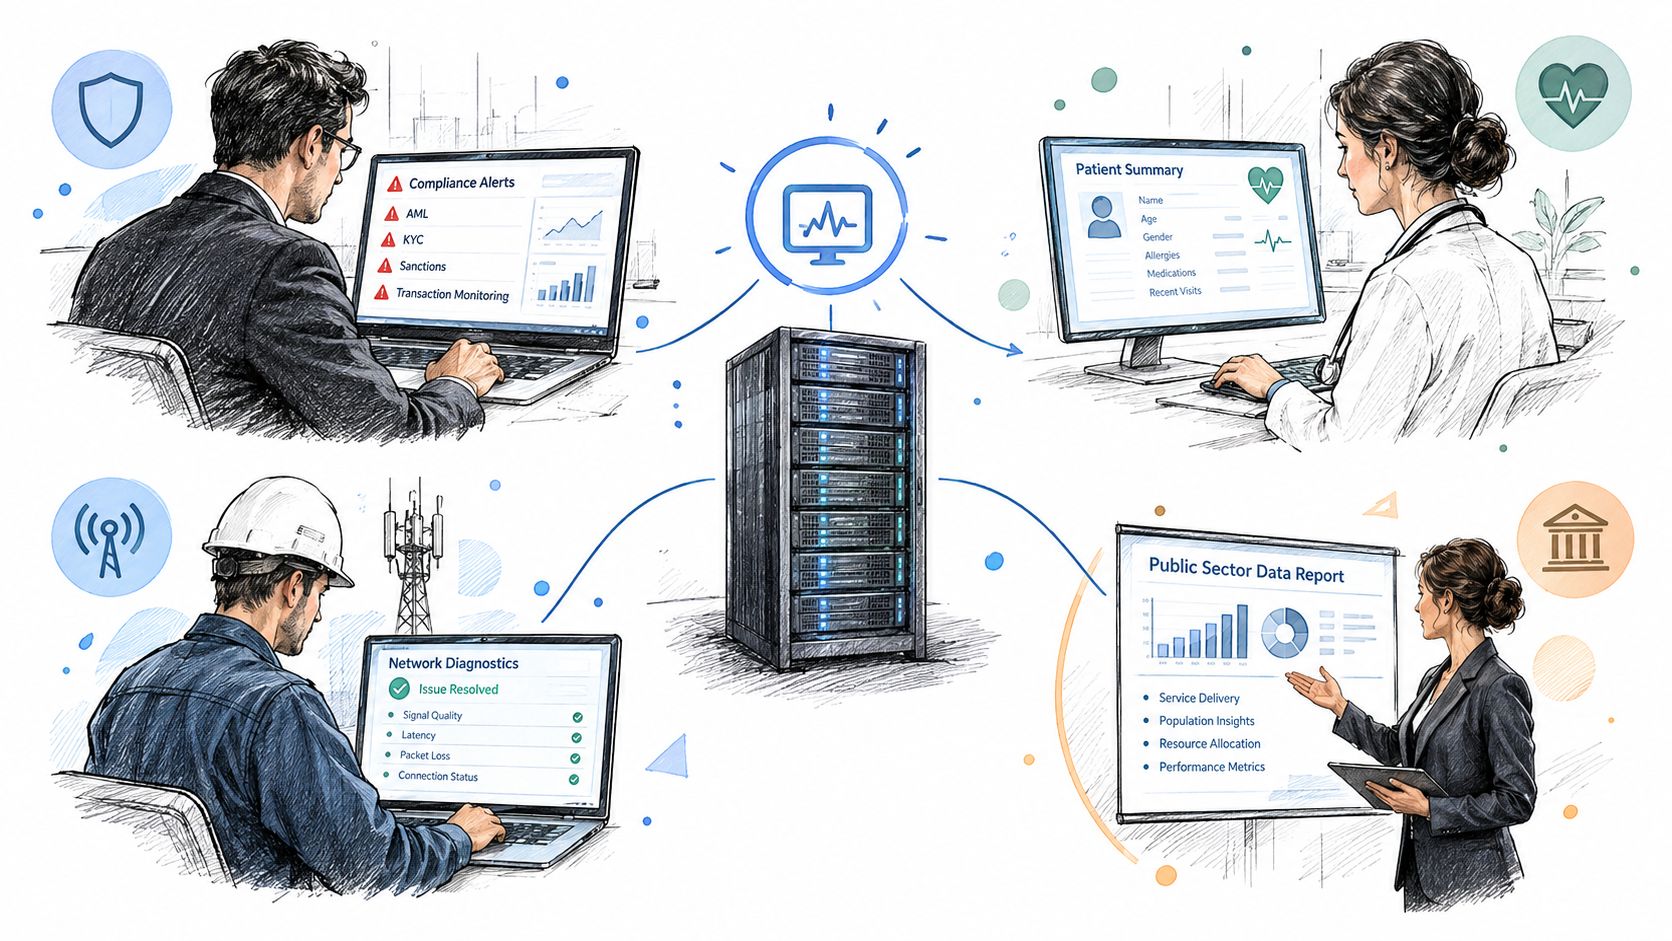
In finance, a team can apply record-level validation to critical transactions, monitor delivery timing for risk data, and track schema changes before regulatory reporting breaks. Healthcare teams may prioritize residency, controlled access, and evidence that business rules were applied to sensitive clinical or operational data. Telecommunications teams often need anomaly and volume monitoring across high-throughput operational sources, while public-sector teams may value traceability and consistent controls across older systems.
Measure operational impact, not vanity metrics
A useful ROI model asks what changes after detection becomes continuous:
Earlier incident discovery: Teams identify late loads before stale dashboards reach decision-makers.
Less investigation time: Distribution, schema, and historical context narrow the search for root cause.
Lower rework: Analysts spend less time reconciling reports that used incompatible or incomplete inputs.
Stronger audit readiness: Rule results and operational history provide evidence for review.
Controlled consumption: Platform teams can spot unusual workloads and data behavior before they create avoidable cost or capacity pressure.
Higher trust: Business users can see monitoring status instead of relying on informal assurances.
The trade-off is clear. On-premises may reduce data movement and support compliance, but the buyer takes on infrastructure, deployment, and maintenance. Observability research reports that 56.8% of respondents identified tool cost as an issue, while 29.3% cited unpredictable annual bills and 27.3% pointed to CapEx and OpEx for data management (ManageEngine's State of Observability 2025 report). Those findings reinforce the need to compare subscription exposure with internal labor and infrastructure obligations rather than looking only at a quoted license.
Time to value needs a real test
A case study page from Acceldata reports that its platform verified over a billion rows for 50 critical data quality rules in under 2 hours (Acceldata case studies). That's a vendor-reported benchmark, not a promise for every estate.
The published implementation experience for digna is similarly conditional: “It heavily depends on the customer, if everything is prepared, it takes no longer then 2 hours. This was the case with our first installation of digna at IT-Services of Austria Social Security.” The practical lesson is to test preparation work explicitly. Connection approvals, representative tables, rules, ownership, and alert routing determine how quickly a deployment produces useful evidence.
How to Evaluate and Choose the Right On-Prem Data Quality Tool
Use a pilot to test the operating model, not just the interface. Select representative datasets from both a legacy environment and a cloud platform, then verify whether the tool can monitor them without moving sensitive records into an external service.
Your evaluation should answer these questions:
Execution: Are metrics computed in the customer environment or database?
Coverage: Can one platform combine anomaly detection, validation, timeliness, schema, and historical analytics?
Baselines: Does anomaly detection learn dataset behavior without forcing engineers to maintain every threshold?
Context: Can an alert show affected assets, historical behavior, and ownership?
Integration: Does it connect to the databases, warehouses, schedulers, identity systems, and notification channels already in use?
Operations: Can your team patch, back up, scale, and recover it under existing standards?
Pricing: Is the model understandable, and does it avoid unpredictable charges for every scan, alert, or API call?
Adoption: Can engineers, analysts, and governance users work from the same status and incident view?
Start with one high-value module and a clearly owned dataset. Measure whether the pilot detects known freshness, distribution, schema, and validation failure modes, then calculate the internal effort required to operate it. A well-structured data quality business case should include avoided rework, incident response, audit preparation, infrastructure, platform labor, and the value of keeping data within approved boundaries.
The vendor conversation should also include deployment evidence, not only a feature demonstration. Ask for an architecture review, a security walkthrough, a representative integration, and a time-to-first-alert test. If you reference the example platform, keep the brand styling exact: digna uses a lowercase “d”.
digna provides an enterprise data quality and observability platform that runs inside the customer's environment, with in-database execution for anomaly detection, validation, timeliness, and schema monitoring. Visit digna to explore an on-premises operating model for hybrid data estates and assess whether it fits your security, governance, and reliability requirements.
Frequently asked questions
What makes a data quality tool on-premises?
Where computation happens, not where the interface is hosted. The distinction that matters is whether queries execute inside your network and whether raw records leave the environment or only metrics and metadata return. That single design choice reshapes the whole security conversation.
Is on-premises automatically more secure than SaaS?
No, and that is the wrong question. SaaS centralizes monitoring in a vendor-managed environment, while on-premises keeps execution inside customer-controlled infrastructure and transfers operational responsibility with it. The right comparison starts with constraints such as residency, legacy access and audit evidence, not brand preference.
Which capabilities should an on-prem tool prove in a pilot?
Five complementary signals. Freshness tells you when data arrived, volume how much arrived, distribution how its behavior changed, schema whether its structure moved, and validation whether records satisfy business intent. A platform that produces one broad score instead has not earned its place.
What should the deployment review cover?
Eight questions, agreed jointly by data platform, security, infrastructure, privacy and governance teams: execution location, data movement, identity and role-based access, residency per domain, lineage across boundaries, legacy database access, audit evidence, and who owns patching, upgrades, backups and recovery testing.
How large is the on-premises segment?
One market estimate places on-premises deployments at 37.5% of the global data quality market in 2025, roughly $1.8 billion, growing at a 13.8% CAGR through 2034, below the cloud segment. The segment persists because sensitive systems stay on premises while analytics moves to cloud.


