10 ETL Monitoring Tools for Reliable Data Pipelines
|
11
min read

A successful ETL run doesn't prove that the data is reliable. It only proves that an orchestrator reached the end of its execution path. The job can load the wrong record set, arrive after a reporting deadline, accept an unexpected schema, or produce plausible values that break a model without returning an obvious error.
That's why the best ETL monitoring tools answer operational questions, not just feature-list questions. How quickly can a team detect late data? Can engineers distinguish normal volatility from a material anomaly? Where do validation checks execute? Does schema tracking show downstream impact? Can an alert reach the right owner with enough context to support triage and remediation?
The ten tools below are compared across those dimensions. The audience is practical: data platform and engineering teams, analytics engineers, BI developers, governance leaders, and enterprises operating warehouses, lakes, and heterogeneous pipelines. The goal isn't to identify one universal winner. It's to show which operating model each platform supports, where implementation becomes demanding, and what kind of monitoring gap it can close.
Table of Contents
1. digna
digna is built for organizations that need monitoring to remain inside their own security and operating boundary. It can run in a private cloud, VPC, or on-premises environment, with checks executed in-database so production data stays within the customer's systems. That architecture matters when governance teams need to control data movement, or when regulated workloads can't send operational records to an external observability service. The platform's enterprise data observability capabilities cover anomalies, timeliness, validation, schema changes, business metrics, and platform behavior in one interface.
The operational distinction is how digna finds problems. Data Anomalies learns the baseline behavior of each dataset using AI and statistical methods, reducing the need to hand-write rules for every normal fluctuation. Timeliness learns delivery patterns and calculates expected arrival times, which is more useful than checking only whether a scheduled job reported success. Data Validation applies record-level business rules, while Schema Tracker flags added or removed columns and data type changes before downstream consumers fail. Teams can also use digna's data anomaly monitoring to examine behavioral shifts rather than relying solely on null or row-count checks.
Where digna fits best
digna's modular architecture lets a team start with one module, such as Anomalies or Timeliness, and expand into validation, analytics, and schema tracking. The included scheduler, catalog, integrations, and collaboration features reduce the need to assemble separate operational components. The vendor states that initial insights can appear in under two hours, a time-to-value claim that should still be tested against the organization's access, deployment, and metadata requirements.
Its commercial model is a base fee plus a per-active-table charge per module, with no API-call, scan, or alert-volume surcharges. That transparency can simplify capacity planning, although organizations with thousands of monitored tables should model the per-table, per-module cost carefully. The trade-off is ownership. A private or on-premises deployment gives the customer control, but it also requires internal infrastructure, security, and platform resources.
digna is a strong fit for finance, healthcare, telecommunications, and public-sector teams that prioritize sovereignty, in-database execution, and unified monitoring across data quality and platform operations. It's less suitable for a buyer seeking a fully outsourced service with minimal deployment responsibility.

Practical rule: Choose digna when the location where checks execute is a governance requirement, not merely an architectural preference.
2. Monte Carlo
Monte Carlo is designed for enterprises that need a broad view of data reliability across warehouses, lakes, ETL and ELT systems, and BI assets. Its value appears after an alert fires. Automated freshness, volume, schema, and anomaly monitors identify a deviation, while lineage and blast-radius analysis help responders determine which dashboards, models, or downstream datasets may be affected. That context addresses a common weakness in binary pipeline monitoring, where every failed job looks equally urgent.
The platform also emphasizes incident ownership and root-cause workflows. A data platform team can route an issue, identify responsible stakeholders, and investigate upstream dependencies rather than asking analysts to report broken dashboards manually. Its broader data and AI observability capabilities extend into areas such as agents and unstructured data, which may appeal to organizations building monitoring around more than conventional warehouse tables.
Operational trade-offs
Monte Carlo's breadth is both its advantage and its implementation challenge. A heterogeneous enterprise can gain value from a single observability layer, but lineage, ownership, incident routing, and monitoring standards usually require alignment across data engineering, analytics, and governance teams. Without that operating agreement, the organization may deploy a large surface area while leaving ownership ambiguous.
Pricing is enterprise-oriented and requires a quote, so buyers should evaluate total ownership rather than connector count. Ask how much configuration is needed to establish meaningful baselines, how incidents map to existing paging systems, and which capabilities require additional commercial scope. The Monte Carlo comparison context is useful for teams weighing broad lineage-driven observability against a more contained deployment.
Monte Carlo fits complex stacks where investigation speed and cross-team incident workflows matter as much as detection. Smaller teams with a narrow set of pipelines may find its breadth harder to justify.
Monte Carlo's platform is most compelling when the central question is, “What else is affected by this data incident?”
3. Bigeye
Bigeye takes an automation-first approach to monitoring data quality and reliability. It provides monitors for freshness, volume, schema, and data quality, then uses lineage to add root-cause and impact context. That combination helps teams move beyond “this table changed” toward “this upstream change is affecting these consumers,” which can shorten investigation for environments with many dependent datasets.
The platform also has a strong enterprise security and compliance orientation. That makes it relevant to regulated organizations that need monitoring controls to fit existing governance and procurement expectations. Cloud data-platform integrations, onboarding programs, and professional services can help teams establish coverage when internal capacity is limited, although those services may also make the implementation feel more like an enterprise program than a lightweight tool rollout.
The important limitation
Bigeye's automated coverage reduces manual rule writing, but buyers should validate how much evidence is available during root-cause analysis. The platform may surface limited row-level data for investigation, held in memory, which some organizations will prefer from a privacy perspective and others may see as a constraint when debugging complex transformations. That trade-off should be tested with representative incidents rather than judged from a feature list.
Teams should also request a clear explanation of capacity and commercial structure because public pricing generally isn't listed. Use a pilot to measure detection quality, lineage usefulness, and the effort required to tune noisy alerts. The Bigeye alternatives analysis can help frame that assessment against in-environment and in-database requirements.
Bigeye is a sensible candidate for regulated enterprises that want automated monitoring with lineage-assisted troubleshooting and strong security controls. It may be less attractive when teams require unrestricted record-level evidence during every investigation.

4. Acceldata
Acceldata combines data reliability monitoring with platform and workload visibility. It monitors pipelines, warehouses, and jobs across hybrid and cloud environments, while also providing spend and cost-optimization analytics. That pairing is valuable for platform leaders who don't want to treat reliability and consumption as separate management problems.
The practical question is whether an incident is caused by bad data, a failing workload, or a platform change that affects both. Acceldata's broader scope can help teams examine those relationships across environments rather than restricting the investigation to one orchestrator. Its ecosystem integrations and enterprise deployment options are suited to organizations with private infrastructure alongside cloud services.
A pipeline that completes successfully can still create an operational problem if its workload behavior, data delivery, or downstream consumption has changed.
The main limitation is scope. Packaging varies by product line, and pricing isn't public, so buyers need to define which reliability and FinOps capabilities they require. Smaller teams may pay for breadth they won't use, while large hybrid environments may value having fewer separate systems to operate.
Acceldata fits enterprises that want data observability and cost intelligence in the same operating model. It isn't the obvious choice for a team seeking only table-level freshness or validation checks. During evaluation, ask whether the platform can connect cost signals to the specific pipelines and datasets that generate operational impact, not merely display spend in a separate dashboard.
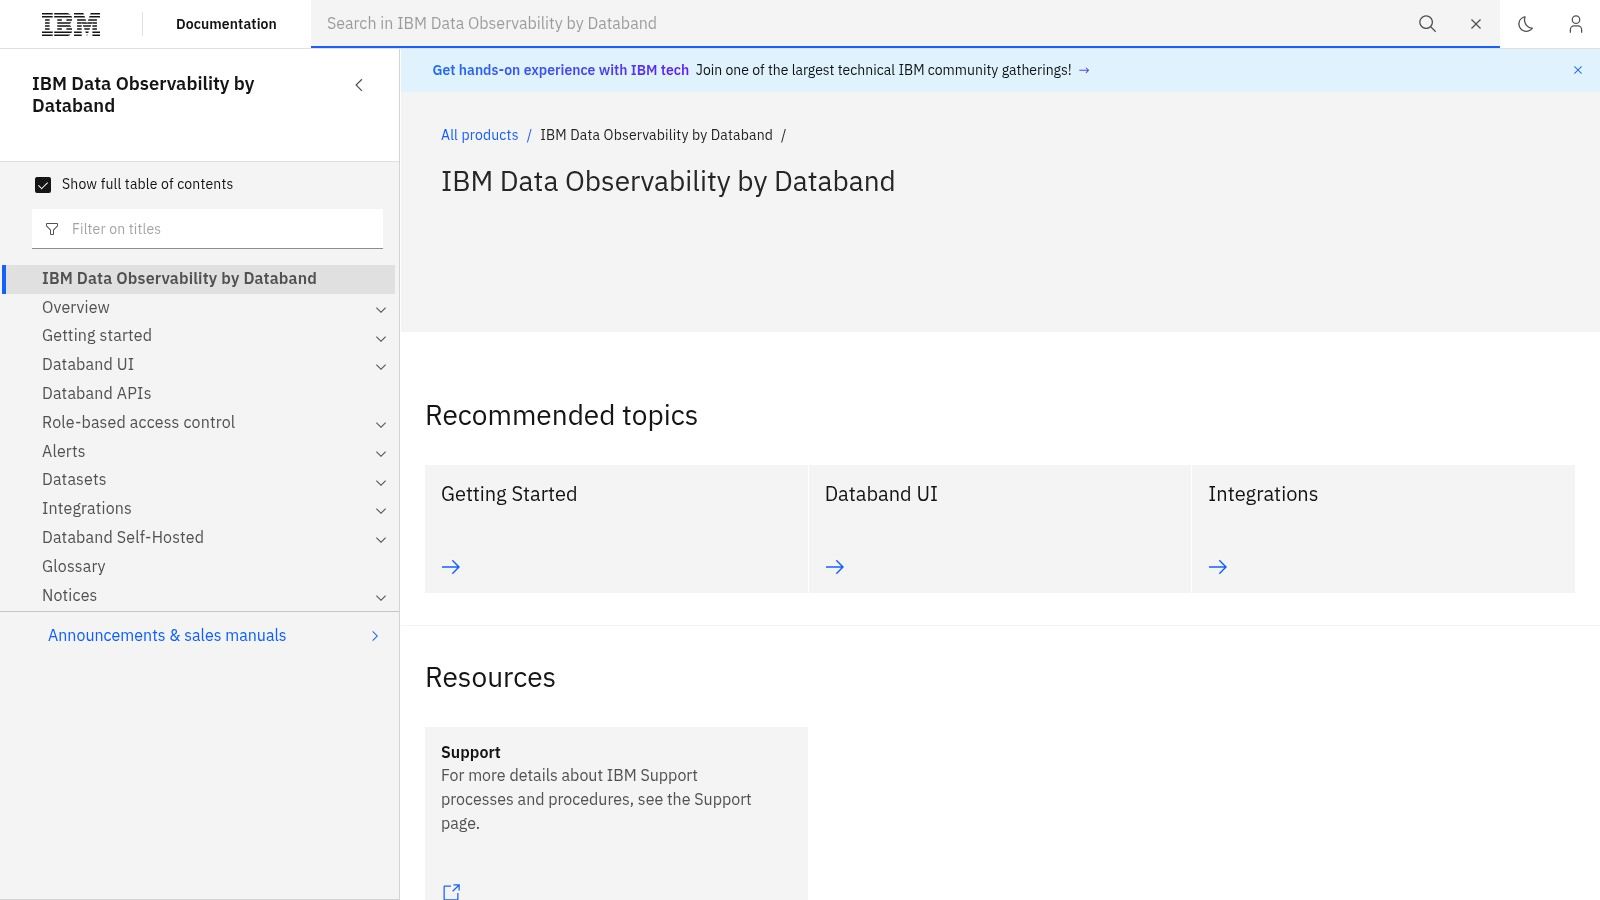
5. IBM Databand
IBM Data Observability by Databand monitors pipelines and collects metadata to identify freshness, volume, schema, and execution issues early. Its role is particularly clear in organizations already standardizing on IBM's data fabric, support model, or watsonx ecosystem. Procurement, security review, and lifecycle documentation can follow established IBM processes, which may reduce friction for an existing IBM customer even if it doesn't make the product the lightest option for a new buyer.
The platform can be deployed through SaaS or self-hosted paths, giving teams a choice between operational simplicity and tighter infrastructure control. It connects monitoring to orchestration and code metadata, helping engineers investigate whether a problem began in a task, transformation, dependency, or delivery stage.
Best fit and friction
IBM Databand is a rational selection when vendor consolidation matters. A data leader may prefer one enterprise relationship and support channel over a collection of specialized observability vendors. The same decision can be less attractive to teams that want a startup-style product cadence or narrowly focused workflows that evolve quickly around one monitoring problem.
Buying experience and packaging are tied to IBM programs, so prospective customers should clarify licensing boundaries, deployment responsibilities, and which capabilities are included. A proof of concept should test how quickly engineers can move from an alert to a usable explanation, especially across non-IBM tools.
The IBM Data Observability by Databand documentation is the appropriate starting point for confirming deployment and integration details. IBM Databand is strongest when the operating model already includes IBM support and data-platform services. It's less compelling when independence from a large vendor ecosystem is a primary requirement.
6. Soda
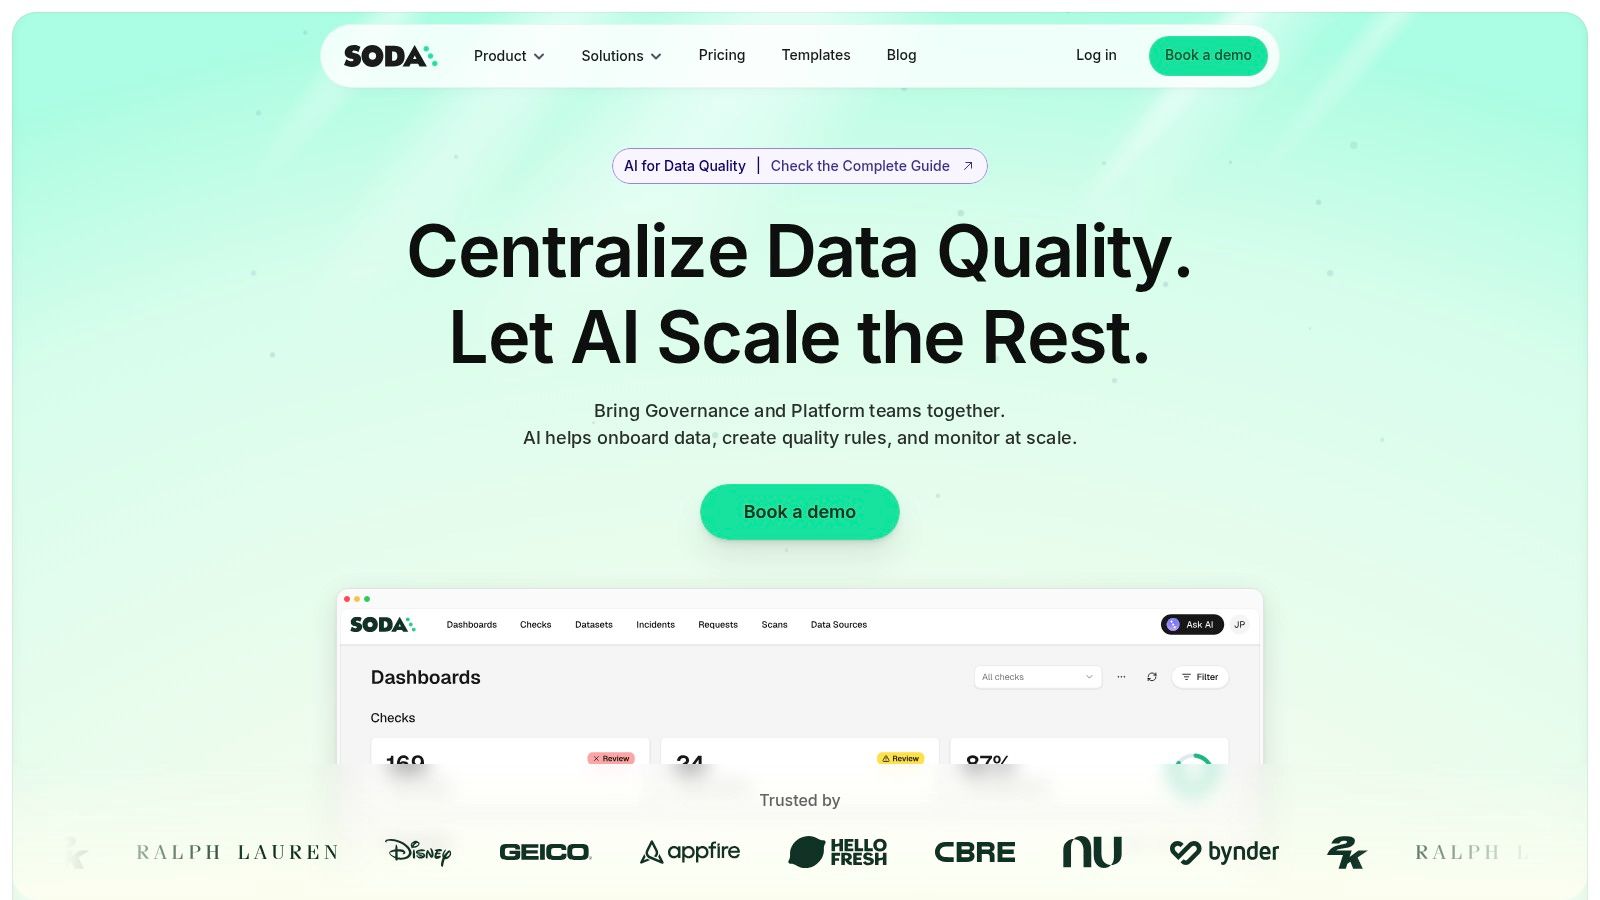
Soda is a strong option for teams that want monitoring to live close to development practice. Its model combines metric monitoring and anomaly detection with rule-based validation, data contracts, and test-as-code workflows. That makes it relevant when engineers want quality expectations reviewed alongside code, enforced in CI/CD, and carried into production monitoring.
The operational advantage is explicitness. A contract can state what a dataset is expected to contain, while metric monitoring can reveal behavior that no static rule anticipated. This combination is useful because a schema can remain technically valid while distributions, completeness, or business values shift in ways that affect analytics and AI.
Where process matters more than tooling
Soda supports managed and self-managed deployment models, which helps organizations with different privacy and governance requirements. Its documentation and developer-friendly workflows can shorten initial adoption. However, advanced capabilities may require managed or paid tiers, and data contracts require process alignment between producers and consumers. A team that doesn't have agreement on ownership may create tests without creating accountability.
The Soda alternatives guide provides a useful comparison point for teams deciding between code-centered validation and a broader in-database observability platform. Soda is best for engineering organizations prepared to treat data expectations as versioned, reviewable assets.
Soda's data quality platform is less suitable when analysts and governance users need a single monitoring interface without participating in a test-as-code operating model. Before buying, confirm how contract failures are routed, whether teams can suppress duplicate alerts, and how production evidence is retained for audits.
7. Anomalo
Anomalo learns table-level baselines and uses unsupervised detection to find unusual behavior without requiring extensive manual rule writing. It also supports validation, schema, freshness, and volume checks, with segmentation that can reveal whether an anomaly is concentrated in a particular slice of data. That matters when aggregate totals look normal but one region, product, customer segment, or source system has changed materially.
The platform's explainable root-cause hints are central to its value. An alert that says a table is unusual is only an observation. An alert that shows which dimensions, fields, or segments contributed to the deviation gives an engineer a starting point for investigation and helps data owners decide whether the change is expected.
The data-curation requirement
Anomalo delivers its strongest results when data domains are well curated. Teams still need clear ownership, meaningful table definitions, and a process for marking legitimate business changes. Machine learning can reduce rule maintenance, but it doesn't eliminate the need to explain why a pattern is expected or whether a detected shift matters to a downstream decision.
The platform is priced for mid-sized and large enterprises, so buyers should evaluate it against the cost of manual investigation and rule maintenance in their own environment rather than assuming that automation alone justifies adoption. Anomalo is a good fit for organizations prioritizing ML-driven detection and explainable investigation across warehouse data.
For teams with inconsistent ownership or poorly defined critical datasets, the first project may need to improve data curation before the platform can produce consistently actionable alerts.
8. Kensu
Kensu takes an engineering-centric approach by instrumenting data applications and connecting runtime information to lineage, impact analysis, and alerting. Rather than treating the warehouse as the only place where quality becomes visible, it emphasizes observability from inside applications and data products. That can help teams identify an issue before it propagates through multiple transformations and consumers.
The model suits organizations where data products are built and operated like software. Developers can use instrumentation and dependency mapping to understand how application behavior affects data outputs, while security and legal artifacts support enterprise adoption. This is particularly useful when a team needs observability tied to the code and services producing data, not just scheduled table checks.
A narrower ecosystem to validate
Kensu's developer focus is also its key evaluation point. Teams should confirm how its agents fit their languages, runtimes, orchestration systems, and deployment standards. A smaller ecosystem than some category leaders may not matter to a focused data-product group, but it can create integration work in a broad enterprise with many pipeline technologies.
Pricing isn't publicly listed, so proof-of-concept work and a quote are likely parts of the buying process. Test whether impact analysis changes incident decisions, whether instrumentation adds operational overhead, and whether non-engineering users can interpret the resulting evidence.
Kensu is best suited to data product teams that want in-application observability and developer-friendly context. It may not be the first choice for governance-led organizations seeking a broad, table-centric monitoring rollout with minimal instrumentation.
9. Lightup
Lightup focuses on automated data quality monitoring, anomaly detection, and remediation workflows across structured and unstructured data. Its monitoring includes timeliness, freshness, schema, and rule checks, while support for GenAI and LLM use cases expands its relevance for teams preparing data beyond conventional BI pipelines.
The operational strength is the connection between detection and action. Remediation guidance and integrations can reduce the manual work required after a quality issue is identified. For enterprise teams managing large or regulated environments, that workflow orientation is more valuable than another dashboard that only records that a check failed.
Evaluate remediation, not just detection
AI-based detection can identify patterns that deterministic rules miss, but the team still needs to decide which changes should trigger a page, a ticket, or analyst review. Buyers should test whether Lightup's remediation workflows preserve the original evidence, document the action taken, and avoid applying an automated correction where the business meaning is uncertain.
Pricing is sales-led and not published, and the community footprint is smaller than that of some early category leaders. Those factors make implementation support, integration coverage, and product responsiveness important evaluation criteria.
Lightup fits organizations that want anomaly detection paired with remediation workflows and emerging data use cases. It may be less suitable for teams that prefer to build all quality enforcement into code or keep monitoring narrowly focused on warehouse tables.

10. Datafold
Datafold is a developer-first choice for preventing unintended changes during ETL and ELT development. Its data diff compares values across environments or databases, exposing precise deltas that may otherwise reach production unnoticed. Column-level lineage, impact analysis, testing, and CI/CD integration extend that workflow from comparison into change management.
This is especially useful during migrations, refactors, and transformation rewrites. A pipeline can pass its existing tests and still alter values, joins, filters, or aggregations in ways that affect consumers. A value-level diff gives developers evidence about what changed, which makes it easier to approve a migration or isolate the transformation responsible for a regression.
Prevention is not continuous observability
Datafold's strength also defines its boundary. It is excellent for validating changes before or around deployment, but it isn't a complete replacement for broad anomaly monitoring in every stack. Teams still need a separate approach for ongoing timeliness, behavioral drift, unexpected business movement, and operational incidents after code has shipped.
That distinction makes Datafold complementary to many observability platforms rather than a direct substitute. The data reconciliation meaning guide offers useful context for understanding where comparison-based validation belongs in a broader reliability program.
Datafold is a strong fit for teams prioritizing migration safety, pre-merge checks, and precise regression diagnosis. Pricing is custom and sizing may depend on users and tables, so buyers should model the cost of applying diffs to the environments and datasets that matter most.
Top 10 ETL Monitoring Tools, Feature Comparison
Product | Core capabilities & unique selling points (✨) | UX / Quality (★) | Target audience (👥) | Pricing & value (💰) |
|---|---|---|---|---|
digna 🏆 | In‑database execution; AI baseline anomalies, Timeliness, Validation, Schema Tracker; sovereign private‑cloud/on‑prem, modular platform ✨ | ★★★★★, fast TTV (<2 hrs), enterprise scale | 👥 Regulated enterprises (Finance, Healthcare, Telco, Public), data teams | 💰 Modular: base + per‑active‑table; transparent, no API/alert surcharges |
Monte Carlo | End‑to‑end observability; column‑level lineage, incident triage, RCA workflows ✨ | ★★★★, mature UX for incident mgmt | 👥 Large heterogeneous stacks, ops & analytics teams | 💰 Enterprise pricing (sales‑led); strong integration value |
Bigeye | Automated monitors + lineage‑enabled RCA; governance & security focus ✨ | ★★★★, solid OOTB coverage | 👥 Regulated orgs needing compliance & lineage | 💰 Sales‑led; capacity/packaging negotiated |
Acceldata | Reliability + FinOps (cost optimization); pipeline & workload visibility ✨ | ★★★★, enterprise dashboards & analytics | 👥 Large/hybrid environments, platform teams | 💰 Custom pricing; good for reliability + cost control |
IBM Databand | Pipeline freshness, metadata collection, orchestration-aware RCA; IBM ecosystem integration ✨ | ★★★★, IBM support & enterprise processes | 👥 IBM‑centric enterprises, teams standardizing on IBM stack | 💰 Packaged via IBM procurement; flexible deployment options |
Soda | Test‑as‑code + data contracts, metric monitoring, flexible deployments ✨ | ★★★★, developer‑friendly, quick time‑to‑value | 👥 DevOps/data teams adopting data contracts & CI/CD | 💰 Freemium/managed tiers; advanced features in paid plans |
Anomalo | ML‑first unsupervised anomaly detection, explainable RCA, deep warehouse integrations ✨ | ★★★★, reduces rule writing, good RCA | 👥 Mid/large enterprises wanting ML‑driven detection | 💰 Enterprise‑oriented pricing (sales‑led) |
Kensu | Real‑time instrumentation, lineage & in‑app observability, impact analysis ✨ | ★★★, developer/engineering focused UX | 👥 Data product & engineering teams needing in‑app observability | 💰 Custom pricing; POCs common |
Lightup | AI anomaly detection + automated remediation workflows; supports unstructured/GenAI data ✨ | ★★★★, strong remediation guidance | 👥 Large enterprises with remediation needs & GenAI use cases | 💰 Sales‑led pricing; enterprise packages |
Datafold | Value‑level data diffs, pre‑merge checks, CI/CD & migration validation ✨ | ★★★★, developer tooling, precise deltas | 👥 Engineering teams focused on change mgmt & migrations | 💰 Custom pricing; often sized by users/tables |
Choose the Tool That Matches Your Operating Model
The right ETL monitoring tool depends on the failure your team needs to solve first. If late or missing loads are disrupting reporting, prioritize expected-delivery monitoring and timeliness SLOs. If pipelines complete while dashboards or models become unreliable, prioritize behavioral anomaly detection, validation, and business metrics. If deployments and migrations create regressions, a developer-oriented tool such as Datafold may deliver more value than a platform focused mainly on runtime alerts.
Buyers should compare anomaly coverage, timeliness handling, schema-drift detection, validation depth, execution location, deployment model, integration workflows, pricing structure, and operational ownership. These dimensions expose differences that vendor feature lists conceal. A platform may detect a schema change but provide little downstream context. Another may offer strong lineage but require more stakeholder alignment. A managed service may reduce infrastructure work while creating data-movement concerns. A self-hosted system may satisfy sovereignty requirements while adding deployment and maintenance responsibilities.
Timeliness deserves special attention. Practical benchmark targets include freshness-SLA adherence above 99%, MTTD below 15 minutes, MTTR below 120 minutes, daily on-time refresh rates between 95% and 99%, pipeline availability of 99.9%, and transformation error rates below 0.1%, with sustained rates above 5% indicating a strong systemic-failure signal, as described in ETL pipeline benchmarking guidance. These are evaluation targets, not universal guarantees. Teams should adapt them to delivery windows, business impact, and the difference between critical and low-risk datasets.
Alert design can determine whether any tool improves operations. Google's SRE monitoring guidance recommends percentile measurements for latency because averages can hide slow tail behavior. For data platforms, median arrival time can describe normal delivery while p95 or p99 arrival latency reveals the smaller share of tables that arrive too late for important consumers. Google's practical alerting guidance also recommends keeping an alert condition true for at least two evaluation cycles. A 15-minute check would therefore hold a persistent condition for roughly 30 minutes before notifying responders. The exact interval should reflect the dataset's delivery pattern and blast radius.
The economic case for earlier detection is substantial, even though breach research isn't a direct study of ETL failures. IBM analyzed 600 organizations affected between March 2024 and February 2025 and reported a global average breach cost of USD 4.44 million, with the United States reaching USD 10.22 million. Organizations took an average of 241 days to identify and contain incidents, while incidents lasting more than 200 days averaged USD 5.01 million. Detection and escalation alone averaged USD 1.47 million, according to IBM's 2025 Cost of a Data Breach research. The lesson for ETL monitoring is directional: delayed detection increases exposure, remediation time, and the number of downstream decisions made with unreliable data.
Distributed architectures make that problem harder. IBM reports that 30% of breaches involved data spread across multiple environments, with those incidents averaging USD 5.05 million and 276 days across the lifecycle. The same research reports personally identifiable information in 53% of breaches, while healthcare breaches averaged USD 7.42 million and took 279 days to identify and contain. Those findings support continuous, auditable controls across heterogeneous environments, especially for regulated data. They don't prove that one observability product will prevent a breach, but they do show why monitoring design must account for data location, sensitivity, handoffs, and response evidence.
digna is the relevant option for teams prioritizing in-environment, in-database monitoring across timeliness, anomalies, validation, schema tracking, and platform metrics. Its private cloud and on-premises deployment model, modular licensing, and lack of API-call, scan, or alert-volume surcharges address sovereignty and usage-control concerns. Its per-active-table, per-module model still requires careful cost modeling at large scale, and customer teams must own the infrastructure and security work associated with deployment.
Other tools may be a better fit when the operating model points elsewhere. Monte Carlo and Bigeye suit organizations that put lineage and enterprise incident workflows first. Acceldata is relevant when reliability and platform-cost intelligence belong together. IBM Databand fits IBM-centered estates. Soda suits test-as-code and data-contract programs. Anomalo emphasizes ML-led warehouse anomaly detection, Kensu emphasizes application instrumentation, Lightup connects detection with remediation, and Datafold focuses on change validation.
A disciplined selection process should measure before-and-after performance rather than dashboard count. Track incident volume, business-detected incidents, MTTD, MTTR, false-positive rate, and the percentage of critical tables covered. Alert fatigue is a serious design risk. A 2025 observability survey of 1,255 practitioners identified it as the leading obstacle to faster incident response, nearly twice as prominent as the next obstacle, while respondents reported observability consuming an average of 17% of technology budgets. The survey also found cost important to three-quarters of organizations, as documented in Grafana's observability survey takeaways. More checks aren't automatically better if noise grows faster than actionable detection.
Finally, treat data fitness as broader than pipeline uptime. The European Commission's GDPR principles identify accuracy and storage limitation as explicit requirements. AWS guidance on machine-learning monitoring distinguishes data drift from concept drift and supports comparing current distributions with training or reference data. A job can succeed technically while delivering data that is stale, structurally changed, statistically unusual, or no longer appropriate for a model, report, control, or customer-facing process. Choose the tool that gives your team the evidence and workflow needed to detect that specific failure, then expand coverage as ownership and operating maturity improve.
digna provides in-environment, in-database monitoring for data anomalies, timeliness, validation, schema changes, and platform metrics across warehouses, lakes, and heterogeneous pipelines. If your team needs ETL monitoring that preserves data sovereignty while connecting detection to practical incident workflows, visit digna to evaluate the platform.
If late or missing loads are the first failure your team needs to solve, see how digna Timeliness learns delivery patterns and flags delayed data before a reporting deadline is missed.
Frequently asked questions
Why isn't a successful ETL job run enough to trust the data?
A completed run only proves that the orchestrator reached the end of its execution path. The job can still load the wrong record set, arrive after a reporting deadline, accept an unexpected schema, or produce plausible values that break a model without raising an obvious error.
What benchmark targets should ETL monitoring aim for?
Practical targets include freshness-SLA adherence above 99%, MTTD below 15 minutes, MTTR below 120 minutes, daily on-time refresh rates of 95% to 99%, and pipeline availability of 99.9%. Treat them as evaluation targets rather than guarantees, and adapt them to each dataset's delivery window and business impact.
How should alerts for late data be designed to avoid noise?
Measure arrival latency with percentiles instead of averages, because p95 or p99 exposes tables that arrive too late while the median still looks normal. Following Google's SRE guidance, keep a condition true for two evaluation cycles, so a 15-minute check waits roughly 30 minutes before notifying responders.
Which ETL monitoring tool suits data that must stay on-premises?
digna fits that requirement, since it runs in a private cloud, VPC, or on-premises environment and executes checks in-database, so production data stays inside your systems. The trade-off is ownership, because the customer team handles the infrastructure and security work that an outsourced service would otherwise cover.
Is Datafold a replacement for continuous data observability?
Not entirely. Datafold excels at value-level data diffs, pre-merge checks, and migration validation, but teams still need a separate approach for ongoing timeliness, behavioral drift, and operational incidents after code ships. The article positions it as complementary to observability platforms rather than a direct substitute.


