Data Maturity Assessment: A Step-by-Step Guide
|
7
min read

The most popular advice about data maturity assessment is also the least reliable: send a survey, average the answers, and place the organization on a maturity ladder. That approach produces a tidy score, but it often fails the first serious question from an executive, auditor, regulator, or AI program owner: what evidence supports the rating?
A useful assessment is not a one-time questionnaire. It's a continuously verified control system that compares what teams report with what their data environment does. The score matters, but only when it connects to observable signals such as anomalies, delivery timeliness, validation results, and schema changes.
Table of Contents
Why Most Data Maturity Scores Do Not Survive Scrutiny
The score is a hypothesis
Choosing a Maturity Framework That Fits Your Reality
Three useful model families
Pick deliberately, then adapt
Designing the Assessment So the Score Is Defensible
Combine four evidence sources
One score or a capability profile
Replacing Self-Reporting with Operational Evidence
Validate the records and the structure
Interpret the gap, don't average it away
Running the Assessment and Turning Scores into a Gap Analysis
Use interviews to test assumptions
Convert findings into decisions
How Maturity Looks Different by Sector
Turning the Assessment into a Roadmap You Can Actually Run
Keep the score alive
Why Most Data Maturity Scores Do Not Survive Scrutiny
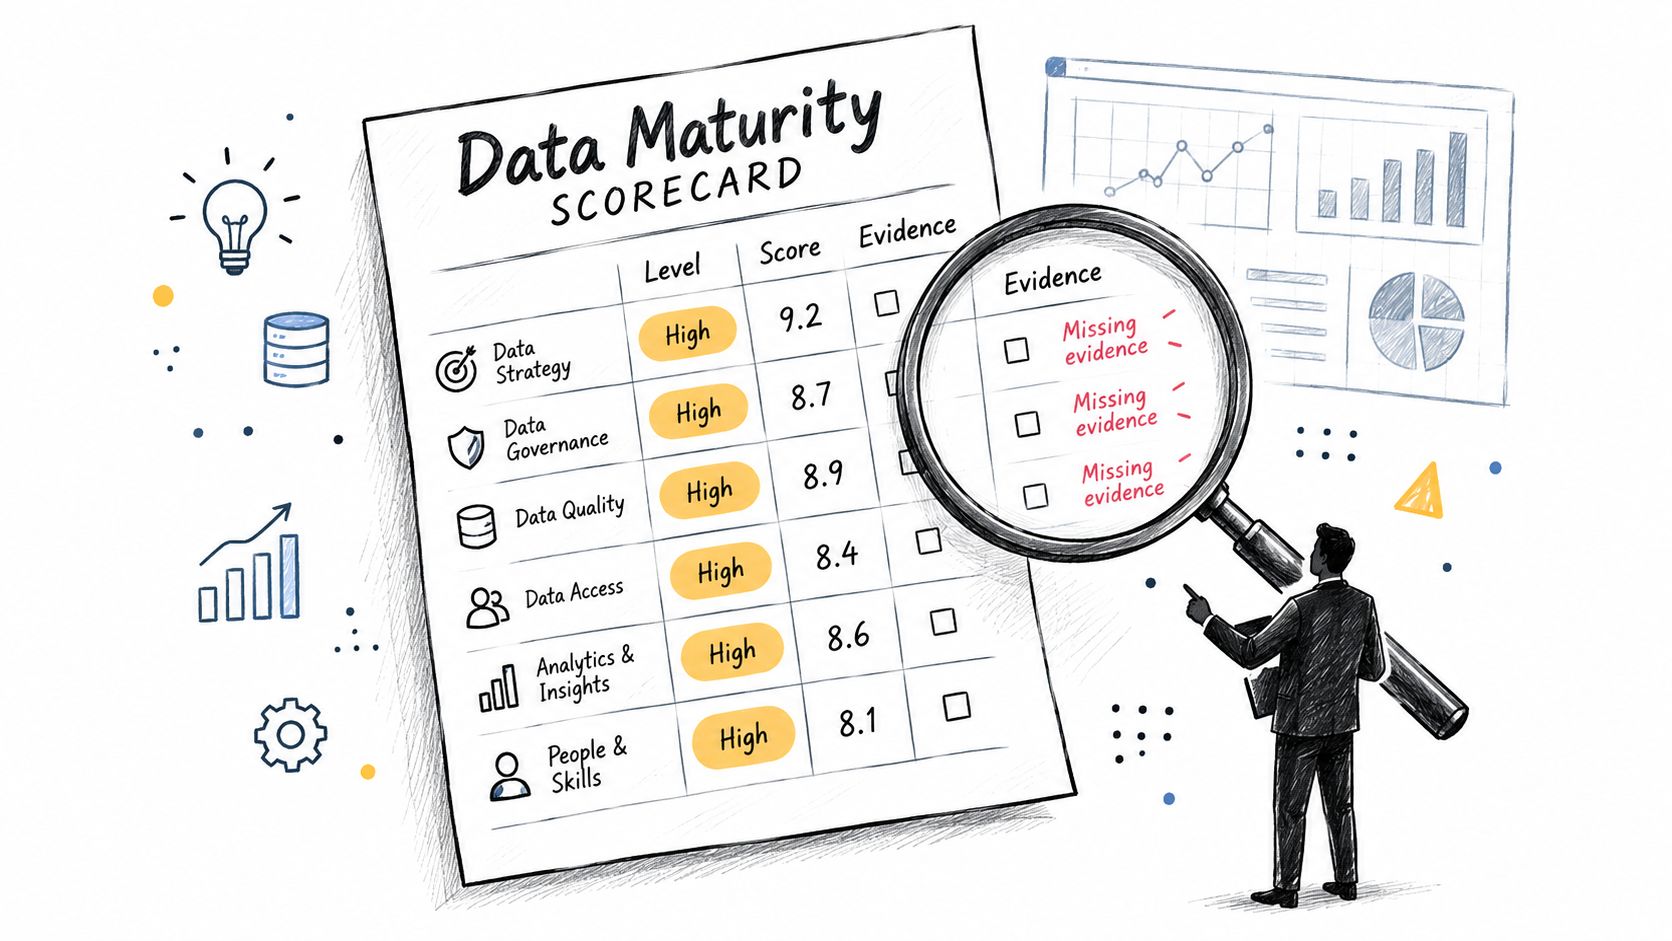
Self-reporting is useful for finding perceptions, expectations, and areas that deserve investigation. It isn't reliable as the sole measure of operational readiness. Teams often score a capability according to whether a policy exists, while an executive or regulator wants to know whether that policy is applied consistently to critical data.
The gap can be substantial. One 2026 industry guide on data maturity roadmaps reports that 68% of organizations overestimate their maturity in self-assessment, while a 2025 enterprise study found that 83% of organizations reported data governance and compliance challenges even though they rated governance maturity at 4.13 out of 5. Those findings don't prove that every survey is misleading, but they show why a confident score can coexist with weak controls.
The score is a hypothesis
A maturity rating should be treated as a hypothesis about how the organization operates. The assessment team then tests that hypothesis against artifacts, system behavior, and stakeholder experience.
Ask what would remain if the survey responses disappeared. You should still be able to inspect ownership records, validation outcomes, incident histories, delivery patterns, lineage documentation, access reviews, and evidence that teams resolved known issues. If the rating depends entirely on what people say they do, it describes confidence, not maturity.
This distinction is especially important when an AI initiative uses maturity as a gate. A team may claim that data is governed, but the gatekeeper needs proof that critical fields are defined, data arrives when expected, structural changes are detected, and business rules are enforced. A high-level score without that evidence creates false confidence at precisely the point where errors become expensive or consequential.
Practical rule: Never award a maturity level for a documented capability until you can identify the operational evidence that shows the capability working.
The fix is to build an auditable baseline. Start with a framework that fits the decision you need to make, define explicit scoring rules, collect perspectives beyond the data team, and verify claims with production evidence. Teams that need a more detailed treatment of organizational failure patterns can also review these structural fixes for failed data quality projects.
The result should be more than a number. It should show where maturity exists, where it is claimed but unproven, and which controls would change the rating. That makes the assessment useful for prioritization instead of turning it into another presentation slide.
Choosing a Maturity Framework That Fits Your Reality
A maturity framework is a measurement design, not a universal truth. Choose it according to the decision the assessment must support. A regulatory readiness review needs different emphasis from an AI approval gate or an operational reliability program.
Begin by writing the trigger in one sentence. “We need to demonstrate accountable governance for regulated reporting” points toward a governance-heavy model. “We need to decide whether a machine learning use case can proceed” requires stronger treatment of data quality, controls, people, and AI maturity. “We need reliable operational reporting” puts more weight on timeliness, validation, pipeline behavior, and incident response.
Three useful model families
Governance-oriented models divide the problem into named capabilities. One widely cited structure includes vision, strategy, metrics, information governance, organization and roles, information lifecycle, and infrastructure enablement, as described in this governance maturity model overview. This family works well when accountability, decision rights, lifecycle controls, and auditability are the main concerns.
A leaner model can be easier to use with business stakeholders. Data.org's Data Maturity Assessment framework separates maturity into Strategy, Practice, and People. Strategy addresses what the organization wants data to accomplish, Practice addresses how it uses data to achieve its mission, and People addresses who works with data and makes decisions. Its AI section is scored separately, so an organization can have distinct data and AI maturity results rather than one blended rating.
Composite models separate the level dimension from the domain dimension. A systematic review of maturity models found that levels are commonly measured on a discrete scale, often from 1 to 5, while domains tend to cluster into technology-oriented, data-oriented, and organization-oriented groups. This structure helps answer two different questions: how advanced are we, and in which capability?
Pick deliberately, then adapt
Don't copy a framework unchanged. Map each dimension to a decision, an accountable owner, and a form of evidence. If a dimension can't influence a roadmap choice or be tested through artifacts and system behavior, it may not belong in the first assessment.
A practical governance reference should also clarify policies, responsibilities, access, retention, and escalation. A resource on data governance by WebscrapingHQ is useful when translating broad governance expectations into policy components and examples.
For a quality-led program, use a framework that connects maturity to critical data elements, acceptable quality definitions, triage, resolution, and active controls. A data quality maturity model can help organize those questions without pretending that governance maturity and data quality maturity are interchangeable.
Shortlist one primary framework and, if necessary, one supplementary model. Keep the primary score understandable. Use the supplementary dimensions to expose gaps rather than creating a complicated composite number that nobody can explain.
Designing the Assessment So the Score Is Defensible
A defensible assessment starts with a scoring contract. Before you interview anyone, define the dimensions, the evidence required at each level, the scoring scale, and what happens when reviewers disagree. Without that groundwork, the loudest stakeholder usually shapes the result.
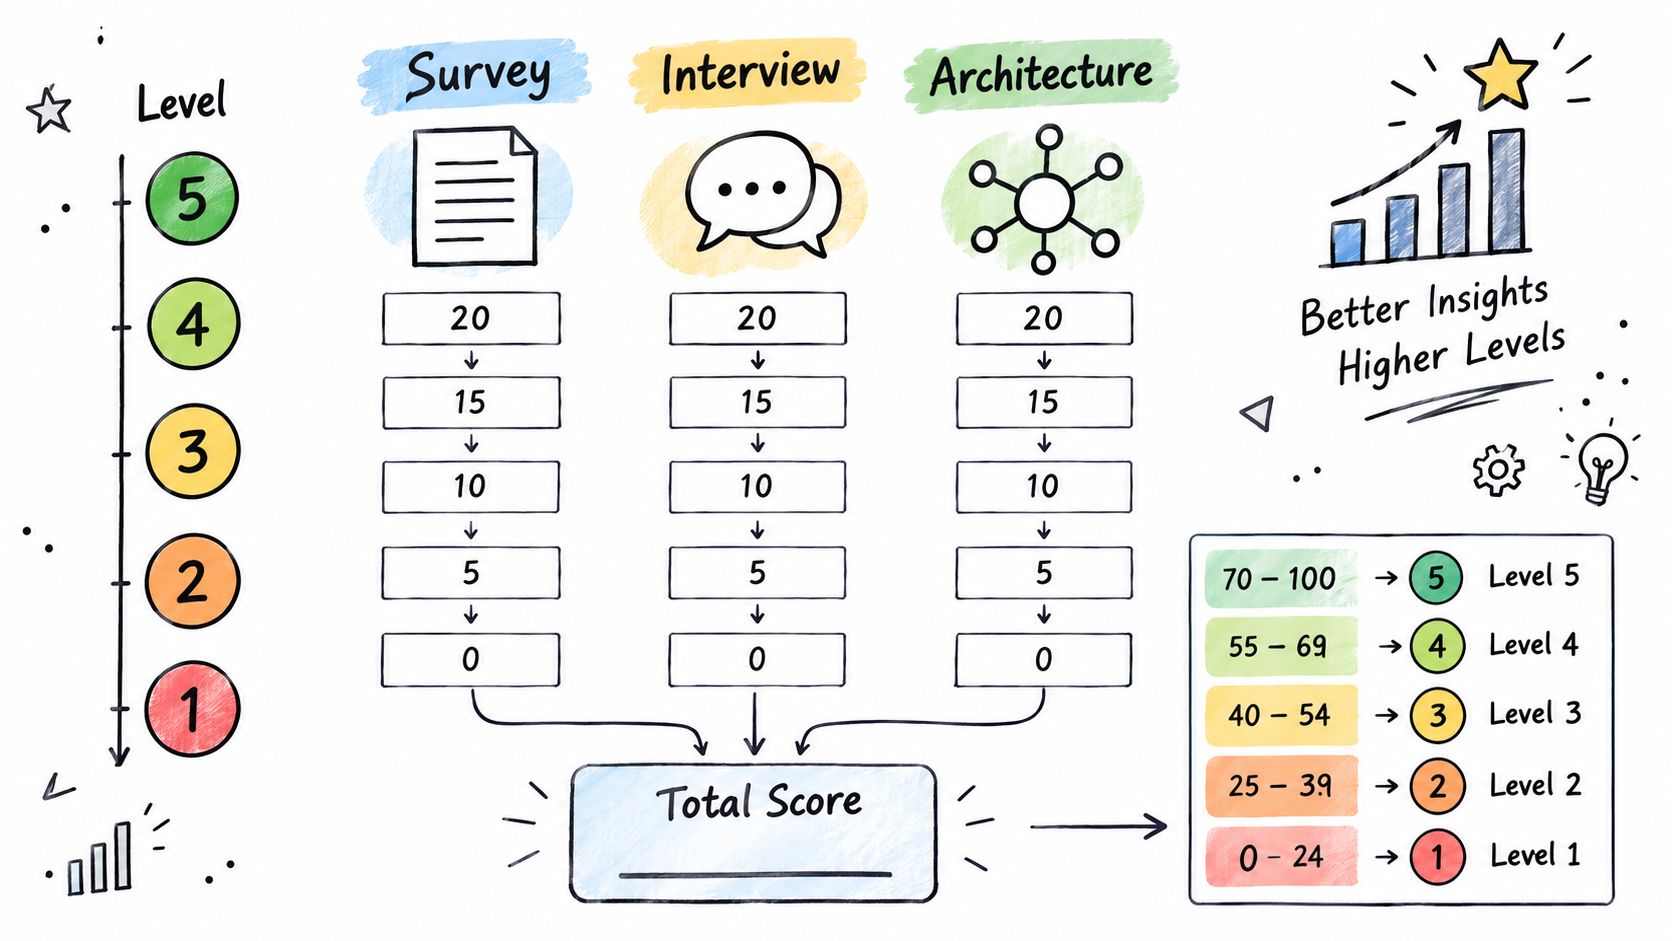
Use a discrete scale that is simple enough to repeat and detailed enough to separate real progress from cosmetic change. Five levels are common, but the labels matter less than the evidence behind them. A lower level might show informal, person-dependent practice. A middle level should require documented ownership and repeatable controls. A higher level should require measured performance, exception handling, and ongoing improvement.
Combine four evidence sources
A reliable data maturity assessment should combine surveys, stakeholder interviews, architecture review, and evidence-based scoring. The practical maturity scoring guidance shows a stepwise approach and uses a UN Statistics Division example that scores six characteristics, sums essential measures, and maps the result into levels with explicit thresholds such as Level 1 at 1.5 and Level 4 at 7.5.
Do not copy those thresholds blindly. Make the arithmetic visible. Another reviewer should be able to see which measures produced the score, which evidence was missing, and how the total mapped to a level.
A useful assessment record contains:
Dimension definition: State exactly what the capability covers and what it excludes.
Level criteria: Describe observable behavior at each level, not vague aspirations.
Evidence register: Record the artifact, system signal, owner, date, and validation status.
Scoring rule: Explain how scores are combined and how missing evidence is treated.
Challenge process: Give stakeholders a way to dispute a rating with evidence.
One score or a capability profile
A single enterprise score helps leadership understand direction, but it hides unevenness. One company may have strong information governance and weak data quality. Another may have strong engineering practice but unclear ownership. Averaging those conditions can make the organization look healthier than the capability that matters most.
Use a multi-pillar profile for diagnosis, then calculate an overall score only when leadership needs a summary. Keep the pillars visible beside the summary. If a critical dimension has no evidence, mark it as unverified instead of letting strong scores elsewhere compensate for it.
The assessment should be repeatable by another reviewer. If two reviewers use the same criteria and inspect the same evidence, they should reach comparable conclusions. That is what turns a maturity score from an opinion into an auditable management instrument. For teams formalizing that evidence trail, see our guide to auditing data quality.
Replacing Self-Reporting with Operational Evidence
Operational evidence is the verification layer between what an organization claims and what its data environment demonstrates. It doesn't eliminate interviews or surveys. It gives those inputs a reality check.
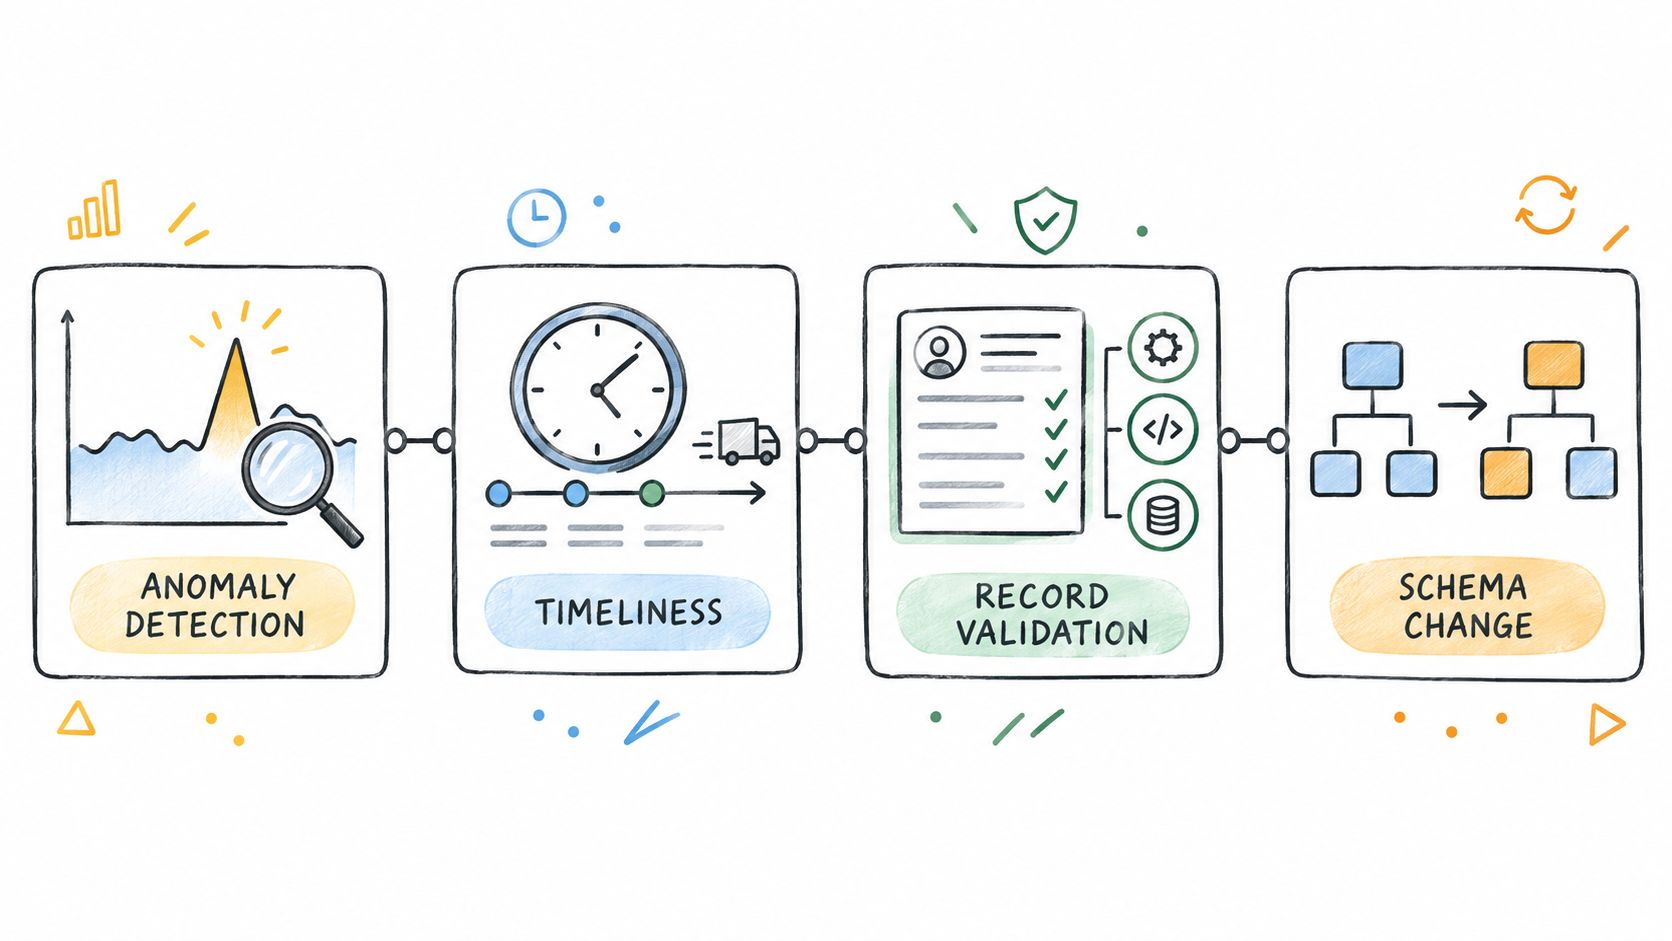
Start with anomaly detection. A team may report that it monitors data quality, but the practical question is whether it can distinguish normal variation from unusual behavior. Learned baselines can reveal unexpected shifts in volumes, distributions, null patterns, or business metrics without relying only on manually authored rules.
Timeliness monitoring tests a different claim. If a critical dataset is expected before a reporting process begins, measure when it normally arrives and flag missing, delayed, or unusually early deliveries. Expected delivery estimates are more useful than a generic “pipeline succeeded” status because a technically successful load can still arrive too late for its business purpose.
Validate the records and the structure
Record-level validation shows whether the organization enforces business meaning. Examples include checking that dates follow an allowed relationship, identifiers meet required formats, totals reconcile, or status fields agree with associated events. The exact rules depend on the domain, but the evidence should show which records failed, why they failed, who owns remediation, and whether the issue was resolved.
Schema change tracking verifies structural stability. Added or removed columns, changed data types, and other alterations can break downstream consumers even when a pipeline reports success. A mature control doesn't merely document the expected schema. It detects deviations and routes them to an accountable owner.
Interpret the gap, don't average it away
A high governance score with no production validation results is not a high level of operational maturity. It is a governance claim awaiting verification. Record the gap explicitly, because the gap itself is often the most valuable finding in the assessment.
The mismatch reported in a 2025 enterprise study on data governance maturity illustrates the problem: 83% of organizations reported data governance and compliance challenges, yet they rated governance maturity at 4.13 out of 5. The number is less important than the pattern. Self-confidence can remain high while operational controls produce contradictory signals.
A policy proves intent. A control result proves behavior.
For regulated environments, retain the evidence behind every material rating. That means storing the measurement definition, observation period, exceptions, remediation record, and decision made from the result. A continuously refreshed evidence trail is far more defensible than a survey that was accurate only on the day it was completed.
Running the Assessment and Turning Scores into a Gap Analysis
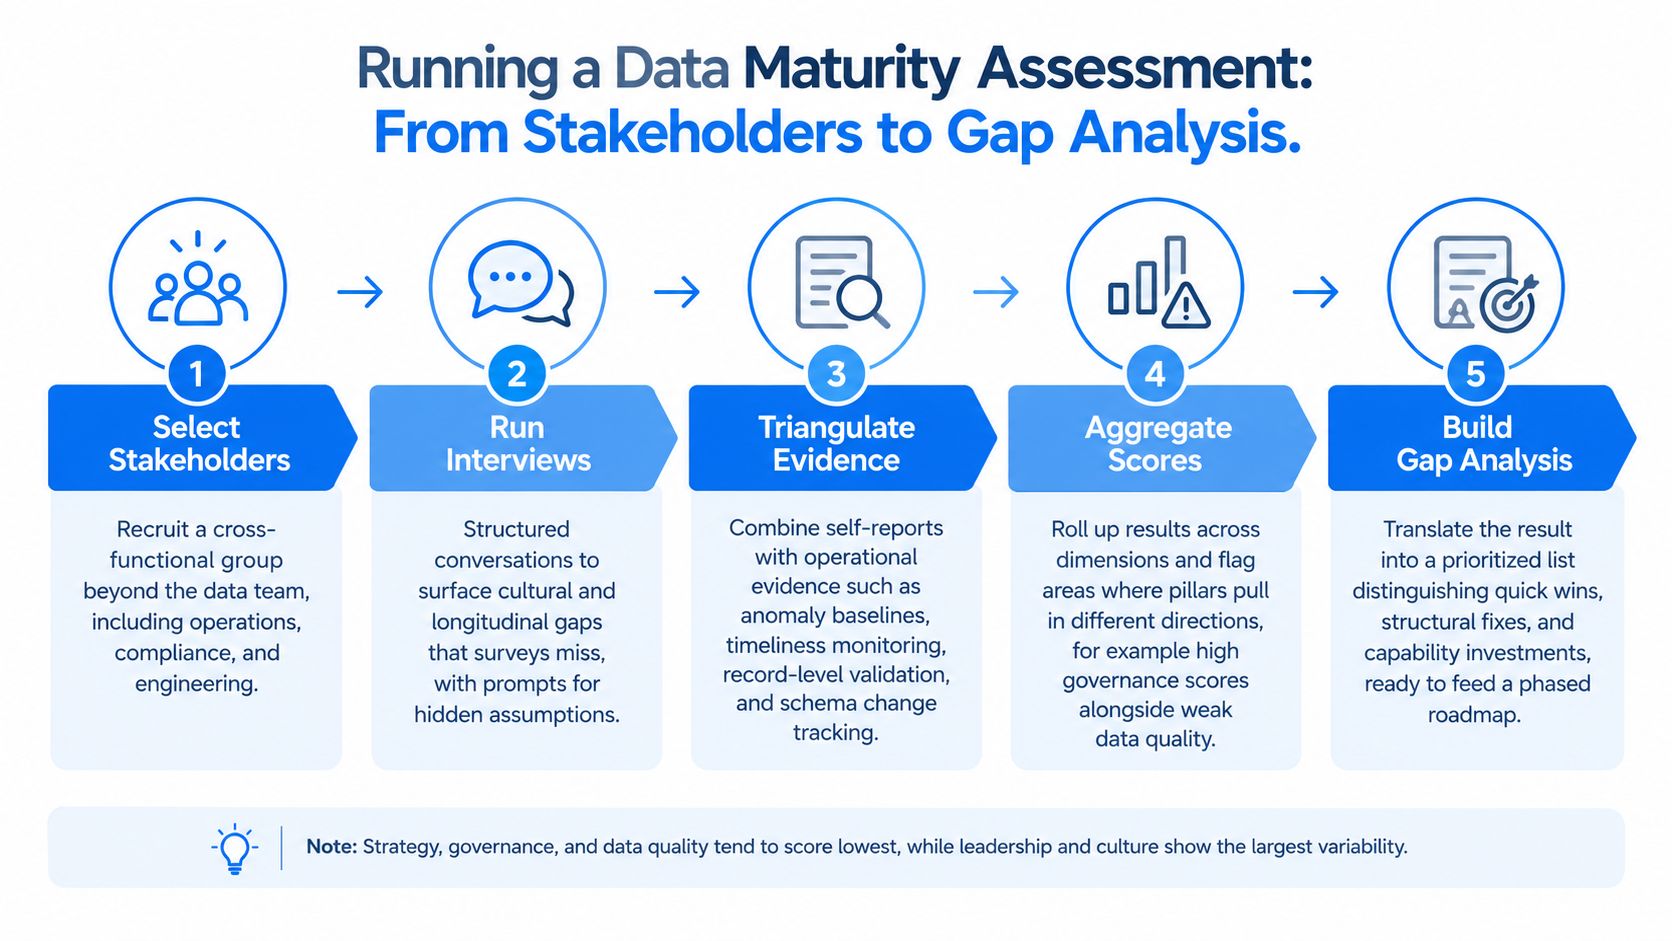
Run the assessment with the people who create, use, govern, and depend on data. The data team can explain architecture and pipelines, but operations understands workarounds, compliance understands exposure, and frontline users know which reports require manual correction.
Select participants across data engineering, analytics, business operations, security, compliance, finance, and executive sponsorship. Include owners of critical processes, not only owners of data platforms. A narrow participant group often produces a technically polished score that misses adoption, trust, and cultural friction.
Use interviews to test assumptions
Structure interviews around evidence rather than opinions. Useful prompts include:
Which datasets would stop a critical process if they became unavailable or unreliable?
Who decides whether a data issue is acceptable?
What happens when a validation check fails?
How does a user learn that a schema changed?
Which reports are corrected manually before publication?
What evidence would you show an auditor or AI review board?
How have controls changed over time, and who uses them in daily work?
These questions expose longitudinal and cultural weaknesses that a survey rarely captures. A mixed-methods study of long-term care organizations found that strategy, governance, and data quality were consistently low, while leadership and culture showed the largest variability, indicating that technical tooling alone doesn't explain maturity differences. The findings are a useful warning against treating maturity as an engineering-only problem.
After interviews, compare each claim with architecture artifacts and operational signals. Give each dimension a self-reported score, an observed score, and an evidence-confidence status. Don't hide disagreement by averaging immediately. A difference between the two scores is a finding that needs interpretation.
Convert findings into decisions
Aggregate scores by dimension and critical data domain. Then classify each gap according to the action it requires:
Quick wins: Make ownership explicit, document definitions, activate an existing control, or close an obvious evidence gap.
Structural fixes: Redesign workflows, establish decision rights, standardize validation, or connect issue management to accountable teams.
Capability investments: Build skills, change architecture, fund stewardship, or implement monitoring where no usable control exists.
A baseline study template can help organize dimensions, evidence, ownership, and priority without losing the distinction between reported capability and verified behavior.
The final output should be a gap register, not just a heatmap. For each finding, state the affected data or process, current evidence, business consequence, accountable owner, target state, and next decision date. That format gives leadership something to fund and gives delivery teams something to execute.
How Maturity Looks Different by Sector
The same maturity framework produces different priorities across sectors because the cost of failure differs. A financial services team may care most about traceability and transaction rules, while a telecom team may care more about volume behavior and pipeline reliability.
Sector | Dominant maturity dimensions | Evidence signals that matter most | Common maturity blind spot |
|---|---|---|---|
Financial services | Governance, traceability, transactional validation | Reconciliation results, rule failures, delivery status, schema changes | Treating documented controls as proof that critical transactions are controlled |
Healthcare | Data quality, timeliness, stewardship, clinical reliability | Record validation, missingness patterns, delivery delays, anomaly baselines | Focusing on platform availability while frontline users correct data manually |
Telecommunications | Operational reliability, engineering practice, monitoring | Volume anomalies, pipeline timeliness, structural changes, platform metrics | Assuming high-throughput pipelines are reliable because they complete successfully |
Public sector | Governance, consistency, auditability, cross-agency coordination | Evidence registers, validation outcomes, lineage, delivery and change history | Measuring agency capability independently while shared data definitions remain inconsistent |
The evidence types should follow the risk. Financial services needs rules that demonstrate whether records reconcile and whether changes are traceable. Healthcare needs signals that show whether information arrives in time for the process that depends on it. Telecommunications needs behavior monitoring across high-volume pipelines. Public sector teams need evidence that can be reviewed across organizational boundaries.
This is why a single linear enterprise roadmap is often misleading. A central data office may be mature in policy while a clinical, operational, or regulatory domain remains unverified. Score the enterprise, but maintain domain-specific paths and evidence requirements.
Turning the Assessment into a Roadmap You Can Actually Run
A roadmap should sequence decisions, not merely list capability gaps. Start with the risks that can block reporting, regulatory work, or an AI program. Then address the controls that make those risks observable before investing in broader operating-model changes.
Use three practical phases. Quick wins establish ownership, definitions, baseline measurements, and visible issue handling. Structural fixes connect governance decisions to workflows, validation, escalation, architecture, and accountable teams. Capability investment develops stewardship, engineering discipline, analytics practice, and the platform support needed to sustain the controls.
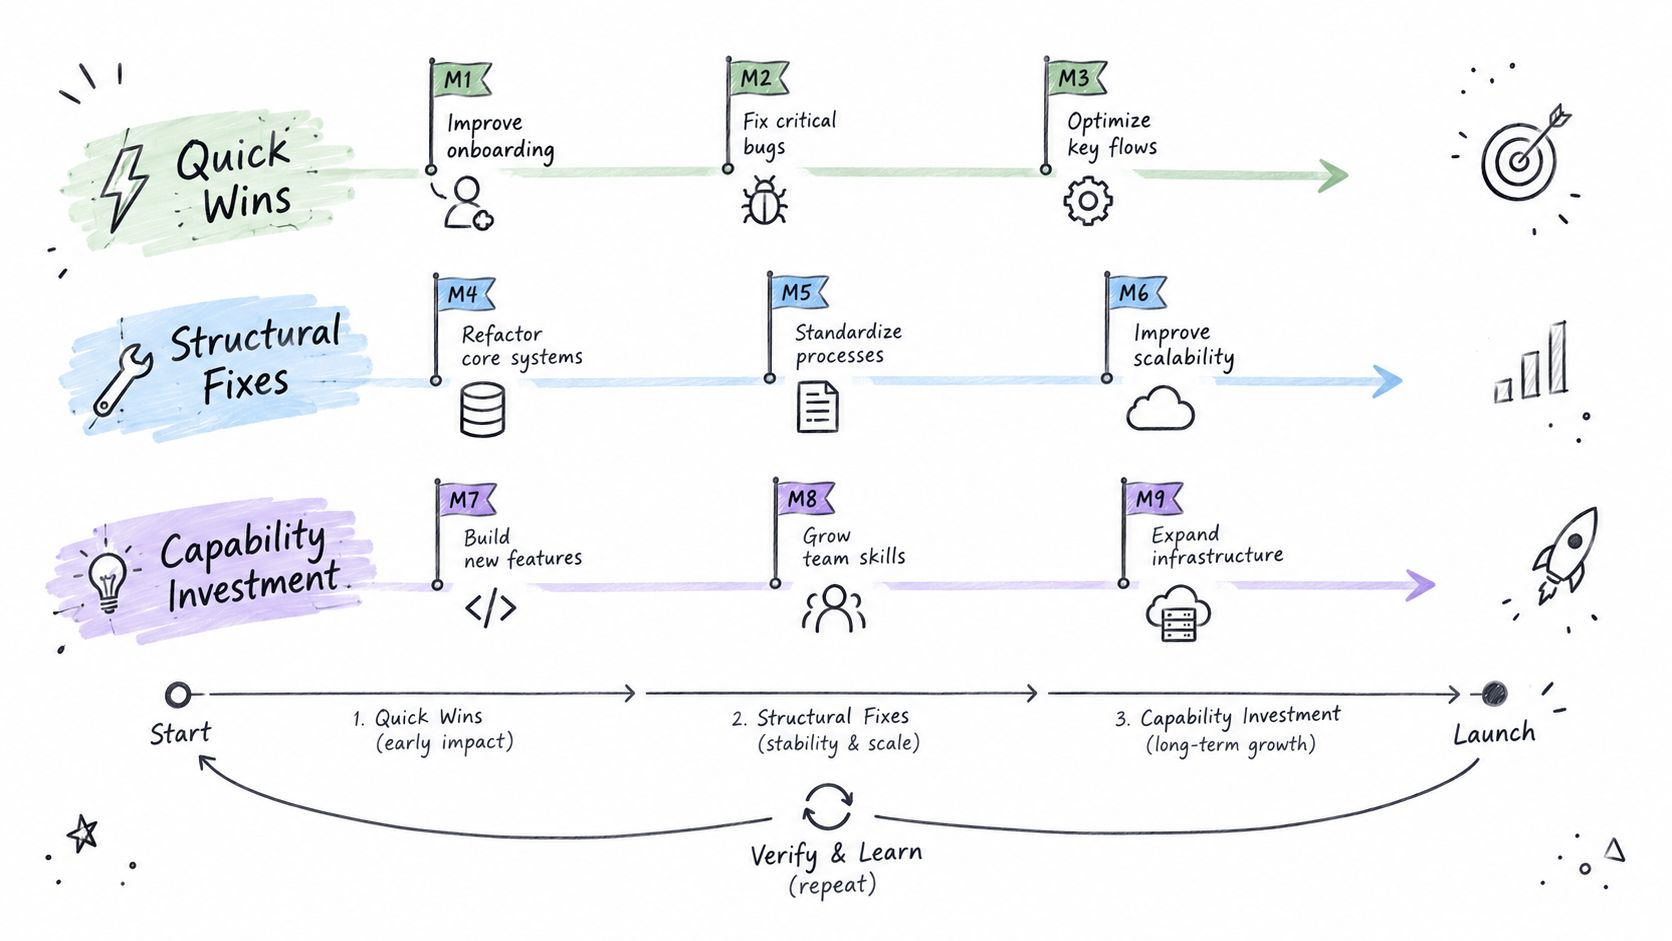
The roadmap must also answer the longitudinal question: how will practice improve across time and across frontline users, rather than only inside the central data team? Assign owners to evidence, review exceptions with the people who use the data, and make control results part of delivery and governance routines.
Data Orchard's 2025 State of the Sector report draws on five years of global assessment data across almost 20,000 users from over 1,200 organisations to produce 2024–2025 benchmarks. It reports that only 6% of 1,088 assessed organisations reached the highest “Mastering” stage. The practical implication is that maturity should be managed as a progression, not declared as a finished state.
Keep the score alive
Use anomaly, timeliness, validation, and schema monitoring as recurring evidence inputs. When those signals change, review the affected maturity dimension instead of waiting for the next annual survey. A governance strategy should define this relationship between policy, evidence, ownership, and review, and a data governance strategy resource can help structure that operating model.
A workable review cycle includes:
Baseline: Establish the initial score, evidence register, and priority gaps.
Control review: Check whether monitoring and remediation operate as designed.
Roadmap review: Reprioritize when risk, architecture, or business use changes.
Maturity reassessment: Re-score after enough evidence exists to demonstrate changed behavior.
The assessment earns credibility when the score changes because the operating reality changed, not because the organization became better at completing questionnaires. Build the evidence system first, then let the score report what it finds.
digna provides an enterprise data quality and observability platform that runs inside the customer's environment, with anomaly detection, timeliness monitoring, record-level validation, and schema change tracking for data used in analytics and AI. Visit digna to see how continuous operational evidence can turn a data maturity assessment into a defensible control system.
A maturity rating stays honest only when the evidence behind it keeps refreshing, which is why the assessment works best alongside automated data quality management that measures anomalies, timeliness, validation results and schema changes every day instead of waiting for the next round of self-reported scores.
Frequently asked questions
Why are self-assessed data maturity scores unreliable?
Teams tend to score a capability on whether a policy exists, not on whether it works for critical data. The article cites a 2026 guide in which 68% of organizations overestimated their maturity, and a 2025 study where governance was rated 4.13 out of 5 while 83% reported governance and compliance challenges.
Which framework should I use for a data maturity assessment?
Choose the framework that fits the decision the assessment must support. Governance-oriented models suit regulated reporting, Data.org's Strategy, Practice and People model works well with business stakeholders and scores AI separately, and composite models split level from domain. Map every dimension to an accountable owner and a form of evidence.
What evidence makes a data maturity score defensible?
Four combined sources: surveys, stakeholder interviews, architecture review and evidence-based scoring. Add an evidence register that records each artifact or system signal with its owner, date and validation status, a visible scoring rule and a challenge process, so a second reviewer inspecting the same evidence reaches a comparable rating.
How can monitoring verify data maturity claims?
Operational signals test what teams say they do. Anomaly detection shows whether unusual behavior is separated from normal variation, timeliness monitoring flags late or missing deliveries, record-level validation proves business rules are enforced, and schema change tracking catches added columns or changed data types that break downstream consumers.
What should a data maturity assessment deliver?
The final output should be a gap register rather than just a heatmap. Each finding names the affected data or process, current evidence, business consequence, accountable owner, target state and next decision date, and is classified as a quick win, a structural fix or a capability investment that leadership can fund.


