Best Data Quality Software: Guide for 2026
|
7
min read

You probably know the feeling. A dashboard looked fine on Thursday, then Monday morning the numbers are off, the team starts asking questions, and the root cause turns out to be a pipeline that arrived late or a schema change nobody noticed. In that moment, data quality software is not a cleanup utility, it's the control layer that tells you whether the data is still trustworthy enough to use.
Modern platforms do more than remove duplicates or standardize fields. They watch for anomalies, missing data, schema drift, and freshness issues, then surface problems before they spread into BI, analytics, or machine learning workflows. That shift from one-time cleanup to continuous monitoring is part of the field's evolution, and the 2022 survey in Frontiers in Big Data describes four stages, from state reconstruction through continuous data-quality monitoring, with roots in work going back to 1999, 2007, 2009, and 2019. IBM's description of a data quality platform also lines up with this broader role, software that helps organizations identify, assess, clean, monitor, and validate data so it stays accurate, complete, consistent, relevant, and timely. Frontiers in Big Data survey and IBM's data quality platform overview capture that shift well.
Table of Contents
What Data Quality Software Really Does Today
A Monday-morning dashboard that broke on Friday is often not broken in the obvious way. The table may still load, the queries may still run, and the report may still open, but the numbers can be stale because data arrived hours late or a feed changed shape without warning. Modern data quality software has shifted from “clean the mess later” to watching the pipeline while it runs.
From batch cleanup to continuous monitoring
A useful working definition starts with the basics. A platform profiles data, validates records, monitors pipelines, and helps teams remediate issues before bad data spreads. IBM describes a data quality platform in that operational sense, and the field's research lineage shows how the category grew from earlier cleansing work into continuous data-quality monitoring.
That evolution matters because many teams now run warehouses, lakes, scheduled refreshes, streaming jobs, and model feeds at the same time. In that setting, a single delayed source can make a dashboard look correct while making it wrong.
Practical rule: if the data can break after it lands, the software has to keep watching after the load finishes.
The four jobs that often get blurred together
People often say “data quality” when they mean several different jobs. Profiling looks at what the data currently looks like, cleansing changes data to fix known issues, validation checks whether records meet rules, and monitoring keeps checking over time so new problems are caught early. Confusion usually starts when teams buy a tool for one of those jobs and expect it to cover the others.
A simple analogy helps. A smoke alarm, a repair kit, a building inspection, and a security feed all deal with safety, but none of them does the same job. Data quality software works the same way across analytics, BI, and machine-learning pipelines. If a schema changes, a feed stalls, or a metric suddenly swings away from its normal pattern, the platform should flag it before stakeholders make decisions on top of it.

Core Capabilities Every Modern Platform Should Cover
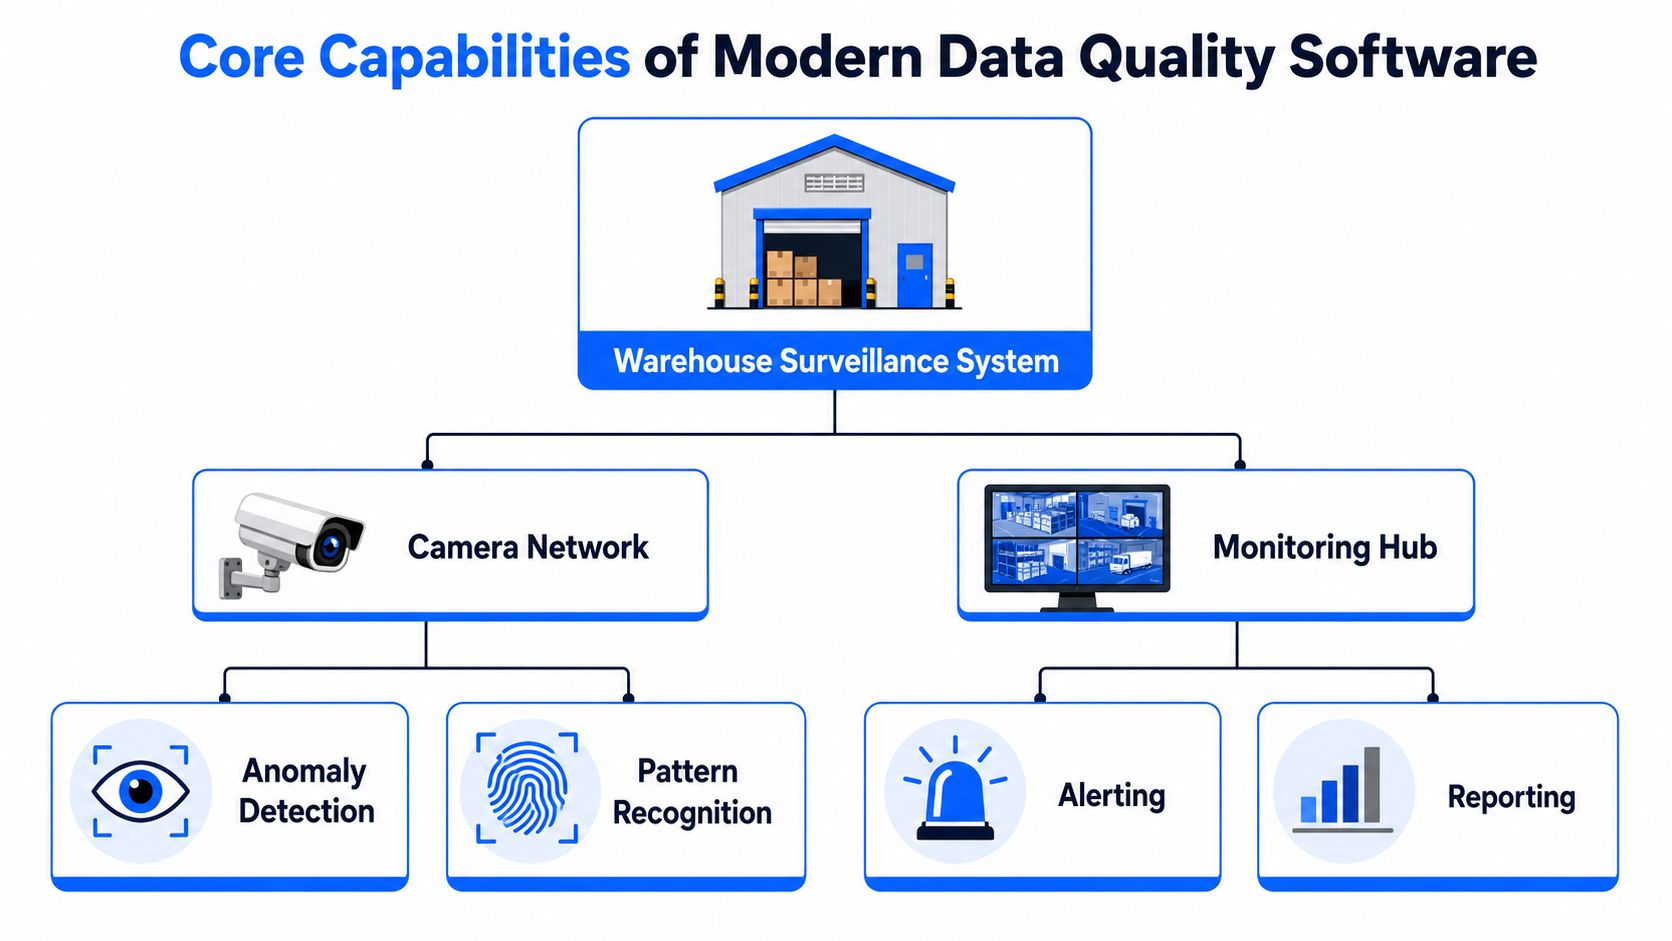
A warehouse camera system only works if it does more than show one hallway. It needs cameras, alerts, a monitoring console, and a response process that tells people what to do next. Data quality software works the same way, because one feature by itself rarely covers the full problem.
The capabilities that matter in practice
Anomaly detection learns what normal activity looks like and flags unusual shifts. That catches a sudden drop in row counts, a metric that starts drifting without a rule change, or a feed that behaves differently from its usual pattern. Validation is the rule layer. It checks whether a record meets a business requirement, such as a required field being filled in or a value staying inside an allowed range. Timeliness checks whether data arrived on schedule, which helps prevent a report from going stale before anyone notices.
Schema tracking handles structural change. If a column appears, disappears, or changes type, the platform should surface it quickly, because downstream jobs may fail or keep running with the wrong assumption. Data analytics on observability metrics adds the historical view, so teams can spot trends instead of reacting only to one-off alerts. Those capabilities line up with standard quality dimensions, completeness, timeliness, validity, integrity, uniqueness, and consistency. Alation's overview of data quality dimensions is a useful reference point for that framework.
Practical rule: if a platform cannot tell you what changed, when it changed, and whether that change affects downstream users, it is only solving part of the problem.
Why these functions belong together
A common mistake is buying separate tools for profiling, alerting, validation, and remediation. That split looks tidy on paper, but it creates blind spots in production because each tool sees only one part of the workflow. Modern platforms treat the full chain as one system. First inspect, then compare, then alert, then help with response.
The stronger products also combine automated detection with business-aware checks. That matters because the same dataset can be technically valid and still operationally wrong for the business. A clean field is not useful if it arrived too late for the forecast or no longer matches the shape that a downstream model expects.
Where the Software Runs and Why That Matters
A vendor demo can look strong and still fail a real procurement review if the checks run in the wrong place. If the platform copies sensitive data into another system, or routes it through extra processing layers before inspection, the architecture itself becomes the problem. For regulated teams, that is not a side concern, it is part of the buying decision.
In-database execution versus external processing
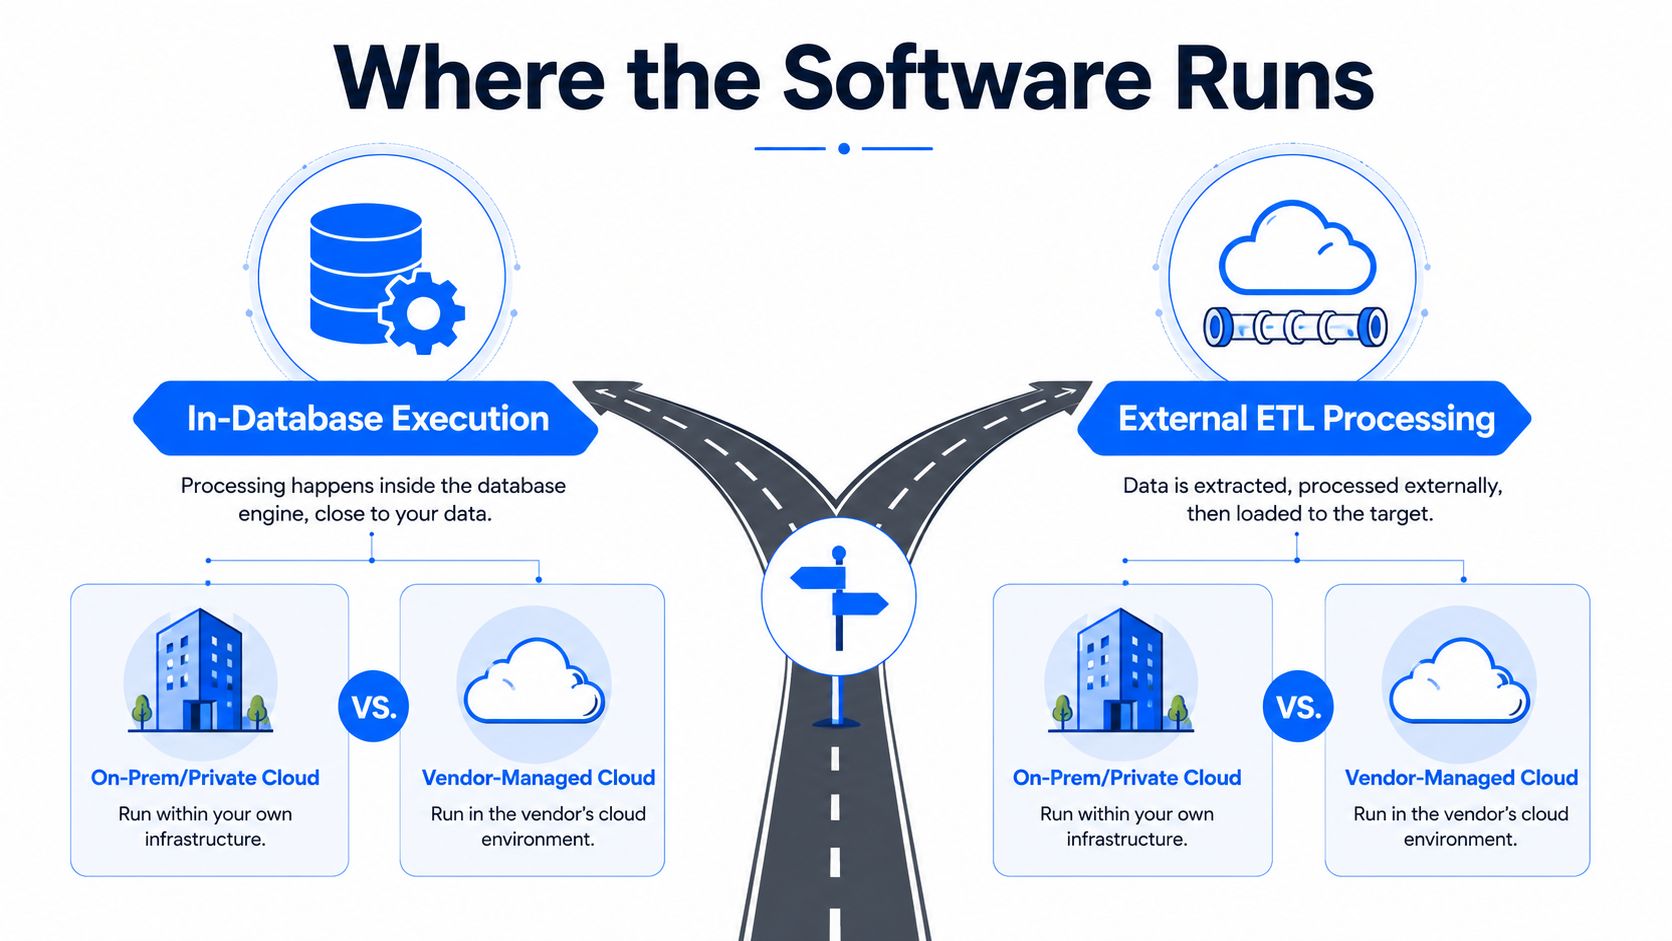
The easiest analogy is building inspection. In-database execution sends the inspectors to the building so they can check things in place. External ETL processing sends the materials to a lab first, which adds movement, delay, and exposure. The same idea applies to data platforms, because running checks inside the warehouse or database reduces data movement and keeps the customer in control of the environment.
That design matters most in private cloud and on-prem deployments, where the vendor should not need access to production datasets. Teams in finance, healthcare, telecom, and the public sector care about sovereignty, audit trails, and access control, so they need a platform that fits those constraints instead of working around them. Gartner's framework emphasizes connectivity across on-premises and cloud sources, which is why deployment flexibility belongs on the shortlist from day one. Gartner Reviews for augmented data quality solutions reflects that connectivity expectation.
Scale changes the architecture choice
At enterprise scale, the question is not whether a demo works on one table. It is whether the platform can monitor high-volume warehouses and lakes without forcing teams to create a separate project for every dataset. In-database checks help here because they let teams monitor where the data already lives, rather than duplicating the pipeline just to inspect it.
A regulated enterprise should ask one blunt question, can this platform run where the data already is, without handing production access to the vendor?
That question often reveals the core tradeoff. A vendor-managed cloud service may look simpler in sales materials, but customer-controlled deployment can be the difference between adoption and rejection when legal, security, or audit teams get involved. For many organizations, the deployment model is not an implementation detail, it is the gate that determines whether the tool can be used at all.
digna's data quality monitoring page is one example of how monitoring is often framed as a continuous control, not a one-time check.
Rule-Based Validation vs Continuous Observability
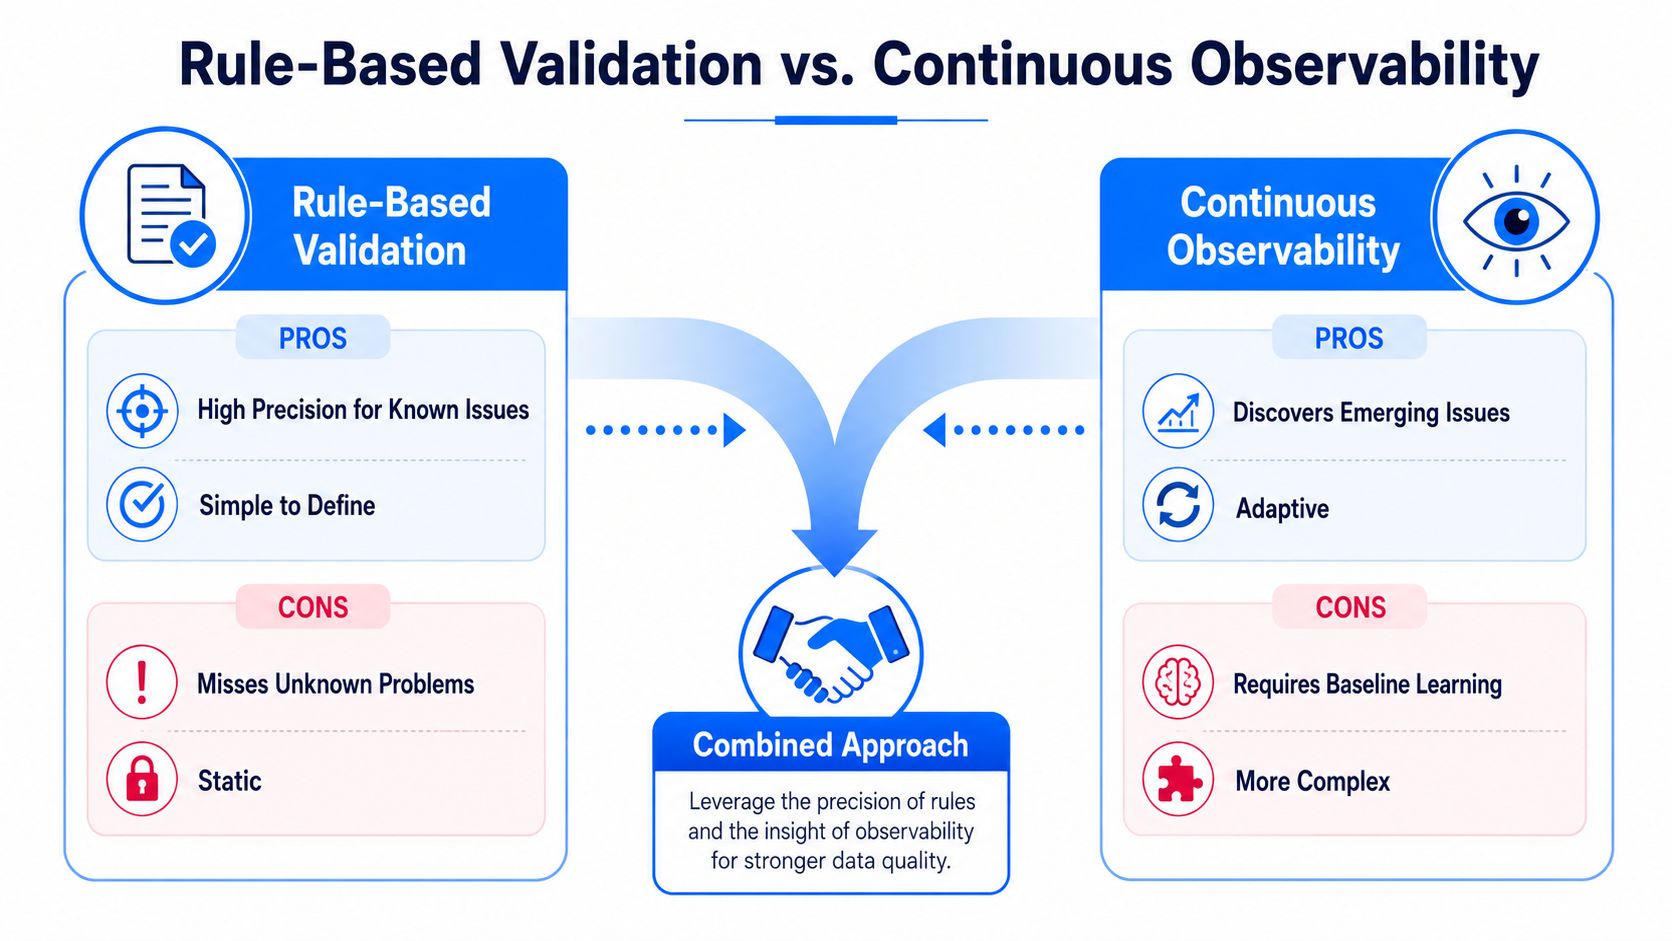
Teams usually get stuck here because the two approaches sound like rivals. They're not. Rule-based validation catches known failure modes with precision, while continuous observability catches the problems nobody thought to encode into a rule in the first place.
Why both approaches earn a place
Validation is like a spell-checker. If you know the word is misspelled, it catches the mistake reliably. Observability is more like a smoke detector, it learns the normal pattern and alerts you when something changes in a way that doesn't fit the baseline. Industry guidance increasingly favors a hybrid model because contract-based tests catch known problems, while observability catches unknown ones. Gartner's framing of augmented data quality also pulls these parts together, profiling, monitoring, rule discovery, and AI or ML-driven anomaly detection. Soda's framework and tools guide is useful because it reflects how practitioners are combining the two.
That hybrid model matters most at scale. In a small team, a few hard-coded checks can cover a lot of ground. In a large enterprise with cloud and on-prem sources, multiple domains, and changing pipelines, a static rule set turns into maintenance work that grows faster than the data estate itself. digna's data quality monitoring page is one example of a monitoring-oriented approach built around that blend.
What gets missed when you choose only one
A validation-only tool can tell you that a rule failed, but it won't necessarily tell you that a new failure pattern is emerging. An observability-only tool can surface the unusual pattern, but it may not enforce the business rule that a compliance team needs. The coverage gap is why buyers should think in layers, not camps.
For regulated or fast-moving environments, the best operational question is simple, does the platform help us detect both the expected breakage and the unexpected drift? If the answer is yes, the team spends less time arguing about tooling and more time fixing the actual issue.
How to Evaluate Data Quality Software for Your Stack
A vendor demo can make almost any platform look competent. The harder question is whether it can handle your tables, your schedules, your access rules, and your failure modes without becoming another tool that only one specialist knows how to run. Start with the same checklist for every vendor, so you compare actual fit instead of polished sales slides.
A practical evaluation checklist
Criterion | Why It Matters | What to Ask the Vendor |
|---|---|---|
Coverage across quality dimensions | A single check type is not enough. You need coverage for completeness, timeliness, validity, integrity, uniqueness, and consistency, because each one catches a different class of breakage. | Which dimensions are covered natively, and which require custom work? |
In-database execution | Keeping checks close to the data reduces movement and helps private environments stay private. | Do checks run inside the warehouse or database, and what data leaves the environment? |
Deployment flexibility | Regulated teams often need private cloud or on-prem options, not a one-size-fits-all SaaS path. | Can the platform run without vendor access to production datasets? |
Schema and lineage awareness | If a metric breaks after a schema change, you need to see the upstream cause, not just the broken output. | Can the tool trace issues across lineage and show the affected upstream job? |
Timeliness and SLA monitoring | Data can be structurally valid and still be useless if it arrives late. A fresh dashboard and a stale dashboard are different business risks. | Can it monitor freshness against schedules and expected delivery times? |
Rule management and validation | Business teams still need explicit checks for compliance and known logic, especially where exceptions are not acceptable. | How are rules created, versioned, tested, and maintained? |
Integration with warehouses and pipelines | A tool that does not fit your stack usually stalls in adoption. | Which warehouses, lakes, and orchestration tools are supported natively? |
A good review also looks at the platform as a system, not a checklist. The data quality metrics you track should map to the failure modes you care about, because anomaly detection, validation, timeliness, and schema tracking each answer a different question. The market is broader than cleansing alone. Mordor Intelligence valued the global data quality tools market at USD 3.27 billion in 2026, and Gartner's buyer criteria show how solutions are now evaluated across profiling, cleansing, analytics and visualization, workflow, rule management, metadata and lineage, and monitoring and detection. Mordor Intelligence's market report is useful for understanding the category's breadth, while Gartner's ADQ reviews page shows the evaluation lens enterprise buyers are using.
Before you sign off on a proof of value, run the platform against your own schemas and your own edge cases. A polished demo dataset hides too much. Real volume, real access controls, and real pipeline noise will show whether the system can support secure data conversion for teams across sensitive workflows, or whether it only works when the environment is simplified for show.
Ask for a proof of value against your own schemas, not a polished demo dataset. Real volume and real edge cases reveal more in a week than a scripted walkthrough does in an hour.
Real-World Use Cases and the Problems They Solve
The clearest use case is usually the one that already hurt. When a dashboard goes stale, an ML feature table drifts, or a compliance report contains bad records, the question stops being “What can the platform do?” and becomes “Which control would have caught this earlier?”
What the problems look like in production
ITSV, the IT backbone of Austria's social insurance, replaced 9,000 hand-crafted rules with AI-driven anomaly and timeliness monitoring, which shows how a large team can move from endless rule maintenance to a system that watches for changes continuously. That kind of shift matters because manual checks don't scale well when data estates keep growing and the team can't keep writing tests for every new table.
Three patterns show up again and again. First, AI and ML pipelines need protection from silent drift and schema changes, because models can fail even when upstream jobs technically succeed. Second, executive dashboards need timeliness monitoring so business users don't make decisions from stale loads. Third, audit-heavy workflows need record-level validation so teams can prove the data met business rules before it reached a report or control process.
Mapping problems to components
The component mapping is straightforward:
Data Anomalies helps catch drift and unexpected behavior before it reaches a model or report.
Timeliness surfaces late arrivals and missed schedules.
Schema Tracker flags added columns, removed columns, or type changes.
Data Validation supports compliance checks and business rules at the record level.
Those four pieces work together because each one solves a different failure mode. If the feed is on time but the schema changed, the dashboard may still break. If the schema is stable but rows are incomplete, a model can still degrade.
For teams handling financial files, contract records, or converted source data, a practical companion is secure data conversion for teams, especially when the first step is getting structured inputs into a controlled workflow before quality checks begin.
Piloting, Integration, and Proving ROI
A pilot that tries to monitor everything usually proves nothing. Start with a handful of tables that matter to executives, operations, or compliance, then measure whether the platform catches the issues that matter in your environment.
A first-quarter pilot plan
Set the scope first. Pick a small set of high-impact tables, ideally the ones that feed a dashboard, a model, and a compliance or finance workflow. Then define success metrics before you turn anything on, because a pilot without targets turns into a tour of features.
The most useful metrics are operational ones. Track how long it takes to detect a freshness issue, how much of the critical estate is covered by anomaly detection, how many hours disappear from manual rule maintenance, and how many downstream incidents you avoid in dashboards or ML models. If the vendor can't support lineage-aware root-cause analysis, ask how quickly the team can trace a problem back to the upstream change that caused it.
Pilot step | What to do | What to measure |
|---|---|---|
Scope the data | Choose a small set of tables with real business impact. | Coverage of critical paths. |
Define alerts | Decide which issues should trigger a notification. | Detection speed and alert precision. |
Integrate with the stack | Connect warehouses, lakes, and pipeline tools. | Time to first usable signal. |
Run under real load | Use production-like volume and schedules. | Missed issues and false alarms. |
Decide on rollout | Compare results against the baseline process. | Manual effort reduced and incidents avoided. |
A realistic timeline helps internal buy-in. Use a 30-day scoping sprint to agree on tables, access, and metrics. Follow with a 60-day proof of value against your own data. Then use a 90-day decision gate to decide whether the platform deserves broader rollout.
Governance, Privacy, and Your Next Step
Data quality works best when it doesn't live outside governance. The quality signals, metadata, lineage, access control, and audit trail should feed the same catalog and policy layer, because teams need one place to understand what data exists, where it came from, and whether it's safe to use.
That's also where privacy becomes practical. If the platform executes in the customer environment, keeps data in the customer environment, and doesn't require vendor access to production datasets, it becomes much easier to fit into regulated operating models. For private cloud and on-prem teams, that difference can determine whether a pilot moves forward or dies in security review.
The cleanest next step is straightforward. This week, list the dashboards or models whose failure would hurt most, identify the underlying tables, and use that list to define your first pilot. Then bring governance, engineering, and analytics into the same conversation so the evaluation reflects how the platform will be used, not just how it looks in a demo.
If you want a platform that fits this operational view of data quality, explore digna. It focuses on anomaly detection, validation, timeliness, and schema tracking while running inside the customer's environment. Use it to see how a private-cloud or on-prem approach changes the way your team monitors critical data.


