10 Monte Carlo Simulation Applications in Data Strategy
|
9
min read

Monte Carlo simulation doesn't predict a guaranteed future. It converts uncertain inputs into probability distributions, then samples those inputs repeatedly to show how outcomes may behave under different conditions. The method was developed in the 1940s by Stanislaw Ulam and later became standard across finance, engineering, physics, logistics, healthcare, climate science, manufacturing, and project management. A landmark 1964 Harvard Business Review article by David Hertz helped establish its role in corporate finance, and modern models commonly run thousands or millions of random trials for applications such as equity options pricing, project finance, and real-options analysis (Corporate Finance Institute).
That makes the method powerful, but also easy to misuse. A simulation can process uncertainty at scale while still producing misleading guidance if its inputs are delayed, incomplete, anomalous, incorrectly distributed, correlated in the wrong way, or structurally changed. The ten Monte Carlo simulation applications below therefore focus on more than the model itself. Each one connects the decision to the data conditions that determine whether the output deserves trust.
Ask four questions before treating a result as decision-ready: Which variables need probability distributions? What historical or live data supports those distributions? Where could the assumptions fail? How will observability detect invalid, late, anomalous, or structurally changed inputs before they distort the result?
Table of Contents
1. Financial Risk Assessment and Portfolio Modeling
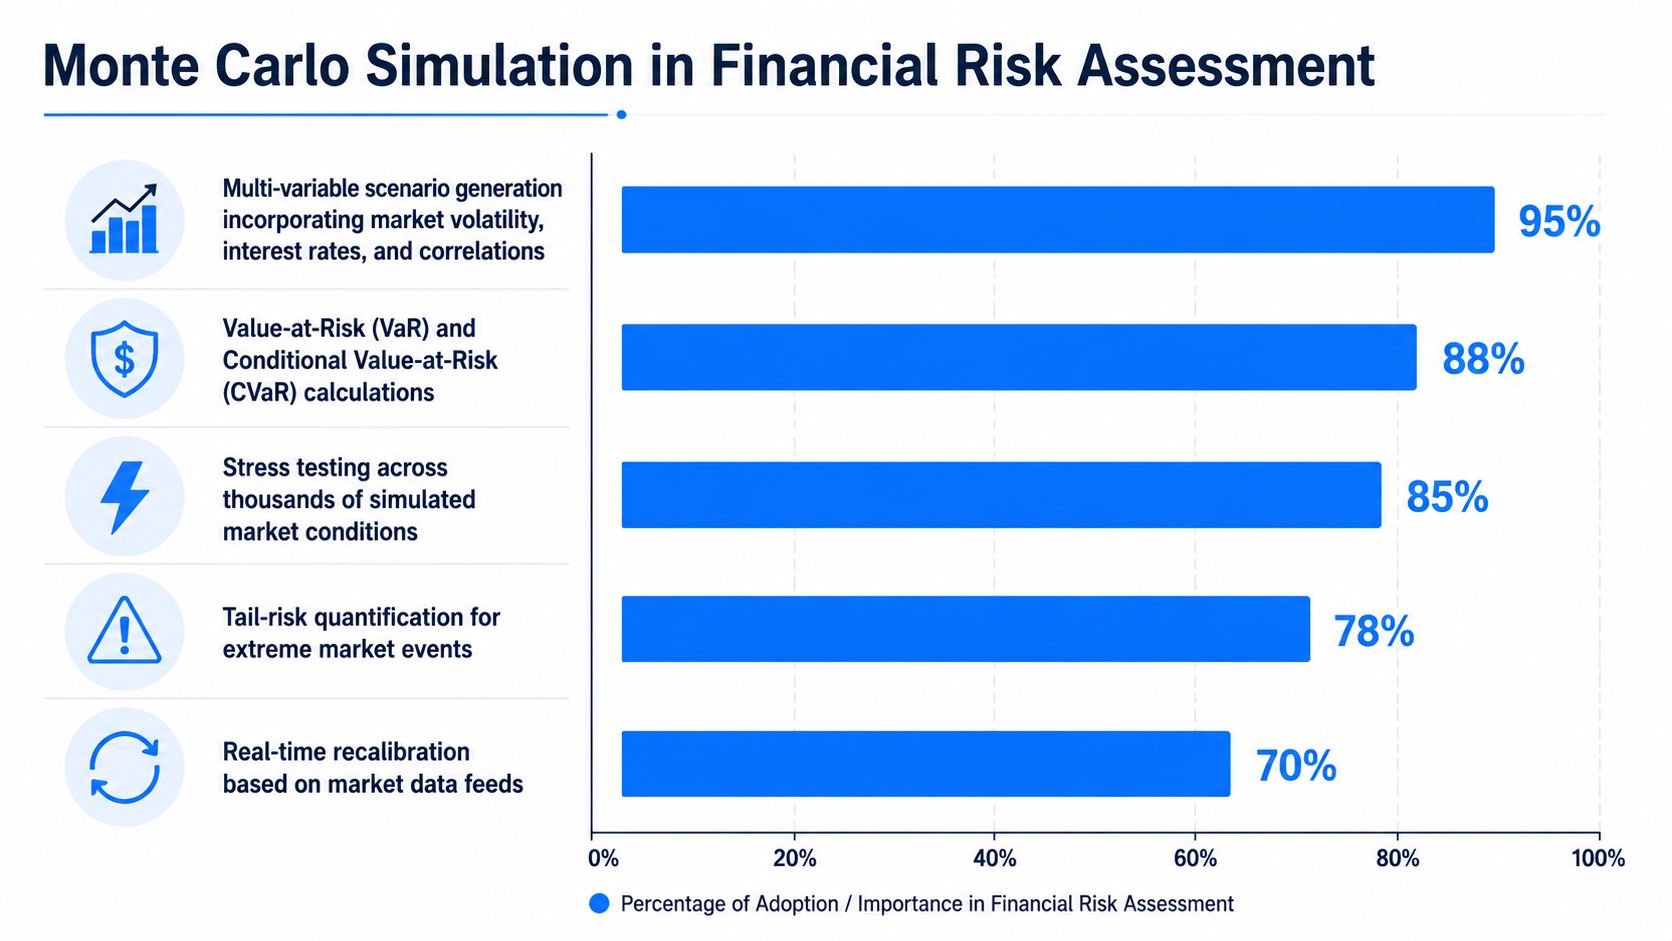
Monte Carlo simulation is most useful in finance when the decision depends on many possible market paths. Analysts model uncertain market returns, interest rates, inflation, and cash flows for portfolio optimization, Value at Risk, expected shortfall, retirement-income planning, stress testing, derivative pricing, and asset-liability analysis (financial applications of Monte Carlo simulation). Path-dependent derivatives require particular care because their value depends on how conditions evolve, not only on the final outcome.
Trust in the result starts with the inputs. Late prices can create stale scenarios, unstable correlations can misstate diversification, and a changed field type can alter calculations without stopping the model. Historical data also needs enough continuity and structural consistency to support the selected distributions and relationships.
Data controls that protect risk outputs
A practical observability workflow should:
Validate source records: Check prices, positions, exposures, and classifications before each simulation run.
Monitor market-feed delivery: Flag missing or delayed observations before stale values enter current scenarios.
Compare expected and observed behavior: Establish baselines for risk metrics and investigate unusual output movement, including changes not explained by market conditions.
Track structural drift: Detect added, removed, or retyped columns before downstream calculations change.
For banks and other regulated institutions, financial data quality management for banks links accuracy, traceability, and reporting controls. The same principle applies to equity research AI analysis, where conclusions depend on data that remains timely and fit for purpose.
Observability should cover both model inputs and business signals, such as exposure totals, risk-limit breaches, and changes in portfolio concentration. Those signals help analysts distinguish genuine market movement from pipeline failure or assumption drift.
Practical rule: A stable simulation engine cannot compensate for unstable market data or undocumented assumptions.
2. Drug Development and Clinical Trial Simulation
Healthcare uses Monte Carlo methods to propagate uncertainty through patient pathways, treatment outcomes, economic evaluations, and risk-benefit decisions. A systematic review identified four broad healthcare purposes: health-risk and dose-response assessment, economic evaluation, comparison of competing technologies or strategies, and miscellaneous feasibility or literature-review work. Those categories contained 60, 18, 41, and 23 papers respectively in the review (systematic review of healthcare Monte Carlo applications).
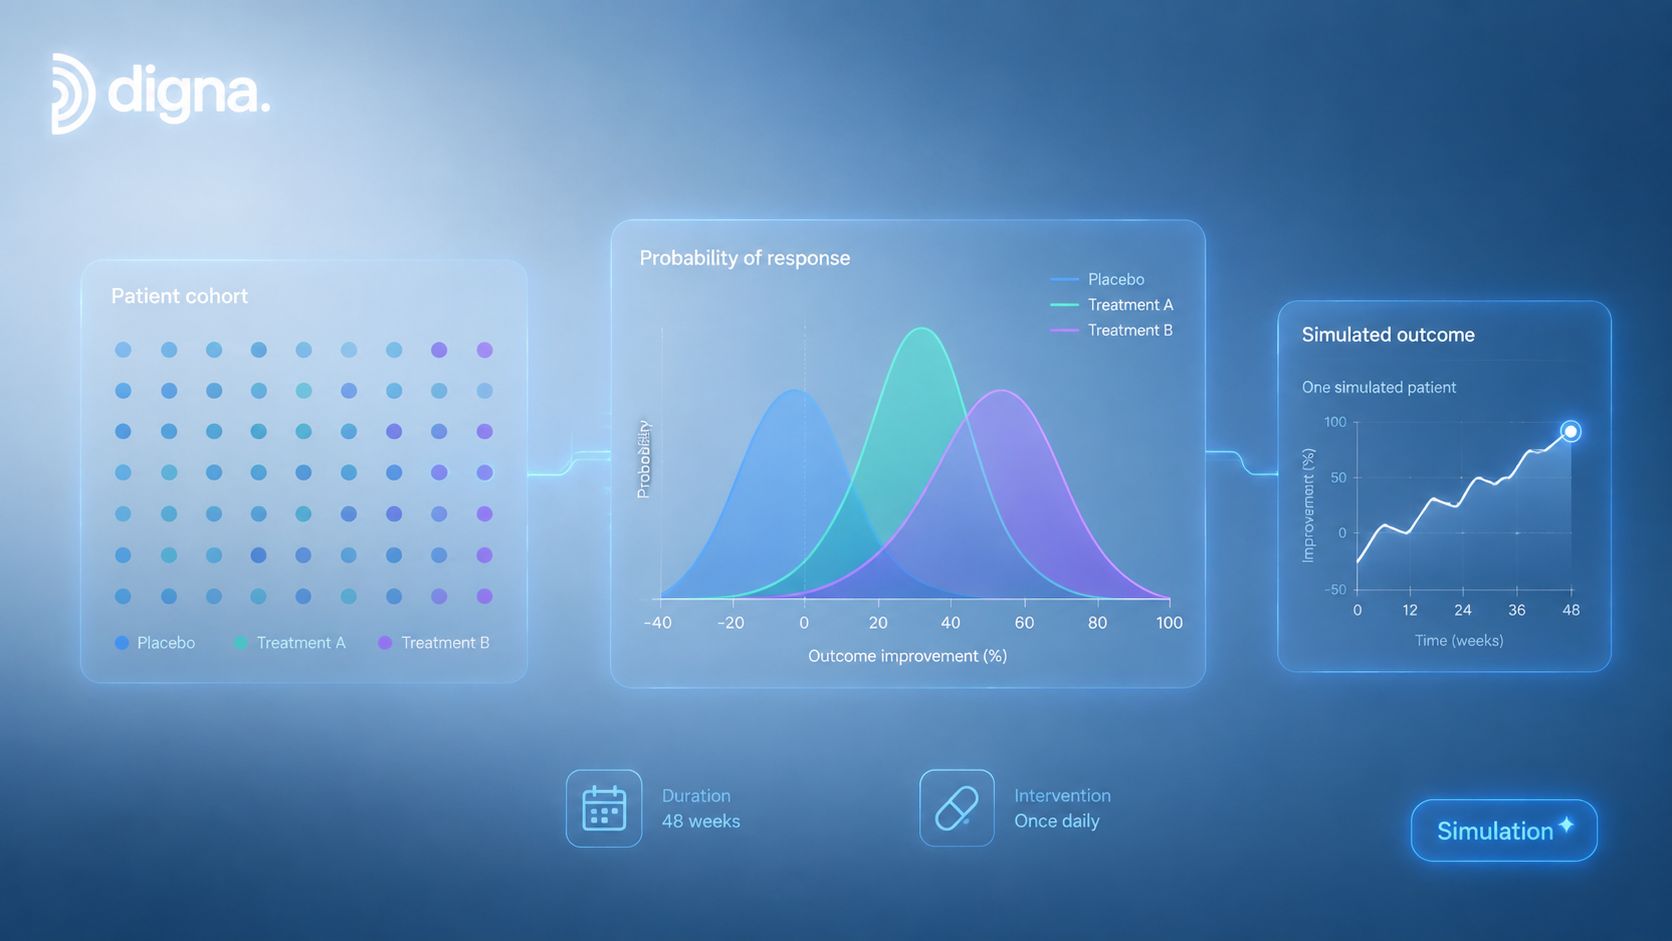
Clinical researchers can use simulated cohorts to examine how treatment response varies across patient characteristics, how incomplete enrollment affects trial conclusions, or how competing therapies behave over a long pathway. Monte Carlo methods are particularly valuable for cancer therapy optimization, personalized medicine, disease-outcome prediction, and benefit-risk evaluation. A healthcare review also notes that simulated antibiotic therapeutic curves can closely match experimental results, while Bayesian Monte Carlo regression can suit limited but complex epidemiologic datasets (Monte Carlo in healthcare decision modeling).
The data risk is unusually consequential. Missing patient records, inconsistent adverse-event coding, delayed outcome reporting, or an electronic health record schema change can change the apparent shape of a distribution without changing the simulation code.
Reliability depends on clinical data lineage
Healthcare teams should connect each model input to controls that answer:
Are required fields complete? Validation rules can check patient, treatment, enrollment, and outcome records.
Are adverse events behaving plausibly? Anomaly detection can surface unusual reporting patterns for investigation.
Are outcomes arriving on schedule? Timeliness monitoring distinguishes a genuine change from a reporting lag.
Did the source structure change? Schema tracking can identify modifications in electronic records before pipelines fail.
That is the purpose of clinical data validation and regulatory rules at scale. In this setting, observability isn't merely an engineering convenience. It helps preserve the audit trail between source records, modeled uncertainty, and a decision that may affect patients or regulatory submissions.
3. Supply Chain and Logistics Optimization
Supply chain models rarely fail because planners forgot that demand is uncertain. They fail because the uncertainty was represented using data that no longer describes current operations. Monte Carlo simulation can combine variable demand, supplier lead times, transportation delays, inventory positions, and logistics costs to evaluate stock policies and distribution choices across many possible conditions.
A warehouse team might use the model to compare replenishment strategies. A logistics planner might examine how late supplier shipments interact with demand surges and transport disruption. The useful output isn't a single inventory target. It's a view of the trade-off between availability, working capital, service risk, and operational resilience.
Watch the inputs that shape the scenario range
Supply chain data needs controls at several points:
Lead-time validation: Check that supplier and carrier records contain plausible values and consistent units.
Demand anomaly review: Investigate abrupt forecast or order changes before fitting distributions to them.
Delivery timeliness: Detect missing shipment events and late confirmations that can make current inventory appear healthier than it is.
Schema-change tracking: Monitor logistics and warehouse systems for structural changes that could remove or reinterpret fields.
The broader pipeline matters as much as the simulation notebook. A data pipeline architecture built for reliable movement and transformation gives teams a clearer place to monitor ingestion, transformations, and downstream consumption.
Amazon, Walmart, and Unilever are often cited in industry discussions of simulation-led inventory, facility, and network planning, but the operational lesson is more general. A model can't infer whether a lead-time increase reflects a real supplier problem, a changed timestamp convention, or a delayed feed. Observability must make that distinction visible before planners act on the output.
4. Insurance Claims Prediction and Pricing Models
Insurance simulation is only as reliable as the claims data behind it. Pricing and reserving models represent uncertainty in claim frequency and claim severity. Monte Carlo simulation lets actuaries estimate possible losses, test reserve adequacy, compare pricing assumptions, and examine solvency exposure across varied conditions. It also supports catastrophe and asset-liability analysis, where averages can obscure tail risk (Monte Carlo uses in finance and insurance).
Claims classification determines whether a simulated shift reflects exposure or data movement. A rise in severe losses may result from genuine risk, a claims-handling change, duplicate records, or revised coding. If analysts treat every change as a business event, the insurer may price against a defect in its source data.
Separate actuarial movement from data movement
Before running pricing or reserve simulations, teams should:
Validate claim completeness: Check required fields, policy relationships, coverage rules, and classification logic.
Investigate unusual severity: Compare claim patterns with exposure and historical records to identify possible data-quality issues.
Monitor processing schedules: Track whether claim entries and reserve adjustments arrive on time.
Record schema changes: Identify claims-system modifications that could alter actuarial extracts or downstream formulas.
Observability should connect these input checks to business signals. A missing coverage field can affect segmentation, while delayed reserve updates can make current liabilities appear lower than they are. Monitoring should therefore show both the data condition and the resulting change in pricing, reserves, or risk measures.
State Farm, Lloyd's of London, and Berkshire Hathaway are associated with insurance modeling, including reserve, catastrophe, and pricing work. Their examples do not replace local validation. Exposure definitions, claims procedures, and source-system behavior differ by insurer, so a distribution suitable for one portfolio may not fit another.
For digna's Financial Services solution, the operational connection is direct. Validation protects business rules, anomaly detection challenges unexpected claim patterns, timeliness monitoring exposes stale reserves, and schema tracking helps preserve model continuity.
5. Oil and Gas Exploration and Reserve Estimation
Subsurface decisions are built around incomplete knowledge. Geologists and engineers use Monte Carlo simulation to represent uncertainty in reservoir size, recovery factors, drilling costs, production behavior, and project economics. The resulting distribution helps teams assess reserve estimates, drilling viability, portfolio choices, and the consequences of different geological interpretations.
A reserve model can be mathematically correct and still be operationally misleading. Seismic interpretation data may be revised, well measurements may arrive late, or production readings may change because equipment has degraded. If those changes aren't distinguished from ordinary variation, the simulation can assign probability to a measurement problem rather than to a geological possibility.
Preserve the meaning of field data
Useful controls include:
Interpretation validation: Check seismic inputs and confidence fields against defined quality thresholds.
Production timeliness: Flag delayed or missing well reports before reserve-update models consume incomplete history.
Measurement anomaly detection: Investigate unusual production patterns that could indicate equipment issues or sensor errors.
Well-log schema tracking: Detect structural changes in logging systems before interpretation tools or extracts fail.
Shell, ExxonMobil, and Saudi Aramco are examples associated with simulation in reserve estimation, project assessment, and field development planning. Their scale also illustrates why observability belongs close to the data platform. Large operational environments produce frequent revisions, and a model needs versioned assumptions and visible input lineage if decision-makers are expected to defend its outputs.
The central trade-off is speed versus scrutiny. Faster model refreshes can support more responsive planning, but only when teams can see whether new data is complete, timely, and structurally comparable with the prior run.
6. Telecommunications Network Capacity Planning
Telecom operators use Monte Carlo simulation to explore uncertain traffic growth, subscriber additions, data-consumption rates, technology adoption, and infrastructure demand. The model helps planners compare network investment choices against a range of possible loads rather than committing to a single growth path.
This application exposes a particularly difficult data condition: network behavior changes over time. A traffic pattern that was normal before a product launch, outage, DDoS attack, or technology migration may no longer provide a stable basis for future sampling. Treating all historical observations as interchangeable can make a simulation precise but poorly calibrated.
Make changing network behavior visible
A capacity workflow should combine:
Measurement validation: Check regional traffic metrics for completeness, unit consistency, and plausible ranges.
Feed timeliness: Detect delayed analytics loads before planners rely on stale traffic projections.
Usage anomaly detection: Separate unusual customer demand from network faults, attacks, and measurement errors.
Management-schema monitoring: Track changes in network systems that could break metrics or alter their meaning.
Verizon, Deutsche Telekom, and China Mobile are examples associated with simulation for deployment, capacity, and subscriber-growth planning. Their operating environments differ, so the most important implementation question isn't whether Monte Carlo can run. It's whether the data reflects the same service definitions, geography, and measurement logic across the periods being compared.
digna's Telecommunications solution can connect these controls across high-volume customer and operational data. That supports a more defensible workflow, where a capacity alert includes not only the simulated risk but also evidence about the freshness and integrity of the records behind it.
A traffic distribution is only useful if the team knows which operating regime produced it.
7. Environmental and Climate Change Impact Modeling
Climate simulations are only as credible as the data conditions behind their uncertainty ranges. Environmental models combine observations, parameters, emissions pathways, physical responses, and policy assumptions. Monte Carlo methods propagate variation across those inputs, allowing researchers to examine a distribution of possible impacts rather than report one deterministic future. They are used across climate science and other scientific fields to evaluate how uncertain inputs affect model outcomes.
The main data risk is structural inconsistency. Environmental sensors, satellite products, station records, and modeled datasets can differ in resolution, calibration, timestamps, and definitions. If those differences are undocumented, a simulation may interpret a change in the observation system as a climate signal. Stable outputs therefore require both statistical analysis and controls over provenance, versioning, and preprocessing.

Treat provenance as part of the model
Environmental teams can monitor the inputs and business decisions connected to each run by:
Validating observations: Check consistency across stations, periods, units, and collection methods.
Monitoring arrival patterns: Flag missing or delayed sensor feeds before an incomplete time window enters a model run.
Detecting measurement anomalies: Investigate spikes that may result from instruments, preprocessing, or transmission rather than environmental change.
Tracking pipeline structure: Record schema, source, and transformation changes across satellite and climate-data workflows.
The statistical methods for data analysis used in these workflows should examine input volatility, identify unusual behavior, and preserve evidence about the records behind each result. Monitoring should also connect simulation outputs to decisions such as investment assumptions, adaptation priorities, and policy scenarios.
IPCC assessment work, World Bank climate-risk analysis, and climate scenario analysis used in investment decisions involve different stakeholders but share a governance requirement: analysts must separate uncertainty in environmental conditions from uncertainty introduced by the data pipeline.
8. Manufacturing Quality Control and Defect Rate Prediction
Manufacturing teams use Monte Carlo simulation to estimate how variation in machine performance, material characteristics, tolerances, process settings, and inspection outcomes affects defect rates. Propagating these distributions through a production model helps engineers compare quality-control strategies and test reliability under changing operating conditions.
Engineering applications include tolerance analysis, reliability design, measurement uncertainty, robotic error analysis, and design optimization (engineering applications of Monte Carlo methods). The method is useful because defects can arise from interactions among variables. A component may satisfy its individual specification while combined tolerances create a finished-product failure.
Detect process drift before it becomes a model assumption
Simulation results depend on stable definitions and timely measurements. Production observability should include:
Sensor validation: Compare readings with permitted ranges and known process relationships.
Inspection timeliness: Flag late quality reports before missing records conceal a recurring defect pattern.
Defect anomaly detection: Investigate unusual concentrations by line, shift, machine, material, or product.
Schema tracking: Detect changes in quality-management records before analytics tools misread inspection fields.
Toyota, Intel, and Siemens are associated with simulation for production optimization, semiconductor yield, and industrial quality assurance. These examples point to the same implementation requirement: a historical defect distribution is insufficient when the measurement system, inspection process, or product definition has changed.
Monitor model inputs and business outputs together. Input anomalies can explain a shift in the simulated defect range, while output monitoring can show whether scrap, rework, yield, or warranty signals have moved beyond established behavior. This connection helps quality teams distinguish genuine process change from a data or pipeline problem before changing production controls.
9. Public Sector Budget Planning and Fiscal Impact Analysis
Public-sector budgets combine uncertain revenue, spending, participation, economic conditions, and policy effects. Monte Carlo simulation helps agencies examine how those variables interact across possible fiscal futures. Instead of relying on one revenue estimate or one participation assumption, planners can evaluate the range of outcomes and the trade-offs associated with policy choices.
This work carries a distinctive accountability requirement. Tax, benefits, pension, and economic-indicator data often feed formal analysis, public reporting, and audit processes. A missing reporting period or changed eligibility field can alter the apparent fiscal distribution while leaving the calculation technically executable.
Build auditability into every modeled input
Agencies should use:
Rule-based validation: Enforce eligibility, tax, benefits, and reconciliation logic before simulation inputs are accepted.
Timeliness monitoring: Track expected delivery for collections, participation, and economic data.
Anomaly review: Investigate unusual tax or payment patterns that may indicate operational or data-quality problems.
Schema history: Preserve evidence when tax and benefits systems change structure.
The Congressional Budget Office, IMF, and California pension planning are examples associated with Monte Carlo-based fiscal, debt, or obligation analysis. The underlying lesson is not that every agency should copy another institution's model. It is that public decisions need a visible chain from source record to assumption to simulated outcome.
digna's Public Sector solution can support that chain through validation, timeliness tracking, anomaly detection, and schema monitoring. Those controls don't decide which policy is best. They help decision-makers understand whether the evidence supporting each option is complete, current, and structurally stable.
10. Business Monitoring and KPI Anomaly Detection
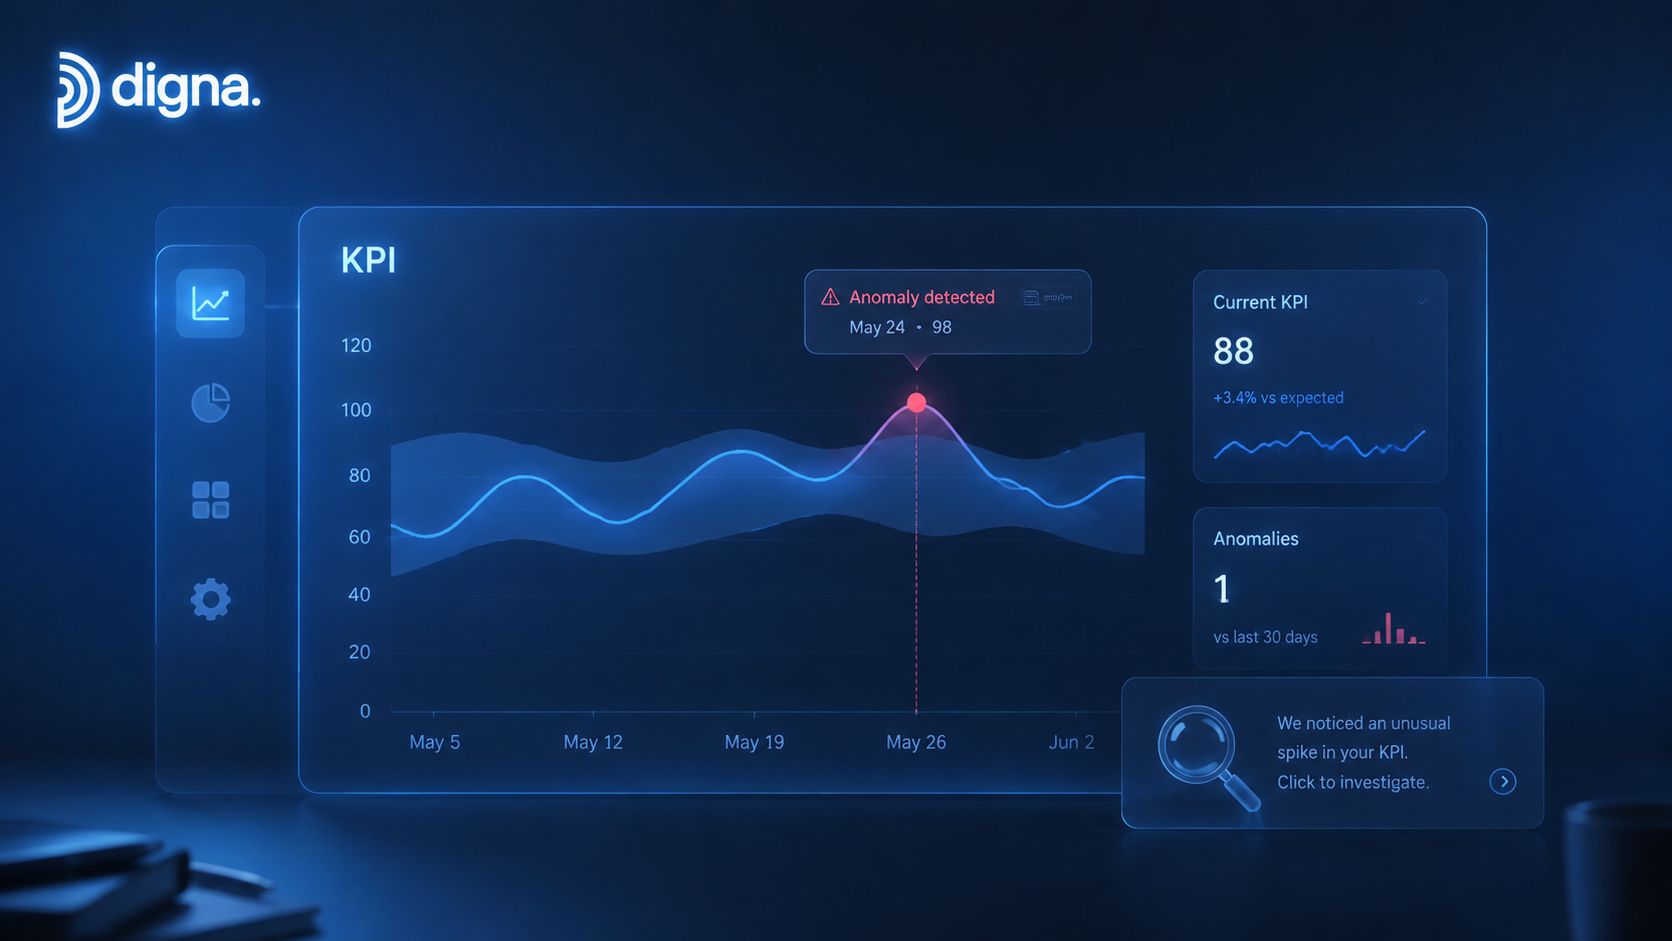
Monte Carlo simulation can support business monitoring by turning uncertain demand, operational efficiency, customer behavior, and market conditions into expected ranges for key performance indicators. Teams can then compare actual results with modeled behavior and investigate outcomes that fall outside the range they consider plausible.
This application shifts Monte Carlo from periodic planning into operational observability. An e-commerce team may monitor orders and returns. A financial-services team may examine trading volumes and spreads. A SaaS team may watch churn and usage. In each case, the alert is only useful if the underlying KPI calculation is correct and current.
Monitor both the metric and its explanation
A reliable workflow should:
Validate transactions: Check the records used to calculate revenue, orders, returns, churn, or usage.
Track KPI timeliness: Alert when a metric arrives late or a scheduled calculation misses its expected delivery pattern.
Compare anomaly types: Review statistical data anomalies alongside business-KPI anomalies.
Check structural impact: Use schema history to determine whether a changed field altered the KPI definition.
digna's time-series anomaly detection is relevant to this operating model because teams need to distinguish genuine business movement from data behavior that only looks like movement. A shared fleet operations reporting guide also illustrates why operational reporting depends on dependable source and delivery processes.
The most useful alert doesn't merely say that a KPI is unusual. It helps answer whether the business changed, the data changed, or the model's assumptions no longer fit.
Monte Carlo Simulation: 10-Application Comparison
Application | 🔄 Implementation complexity | ⚡ Resource requirements | 📊 Expected outcomes | Ideal use cases | ⭐ Key advantages & 💡 tip |
|---|---|---|---|---|---|
Financial Risk Assessment and Portfolio Modeling | High, advanced stochastic models & calibration | High, large compute, high‑frequency market data, quant expertise | Probabilistic VaR/CVaR, stress tests, tail‑risk estimates | Banks, asset managers, derivative valuation, regulatory reporting | ⭐ Captures non‑linear/tail risk; supports compliance. 💡 Validate input data quality and timeliness. |
Drug Development and Clinical Trial Simulation | High, complex population & pharmacodynamic models | High, large clinical datasets, privacy controls, compute | Trial success probabilities, sample size optimization, cost/time reduction | Pharma R&D, trial design, regulatory justification | ⭐ Predicts trial outcomes; enables adaptive designs. 💡 Ensure clinical data completeness and privacy compliance. |
Supply Chain and Logistics Optimization | Medium–High, multi‑node networks & integrations | Medium, historical demand, supplier feeds, integration effort | Optimized inventory levels, reduced costs, improved service levels | Retail, manufacturing, 3PLs, distribution network planning | ⭐ Reduces carrying costs and identifies network vulnerabilities. 💡 Monitor supplier lead‑time data quality. |
Insurance Claims Prediction and Pricing Models | High, actuarial models and regulatory controls | Medium–High, claims history, exposure databases, actuarial expertise | Premium adequacy, reserve estimates, solvency probabilities | Insurers, reinsurers, catastrophe pricing, reserve setting | ⭐ Aligns pricing to risk; validates reserves for regulators. 💡 Validate claims completeness and monitor anomalous spikes. |
Oil and Gas Exploration and Reserve Estimation | High, geoscience + engineering uncertainty modeling | High, seismic/production data, domain experts, compute | P10/P50/P90 reserve estimates, NPV distributions, portfolio risk | Exploration portfolio evaluation, reserve reporting, project screening | ⭐ Quantifies exploration risk for capital allocation. 💡 Verify seismic and production data timeliness and quality. |
Telecommunications Network Capacity Planning | Medium, time‑varying traffic models and geo granularity | Medium, network telemetry, subscriber data, integration | Capacity forecasts, congestion probabilities, CAPEX guidance | Mobile/wireline operators planning 5G/fiber deployments | ⭐ Optimizes CAPEX; identifies bottlenecks before outages. 💡 Validate traffic measurements and monitor feed timeliness. |
Environmental and Climate Change Impact Modeling | High, long‑horizon, multi‑model uncertainty | High, satellite/sensor datasets, model ensembles, compute | Probabilistic climate scenarios, policy effectiveness comparisons | Climate science, policy agencies, sustainable finance analysis | ⭐ Quantifies climate risk and policy trade‑offs. 💡 Ensure observation data consistency across stations/sources. |
Manufacturing Quality Control and Defect Rate Prediction | Medium, process capability & root‑cause scenario modeling | Medium, production sensors, historical run data, analytics | Defect rate forecasts, optimized sampling, reduced scrap | Automotive, semiconductor fabs, discrete manufacturing lines | ⭐ Reduces scrap and optimizes inspection plans. 💡 Validate sensor readings and monitor inspection timeliness. |
Public Sector Budget Planning and Fiscal Impact Analysis | Medium–High, macroeconomic scenario design & assumptions | Medium, tax, program, and economic indicator datasets | Fiscal risk distributions, debt sustainability, policy impact probabilities | Government budget offices, fiscal policy analysis, pension forecasting | ⭐ Transparently quantifies fiscal risks for policy decisions. 💡 Validate program data and track reporting schedules. |
Business Monitoring and KPI Anomaly Detection | Medium, time‑series baselines and multi‑dimensional scenarios | Medium, transactional/operational data, monitoring infrastructure | Dynamic KPI baselines, earlier anomaly detection, reduced false positives | Cross‑industry operations, e‑commerce, SaaS, finance monitoring | ⭐ Detects anomalies earlier and reduces false alerts. 💡 Combine baseline models with data validation and schema tracking. |
From Simulated Scenarios to Trusted Decisions
Across these ten Monte Carlo simulation applications, the same implementation pattern appears. The model begins by defining uncertain inputs as distributions, connecting those inputs through a mathematical structure, and interpreting outputs as probabilities rather than guarantees. But that is only the analytical layer. The operational layer determines whether the distributions still describe the system being managed.
Start with the source records. Data validation should confirm required fields, allowed values, relationships, units, and business rules before inputs reach the model. This matters in financial positions, clinical records, supplier lead times, claims classifications, well production, network traffic, climate observations, factory sensors, tax records, and KPI transactions. A simulation doesn't repair a broken record. It propagates the record's influence through every resulting scenario.
Then confirm delivery timing. A data set can be accurate when it arrives and still be unusable for a time-sensitive decision if it arrives after the model run. Timeliness monitoring should learn expected delivery behavior, flag missing or delayed loads, and distinguish an operational delay from an ordinary schedule variation. This is particularly important where simulations are refreshed frequently or where decisions depend on current conditions.
Next, monitor anomalies in both inputs and outputs. An unusual input may represent a real event, a measurement error, a duplicate, a transformation defect, or a regime change. An unusual output may reflect a real business signal or a corrupted upstream calculation. Reviewing both sides gives analysts a better chance of identifying the cause instead of reacting to the symptom.
Finally, track structural change. Added or removed columns, data-type modifications, changed definitions, and altered source-system logic can invalidate a pipeline without producing an obvious software error. Structural monitoring should therefore sit alongside statistical monitoring, not behind it.
Research also highlights why this discipline matters. A MIT life-cycle assessment case study used variance as a proxy for uncertainty and found that its False Signal/False Error Rate fell from 21% initially to 6.1% after 20 parameters were resolved, then stabilized at 5.8% after 39 parameters were resolved (MIT life-cycle assessment case study). The result supports a practical conclusion: iterative refinement of uncertain parameters can materially improve decision reliability. It doesn't mean every model will produce the same improvement.
Compute also matters. In a distributed kinetic Monte Carlo benchmark, parallelization reduced normalized wall time from 19.7 hours per KMC time unit in a serial run to 1.3 hours on 625 processing units, an acceleration of about 15x. A workload that would have taken slightly more than 1.5 years serially was completed in 38 days (distributed kinetic Monte Carlo benchmark). Faster execution can make a model operational, but speed doesn't solve incorrect dependency structures or changing regimes.
That is the unresolved issue in many modern deployments. Reviews point to code complexity, long computation times, and limited tuning data in particle therapy (review of Monte Carlo adoption constraints). A 2025 project-risk paper also describes gaps in integrated cost-schedule analysis, day-by-day risk evolution, and explicit dependencies in which one event changes the timing and probability of later events (2025 project-risk research). The contrarian lesson is important: the hardest part often isn't running more trials. It's representing correlation, time dependence, evolution, and regime change correctly.
digna can support this workflow inside a customer's own environment through in-database execution, private-cloud or on-premises deployment, modular observability capabilities, and a shared dashboard for engineers, analysts, and stakeholders. Its modules cover anomaly detection, validation, timeliness, schema tracking, business monitoring, and platform observability, so teams can begin with the control closest to a critical model and expand as usage grows.
Begin with one critical dataset or KPI. Document its expected behavior, source dependencies, delivery schedule, validation rules, and structural assumptions. Then monitor the inputs and outputs together before extending the same pattern to additional Monte Carlo models.
digna provides in-environment data observability with validation, timeliness monitoring, anomaly detection, schema tracking, and business monitoring for the data that feeds simulation models. Start with one critical dataset or KPI, then visit digna to explore how the platform can help connect simulation outputs with trusted operational evidence.
Frequently asked questions
Where is Monte Carlo simulation actually used?
Across finance, engineering, physics, logistics, healthcare, climate science, manufacturing and project management, following its development in the 1940s by Stanislaw Ulam. That breadth makes the method powerful and also easy to misuse, because the same machinery fits very different data quality realities.
What should you ask before treating a simulation result as decision-ready?
Four questions, starting with which variables genuinely need probability distributions. The others concern the quality of the inputs feeding them, the assumptions baked into the model, and what decision the output is actually going to support.
How is Monte Carlo used in financial risk?
Analysts model uncertain market returns, interest rates, inflation and cash flows for portfolio optimization, Value at Risk, expected shortfall, retirement-income planning, stress testing, derivative pricing and asset-liability analysis. Trust in the result starts with the inputs, not with the engine.
What data controls protect simulation outputs?
Four that apply across industries: validate source records before each run, monitor market or source feed delivery so stale values do not enter current scenarios, compare expected against observed behavior for the risk metrics themselves, and track structural drift before added, removed or retyped columns change the calculation.
How widely is it used in healthcare?
Broadly enough to be catalogued. One systematic review grouped healthcare Monte Carlo applications into categories containing 60, 18, 41 and 23 papers respectively, covering patient pathways, treatment outcomes, economic evaluations and risk-benefit decisions.


