Data Quality Risk Management: A Practical Guide
|
8
min read
A dashboard is stale, but the pipeline is green. A model is producing unfamiliar results, yet no deployment changed. A regulatory report contains inconsistent totals, and the investigation starts with a frantic search through ingestion logs, transformation code, and spreadsheets. In each case, the visible failure appears at the end of the process, while the underlying quality problem may have entered much earlier.
That pattern is familiar to data engineers because traditional data quality work often starts after someone notices business damage. Teams repair records, update a rule, rerun a job, and move on. The same weakness returns when an upstream source changes its schema, a delivery arrives late, or a metric shifts outside its normal behavior.
Data quality risk management treats those events as control failures, not isolated cleanup tickets. The practical objective is to detect abnormal behavior, validate critical records, track delivery expectations, and route incidents before they affect decisions, compliance, or customer-facing systems. This matters at enterprise scale because IBM's widely cited estimate placed the annual cost of poor data quality in the United States at about $3.1 trillion in 2016 (SAP Community discussion of the IBM estimate).
Table of Contents
Why Data Quality Risk Management Matters Now
The cost of reactive cleanup
Understanding the Dimensions of Data Quality Risk
Match dimensions to failure modes
Prioritize by consequence
Building a Data Quality Risk Register
Use operational fields
Sample Data Quality Risk Register Entries
Monitoring Strategies That Catch Risks Early
Anomaly detection
Timeliness monitoring
Schema change monitoring
Designing Controls and Escalation Workflows
Put validation close to the data
Route alerts by impact
Validate statistical assumptions
Measuring Program Effectiveness and Iterating
Measure signal quality, not alert volume
Review the register as a control artifact
Getting Started with Your Data Quality Risk Program
Expand in controlled increments
Why Data Quality Risk Management Matters Now
A data team can have reliable orchestration, successful job statuses, and extensive unit tests while still delivering unusable data. A source may send a valid file with an incomplete business population. A table may load successfully with a renamed column. A report may refresh on schedule using records that no longer match the assumptions behind its calculations.
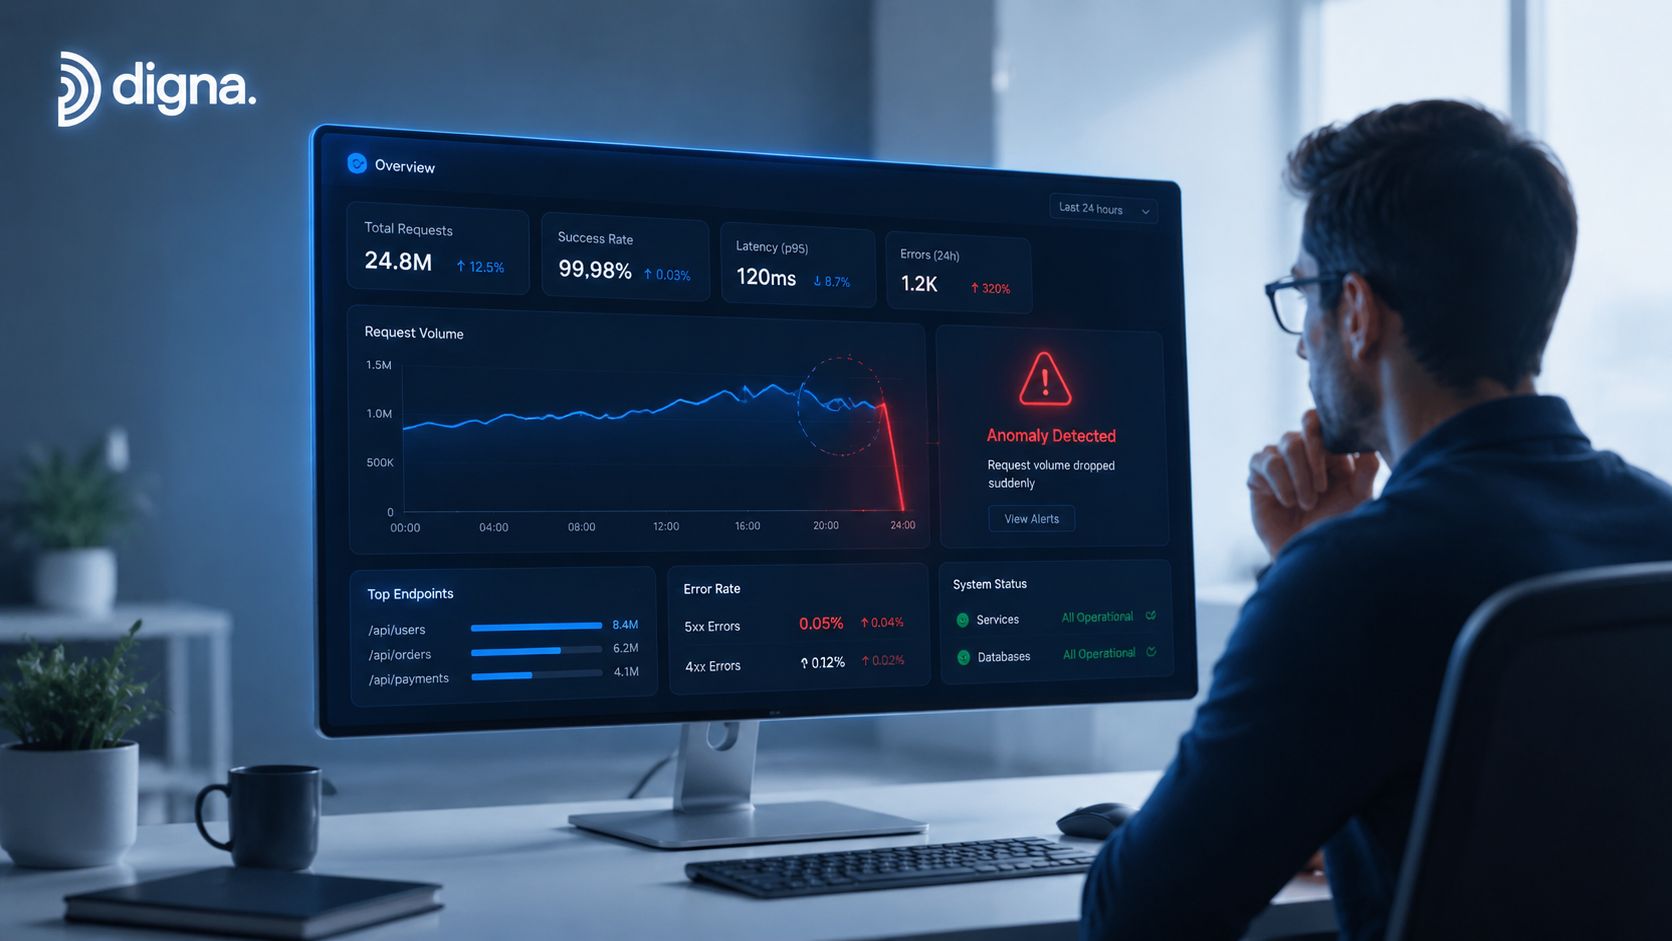
The production symptom usually determines who gets paged. Analysts see a stale dashboard. Compliance teams find an inconsistency. Data scientists question a model output. Engineers then trace the problem across systems that each reported success. That investigation is expensive because a pipeline's technical health and its data's fitness for use are different control questions.
The cost of reactive cleanup
Manual rule maintenance works while the number of sources, tables, and use cases remains manageable. It breaks when teams must encode every expected value, delivery pattern, and structural variation by hand. Periodic audits have a similar limitation. They can identify historical defects, but they won't reliably catch a silent failure between review cycles.
A continuous program watches behavior rather than waiting for a complaint. It compares current volume and distributions with established baselines, evaluates whether data arrived when consumers needed it, and identifies structural changes before downstream logic fails. Record-level validation adds a separate layer for business rules that aggregate monitoring can't see.
Operational rule: A green pipeline status only proves that the workflow completed. It doesn't prove that the resulting data is accurate, timely, coherent, or fit for a decision.
The shift is also organizational. Data quality becomes a shared risk discipline, with owners, severity levels, response paths, and evidence. A useful overview of the business value behind this approach is available in digna's explanation of data quality benefits, but the implementation question remains operational: which failures matter most, how will the team detect them, and what happens after an alert?
Teams should start with the data products that influence regulated reporting, financial decisions, customer operations, or machine learning. They don't need to monitor everything immediately. They need controls at the points where an undetected defect would change an outcome.
Understanding the Dimensions of Data Quality Risk
A pipeline can finish successfully while its output remains unsafe. A numerically accurate table that arrives after a reporting deadline is operationally unusable. A complete table with conflicting definitions across systems can produce a misleading enterprise view. A fresh dataset with an unexpected type change can break downstream consumers without changing any values.
Quality risk therefore needs dimensions that map to observable failure modes. ISO 8000-61:2016 defines processes for data quality management, while the IMF's Data Quality Assessment Framework organizes quality around integrity, methodological soundness, accuracy and reliability, serviceability, and accessibility (ISO 8000-61 reference, IMF Data Quality Assessment Framework). These references support recurring assessment instead of one-time cleansing. Teams can also review this practical guide to the dimensions of data quality when defining their control vocabulary.
Match dimensions to failure modes
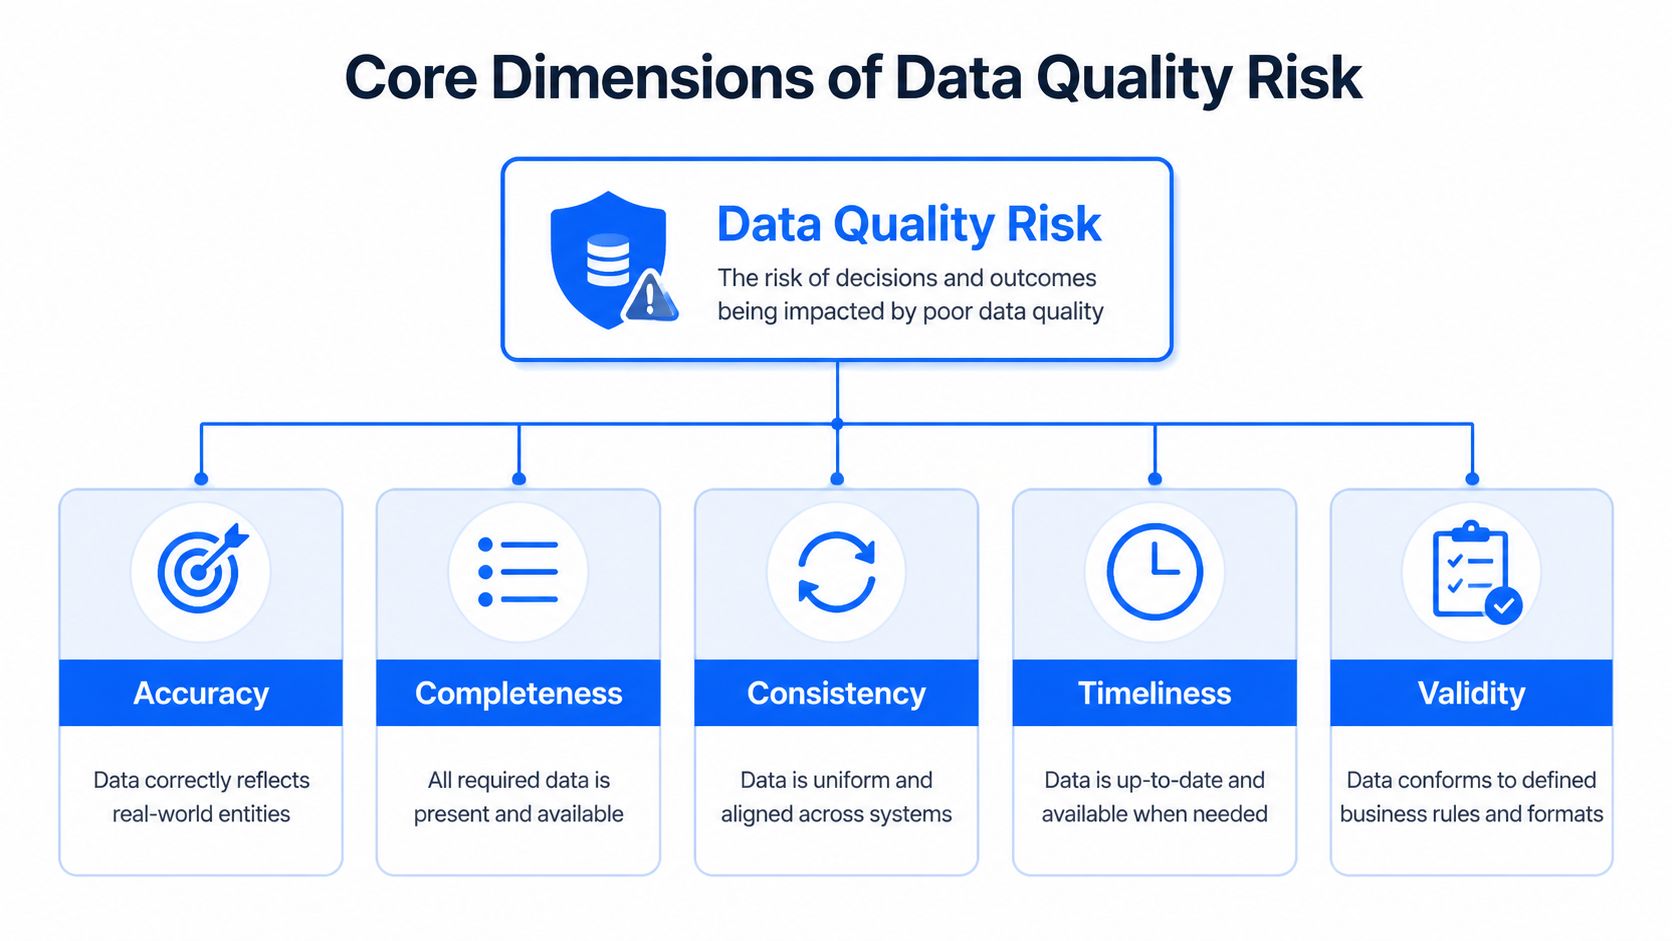
Accuracy asks whether records represent the world or events they describe. An incorrect account status, amount, or customer identifier can distort a decision even when every expected row is present.
Completeness covers required records and fields. Missing optional attributes may be tolerable, while missing identifiers or regulatory fields can stop a process.
Consistency, called coherence in some statistical guidance, checks whether definitions and values agree across systems. Different representations of the same customer, product, or transaction create reconciliation work and can undermine reporting.
Timeliness measures whether data is available when its consumer needs it. A daily planning dataset and an operational risk feed have different delivery expectations, so monitoring must use product-specific thresholds.
Validity checks formats, domains, relationships, and business rules. A value can have the correct data type and still violate an allowed status or relationship.
Prioritize by consequence
Monitoring every column equally wastes engineering effort and produces alert noise. Classify data products by criticality, identify the dimensions that could alter a decision, and connect each risk to a control. Use anomaly detection for unexpected volume or distribution changes, timeliness checks for late or missing loads, and schema tracking for structural changes before consumers fail. The IMF guidance also recognizes relevance, accuracy, timeliness, coherence, interpretability, and accessibility, so accuracy should not become the only monitored dimension.
A practical assessment asks three questions:
What could change? Identify the decision, report, model, or process affected.
How would failure appear? Define the signal, such as a missing load, distribution shift, invalid record, or schema modification.
What response is proportionate? Choose a block, warning, ticket, or trend review based on impact and confidence.
This mapping keeps teams from monitoring what is merely easy to measure. A quality dimension becomes operationally useful when it connects to a named consumer, an observable signal, and a defined response.
Building a Data Quality Risk Register
A risk register should help an engineer decide what to check at two in the morning. Broad entries such as “customer data may be inaccurate” provide no clear action, evidence requirement, or escalation path.
Start with the data assets that support decisions, reports, models, or operational workflows. For each asset, record its owner, consumers, delivery expectation, sensitive fields, upstream dependencies, and known failure modes. Then describe each risk as a cause, event, and consequence. “An upstream team removes a required field, causing the customer eligibility pipeline to produce incomplete decisions” gives responders far more direction than “schema drift.”
Use operational fields
Each entry needs enough detail to prioritize work and support a response:
Risk description: State the failure and its business consequence.
Severity: Describe the impact if the event reaches a consumer. Use critical, high, medium, or low, with definitions agreed internally.
Likelihood: Base this on observed history, source behavior, change frequency, and process complexity rather than intuition.
Owner: Assign the person or team able to investigate and coordinate remediation.
Mitigation: Name the check, gate, fallback, reconciliation, or escalation action.
Evidence: Store alert history, validation results, lineage, and resolution notes.
Review status: Record whether the control is active, noisy, missing, or under reassessment.
The register should distinguish a source problem from a detection problem. If a delivery is late, the source team may own remediation while the platform team owns timeliness monitoring. This division keeps accountability precise and prevents an alert from becoming a substitute for a fix.
For high-priority fields, a catalog of critical data elements can help teams focus controls on records and attributes most likely to affect decisions.
Sample Data Quality Risk Register Entries
Risk Description | Severity | Likelihood | Owner | Mitigation Strategy |
|---|---|---|---|---|
Required upstream column is removed or renamed, breaking downstream transformations | High | Medium | Data platform team | Track schema changes, test compatibility, and stop dependent jobs when the change violates the contract |
Critical pipeline arrives after its consumer's reporting window | High | Medium | Source system owner | Monitor arrival patterns, calculate expected delivery time, and escalate missed loads |
Business rule differs between operational and analytical systems | High | Medium | Data domain owner | Run record-level validation and reconcile outcomes across systems |
Freshness declines without a job failure | Medium | Medium | Analytics engineering team | Monitor delivery and update thresholds when source behavior changes |
Optional fields become unexpectedly null across a source population | Medium | Low | Data steward | Track distributions, investigate the source change, and document accepted exceptions |
Treat the register as a working control record, not a one-time governance document. Review it when a source, integration method, model, or business process changes. Integrated data products can introduce risks through linkage, harmonization, or modeling, not only through the original source. A changed schema, late load, or distribution shift should update the relevant risk entry, its evidence, or its owner.
The register earns its place when it drives monitoring configuration, ownership discussions, and incident reviews. It should show which risks have active controls, which alerts create noise, and which gaps still require engineering work. That connection moves the team from reactive firefighting toward continuous control.
Monitoring Strategies That Catch Risks Early
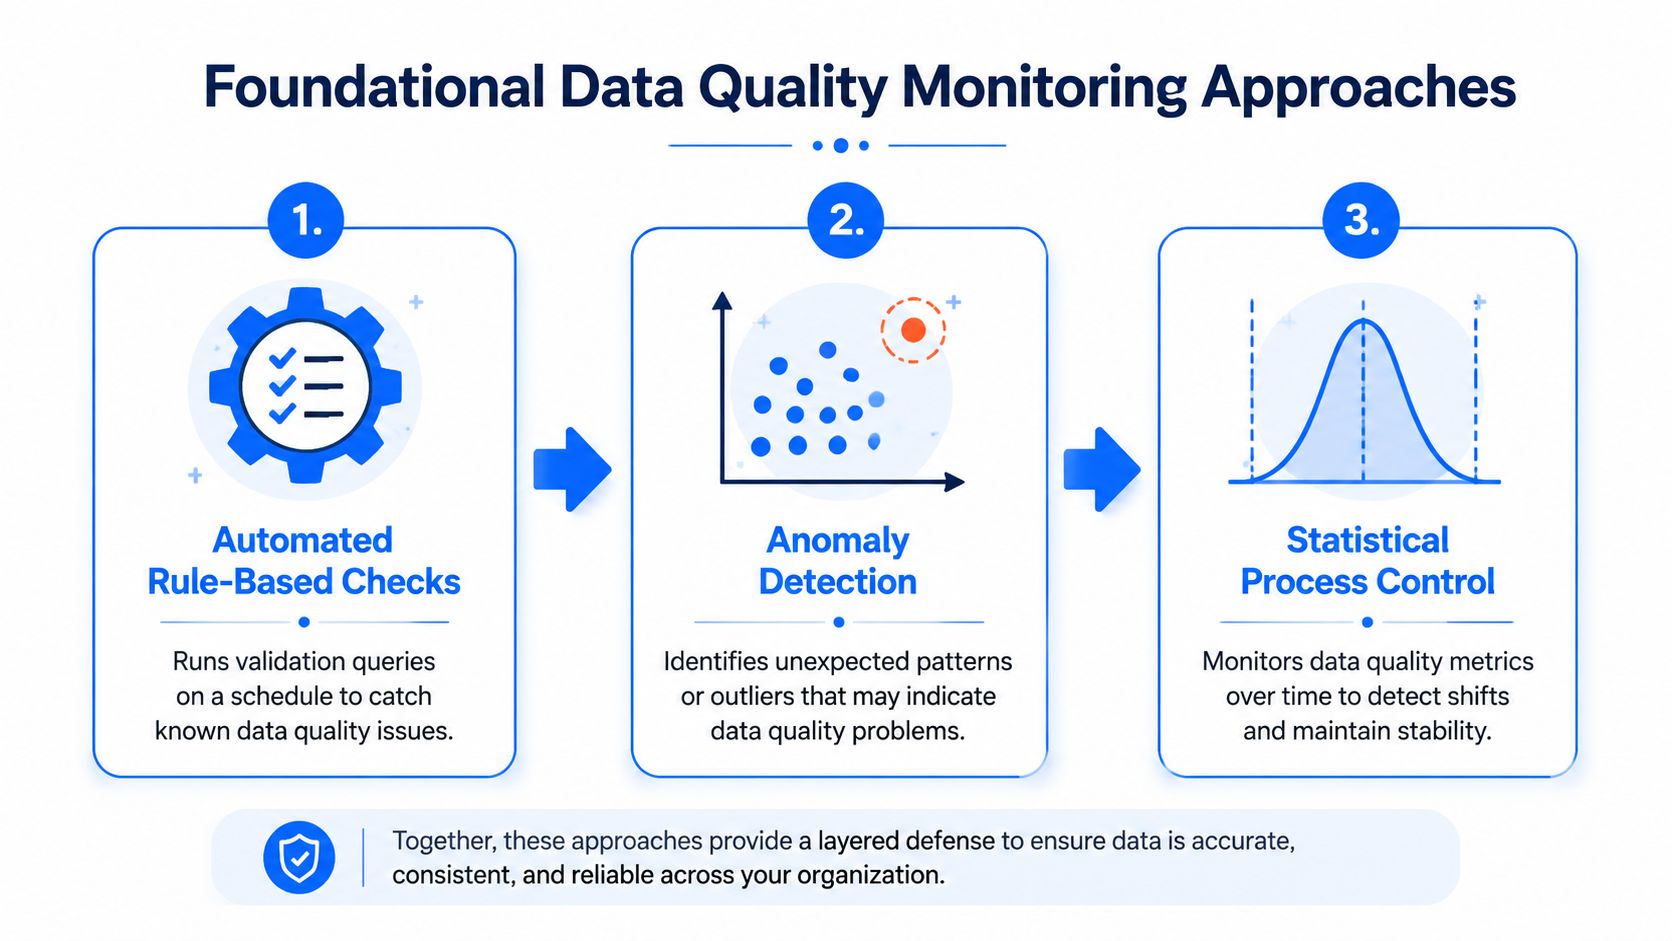
A pipeline can be green while consumers receive unusable data. Production monitoring needs several layers: deterministic rules for known violations, anomaly detection for unfamiliar behavior, timeliness checks for delivery risk, and schema tracking for structural contracts.
Anomaly detection
Baseline learning helps when engineers cannot write a rule for every valid pattern. Monitors can examine volume, null behavior, distributions, and business metrics, then flag material deviations from the dataset's established behavior.
An unusual value is not automatically an incident. Seasonality, planned releases, acquisitions, and legitimate business events can shift a baseline. Separate technical metrics from business metrics, attach operational context to alerts, and let owners label events as expected or unexpected. Those decisions improve later investigations without turning every exception into a permanent manual rule.
Timeliness monitoring
A load can succeed yet still arrive too late for consumers. Track each critical dataset's arrival pattern, including missing, late, and unexpectedly early deliveries. Calculate an expected delivery window from observed behavior, then set the response according to the consumer's deadline.
A late feed may warrant a warning when a downstream dashboard has a fallback. The same delay may require escalation when it affects a regulatory submission or risk calculation. Alert messages should include the last successful arrival, expected window, affected products, and the owner who can confirm source status.
Teams formalizing notification design can use this real time alerting guide to structure alerts around the correct responder and reduce avoidable noise.
Schema change monitoring
Schema drift creates confusing incidents because a source can remain available while consumers interpret its output incorrectly. Track added and removed columns, renamed fields, data type modifications, and changes that violate a documented contract.
A compatible addition may need review without requiring an outage. Removing a required field or changing a type should generally pause dependent processing until the owner confirms the impact. Store the before-and-after schema with the alert so engineers do not have to reconstruct the change from deployment logs.
These signals are most useful in one operational view. A data monitoring and reporting approach should show the anomaly, delivery history, schema event, affected asset, and current incident status together. The tool matters less than retaining context from detection through resolution, so teams can replace reactive firefighting with continuous control.
Designing Controls and Escalation Workflows
An alert becomes a control only after the team defines the response, the data disposition, the accountable owner, and the evidence required for closure. Without those decisions, monitoring produces notifications but does not limit downstream exposure.
Use hard controls when invalid data must not propagate. A pipeline can reject a record with an impossible relationship, pause a downstream publish when a required schema field disappears, or quarantine a batch that violates a critical contract. Use soft controls for unusual but potentially legitimate activity, such as an unexpected business-volume change that needs human review rather than automatic blocking.

Put validation close to the data
Record-level checks enforce rules that aggregate metrics cannot prove. Validate required fields, permitted values, entity relationships, effective dates, duplicate conditions, and regulatory or contractual requirements. Run these checks in the database where practical. Keeping computation near the data reduces movement, respects security boundaries, and avoids loading large tables into application memory.
A practical engineering pattern combines a standardized framework for schema expectations with direct SQL for large business-rule checks. SecurityScorecard describes using Great Expectations for schema validation, DataHub for centralized visibility, and Apache Airflow for orchestration. Its team placed business-rule checks in database-side SQL rather than fetching very large tables into Python (pipeline validation account).
Control design principle: Stop the pipeline when the expected business harm of propagation exceeds the operational cost of blocking it.
Route alerts by impact
A usable escalation path records four decisions:
Issue detected: Capture the exact check, observed value, expected behavior, timestamp, and affected asset.
Team alert: Notify the owner who can investigate, rather than a broad channel without an accountable responder.
Impact analysis: Identify downstream reports, models, consumers, and regulatory processes.
Resolution ticket: Record the fix, data disposition, root cause, and evidence supporting closure.
Page the on-call engineer or data owner for events that can corrupt critical products. Send lower-impact deviations to a review queue. Equal urgency teaches responders to ignore the system.
Teams formalizing ownership and response paths can use this guide to support escalation to define routes and responsibilities. A shared incident view should retain open issues, affected assets, recurrence history, and current status, giving engineers, analysts, and stakeholders the same operational evidence.
Validate statistical assumptions
Anomaly detection still requires judgment. A statistical quality workflow should clarify project objectives and sampling design, review the data, select a suitable method, verify its assumptions, and then draw conclusions (statistical quality workflow).
This sequence limits false positives and false negatives caused by misunderstood data. Outliers, nonrandom missingness, seasonality, or an unsuitable sampling frame can look like quality failures when they reflect the measurement process instead. Choose the simplest valid method, document its assumptions, and require review when those assumptions no longer hold.
Measuring Program Effectiveness and Iterating
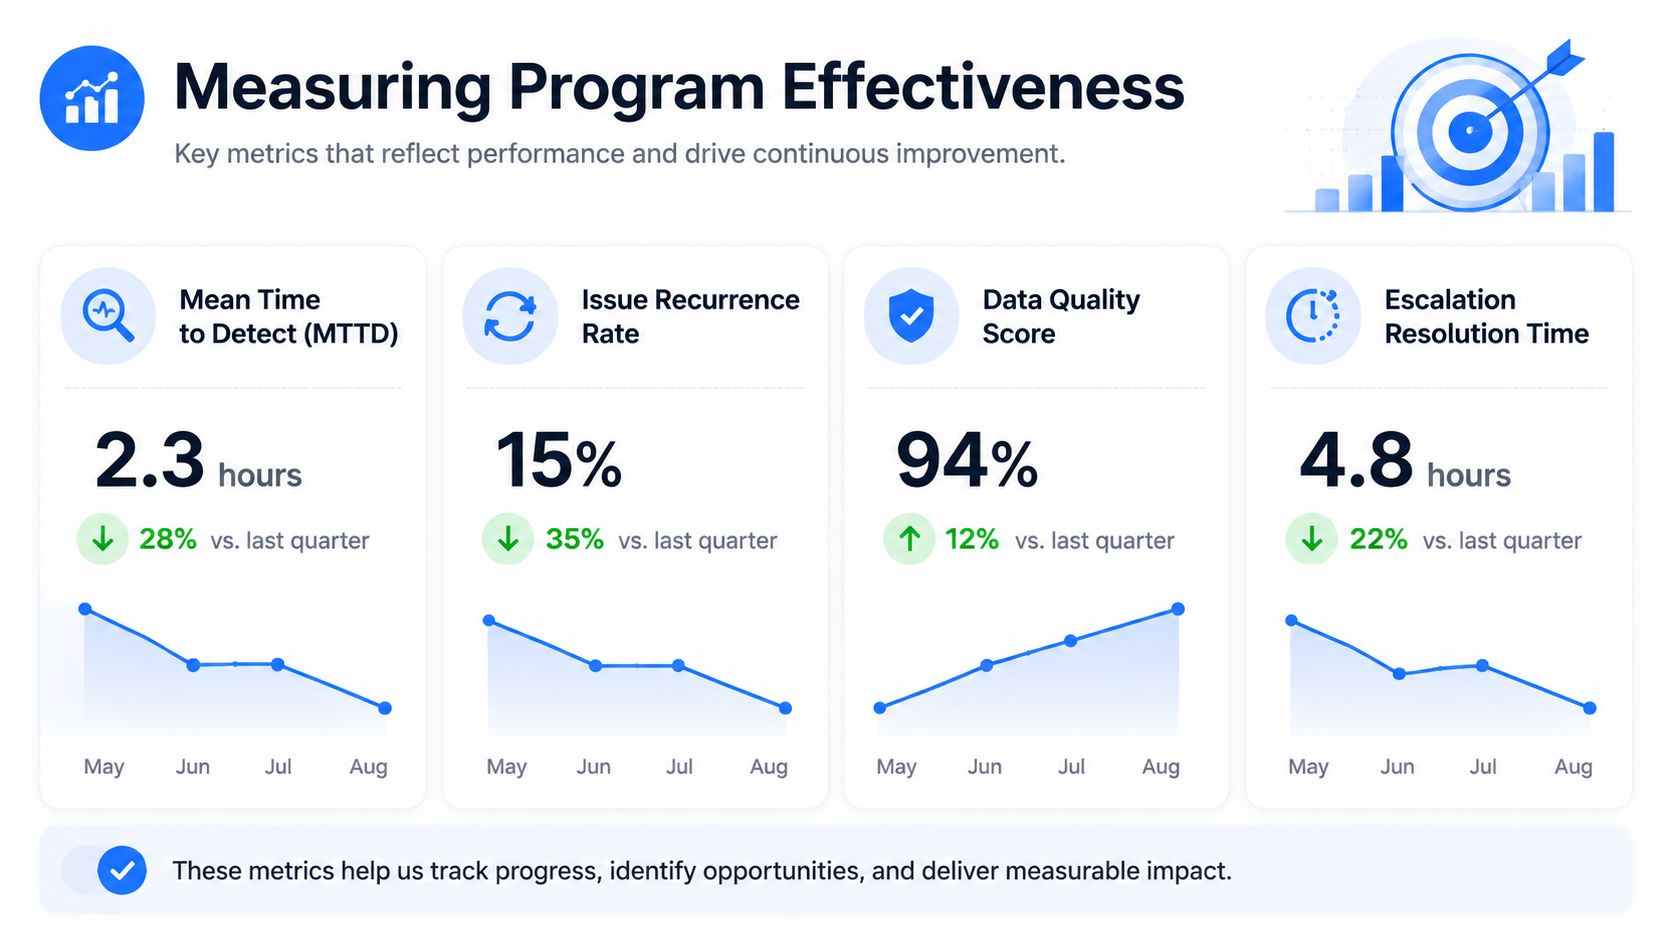
A quality program earns its place in production by reducing exposure, shortening response, or making uncertainty visible. A high dashboard score alone proves little. Measures must connect detection, investigation, control behavior, and business impact.
Track mean time to detect, mean time to resolution, recurrence, false-positive rate, coverage of critical assets, and the share of incidents with an identified owner. Segment results by severity and data product. Otherwise, many low-impact checks can mask a critical feed with weak controls. A practical data quality metrics framework can help standardize these measures across products.
Measure signal quality, not alert volume
A fast alert still creates investigation work if it lacks context. Check whether each notification identifies the affected table, changed behavior, expected baseline, likely owner, and available remediation path. Repeated alerts for an accepted seasonal pattern usually indicate a threshold or baseline problem.
Review historical observability data for volatility, recurring failures, and gradual deterioration. Use those patterns to adjust monitoring scope and control strength. Do not widen thresholds merely to suppress noise. Record the risk that the wider threshold accepts, then verify that the trade-off remains reasonable.
The trust problem can remain after observability is deployed. A 2025 BARC report found that 42% of organizations still didn't trust AI/ML outputs, while 58% had implemented or optimized data observability programs (BARC survey discussion). Monitoring is therefore necessary but insufficient. Teams need anomaly signals alongside timeliness monitoring, schema tracking, and record-level validation to explain why a model or dashboard should be trusted.
Review the register as a control artifact
Incident reviews should update likelihood, severity, ownership, and mitigation status. Add a risk when a source introduces a new integration method or a business process changes. Retire a control only after its underlying risk has been removed, not just because alerts have stopped.
KPMG's 2026 Global Third-Party Risk Management Survey reported that only 17% of organizations described their data quality at the highest level. It also reported that 52% of respondents with high-quality data were very confident in risk-management decisions, compared with 40% of respondents with poor data quality who were not confident (KPMG survey). The operational implication is direct: weak data quality reduces confidence in decisions, including automated risk workflows.
Every incident is evidence about the control system. The objective is faster, more precise detection of consequential failures, with a clear record of how the organization responded.
Getting Started with Your Data Quality Risk Program
Start with one critical data product, not an enterprise-wide inventory exercise. Name its consumers, document the decisions it supports, list its upstream dependencies, and record the failure modes engineers already know. Then select a small control set that covers different risks, such as anomaly detection for behavior, timeliness monitoring for delivery, schema tracking for structure, and record-level validation for business logic.
The first baseline should be observable and revisable. Capture normal arrival behavior, expected volume, important distributions, required fields, and the current schema. Define who receives alerts and when a failure blocks publication. If the team can't explain the response, the check isn't ready for production.
Expand in controlled increments
A modular rollout lets teams learn without creating an unmanageable alert surface:
Begin with the highest-consequence asset: Choose the dataset where failure would affect decisions, compliance, or customer operations.
Add one monitoring capability: Start with timeliness or anomaly detection if the main problem is silent behavior change. Add schema and validation controls as the failure map becomes clearer.
Run checks near the source: In-database execution limits unnecessary movement and keeps sensitive data inside the customer environment.
Review every alert: Label expected changes, tune thresholds, and convert recurring findings into documented controls.
Extend coverage deliberately: Add assets when a new source, model, report, or regulatory process creates a material risk.
Deployment requirements matter in regulated environments. A platform that runs inside a private cloud, VPC, or data center can support local control of production data. In-database checks can align with security requirements, while statistical methods combined with machine learning can adapt anomaly detection to each dataset's baseline behavior. Pricing that avoids API-call or alert-volume charges can also make expansion easier to forecast, though teams should still define active-table scope and ownership before onboarding more data.
Data quality risk management succeeds when it becomes part of release, incident, and change-management routines. Treat quality as an ongoing control system, and teams can detect stale feeds, unstable schemas, unusual behavior, and invalid records before those failures become business incidents.
digna provides an enterprise data quality and observability platform that runs inside your environment, combining anomaly detection, timeliness monitoring, schema tracking, record-level validation, and historical analysis. Visit digna to evaluate a modular starting point for turning critical data quality risks into continuous, actionable controls.
Frequently asked questions
What does data quality risk management change?
It treats incidents as control failures rather than isolated cleanup tickets. That reframing is what moves a team from fixing the same defect repeatedly to asking which control should have caught it and why it did not.
What does a green pipeline status actually prove?
Only that the workflow completed. It does not prove that the resulting data is accurate, timely, coherent or fit for a decision, which is why a team can have reliable orchestration, successful job statuses and extensive unit tests while still delivering unusable data.
Why does reactive cleanup stop scaling?
Because manual rule maintenance only works while the number of sources, tables and use cases stays manageable. Past that point a continuous program that watches behavior replaces the model of waiting for a complaint and writing another rule.
Where should a risk program start?
With the data products that influence regulated reporting, financial decisions, customer operations or machine learning. Starting there ties the first controls to consequences that are already visible to people outside the data team.
How large is the cost at national scale?
IBM's widely cited estimate placed the annual cost of poor data quality in the United States at about $3.1 trillion in 2016. Figures at that scale are directional rather than precise, but they explain why the discipline moved from cleanup to risk.



