Data Quality Databricks: An Implementation Guide 2026
|
7
min read

A new Databricks project usually starts clean. The schemas make sense, the medallion layers look tidy, and the first dashboards are accurate. Then a late upstream file lands, a source system adds a nullable field without warning, or a reference table stops updating. Nobody notices until finance challenges a KPI or an ML feature pipeline starts feeding degraded inputs into production.
That's the moment it becomes clear data quality on Databricks isn't a single feature. It's an operating model. You need controls at ingestion, validation in transformation layers, monitoring after deployment, and a way to distinguish noise from incidents that matter. If you want a quick primer on why this matters at the platform level, this overview of what data quality means in practice is a useful companion read.
The same pressure shows up in governance work. Once dashboards, models, and regulatory reporting depend on the same Lakehouse, quality and trust become inseparable from data security compliance. A broken metric is bad. A broken metric with unclear ownership and weak controls is worse.
Table of Contents
Why Data Quality on Databricks Is Not Optional
A revenue dashboard can be technically “up” and still be wrong. That's the dangerous failure mode in Databricks. The table refresh finishes, the job reports success, and downstream users trust numbers that were already corrupted in Bronze or drifted in Silver.
The same thing happens in ML pipelines. Features still materialize, but value distributions shift, reference keys stop matching, or record-level business rules stop holding. Native pipeline success doesn't mean analytical correctness.
Practical rule: Treat data quality failures like production defects, not like reporting clean-up tasks.
As Lakehouse estates grow, manual checks don't keep up. One analyst-owned SQL assertion here and one notebook-based null check there won't protect a platform with shared tables, streaming inputs, and multiple consumer teams. What works is a layered model: enforce what you can at ingestion, validate more aggressively during transformation, monitor behavior over time, and route incidents to owners who can act.
Three realities make this non-optional in Databricks:
Shared data products raise blast radius. A single malformed dimension or stale fact table can affect BI, data science, reverse ETL, and compliance reporting at the same time.
Schema checks alone aren't enough. A table can match its schema and still violate the business logic that consumers depend on.
Reactive detection is too late. By the time a dashboard breaks, bad data has already moved through jobs, dependencies, and cached outputs.
That's why strong Data Quality Databricks design starts with architecture, not tools. The platform gives you useful building blocks. It doesn't give you a complete strategy by default.
Architecting Your Data Quality Framework
The most reliable pattern is to align quality controls with how data moves through the Lakehouse. In Databricks, that usually means making the medallion architecture do double duty: one role for transformation, another for progressively tighter validation.

Teams that skip this and drop every check into one place usually get one of two bad outcomes. Either they over-police Bronze and slow ingestion, or they wait until Gold and let flawed data propagate too far. If you need a broader operational perspective on how better inputs affect outcomes, this piece on how to fix bad data and boost revenue is worth reading.
For Databricks-specific observability patterns, the Databricks observability guide from digna is a useful reference for how layered controls fit into a larger monitoring model.
Use the medallion layers as quality boundaries
Bronze is where you protect ingestion, not where you solve every semantics problem. Enforce explicit schemas, capture lineage metadata, quarantine malformed records, and preserve raw payloads when possible. The key is to stop structural corruption early without turning ingestion into a brittle bottleneck.
Silver is where most quality work belongs. This is the layer for standardization, deduplication, referential checks, domain constraints, and record validation that aligns source data to business-ready structures. If your project has customer, order, billing, or policy entities, Silver is usually where those relationships become enforceable.
Gold should be narrow and opinionated. By this point, the checks should focus on business integrity: metric definitions, aggregate reconciliations, publish readiness, and timeliness for downstream consumption.
A practical split looks like this:
Layer | Primary checks | Main goal |
|---|---|---|
Bronze | Schema enforcement, parseability, null handling on required ingestion fields | Prevent raw corruption |
Silver | Deduplication, key integrity, standardization, business rule validation | Produce trusted entities |
Gold | KPI reconciliation, semantic consistency, freshness for consumers | Protect decision-ready outputs |
A good rule is simple. The earlier the check, the cheaper the fix. The later the check, the more business-specific it should be.
Make Unity Catalog the control plane
Quality checks without ownership become background noise. Unity Catalog matters because it gives teams a shared governance layer for datasets, lineage, and access boundaries. It helps answer the operational questions that matter during an incident: who owns this table, what depends on it, and what changed upstream.
Use Unity Catalog to formalize these practices:
Assign clear ownership. Every published dataset should have an accountable team, not a generic platform alias.
Separate criticality tiers. Revenue, finance, regulatory, and ML feature tables shouldn't inherit the same alerting policy as exploratory datasets.
Use lineage during triage. When a Gold dashboard fails, engineers should be able to move upstream through dependent Silver and Bronze assets quickly.
Keep validation metadata close to the data. Contracts, expectations, and monitoring context are more useful when they're discoverable next to the governed assets.
This architectural view matters more than any single tool choice. If the layers are wrong, adding another rules engine won't save the project.
Implementing Quality with Native Databricks Features
Databricks-native features are the right place to start because they sit inside the platform your team already operates. For a new project, I'd use them first for baseline controls before adding anything else.
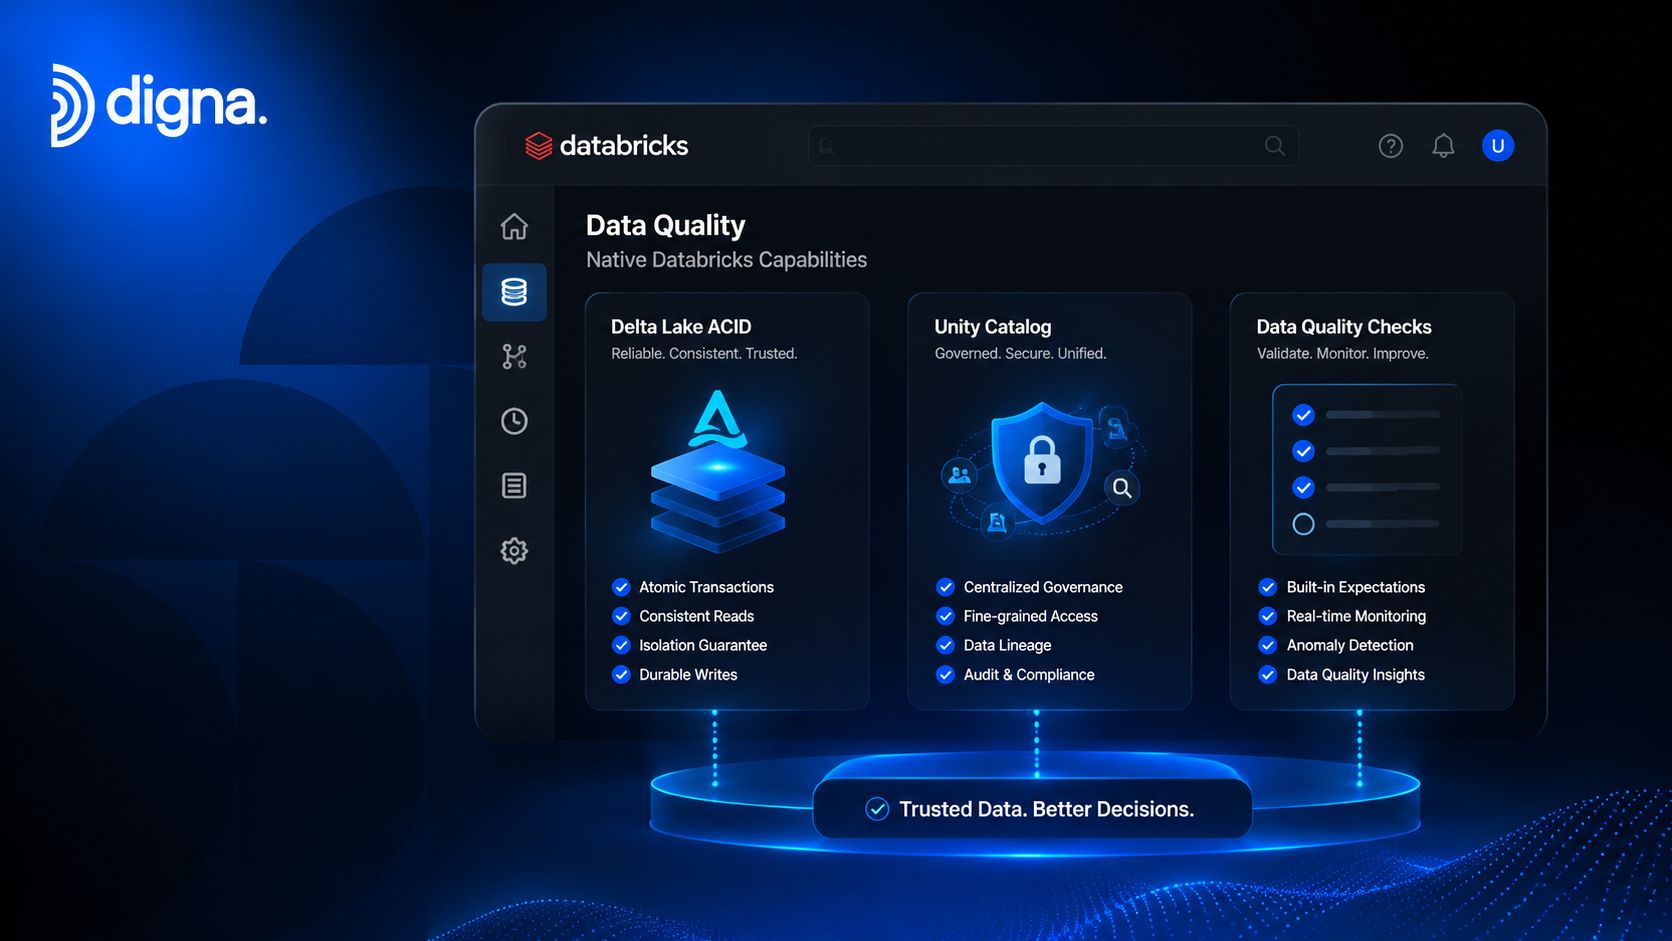
Where Delta Live Tables works well
Delta Live Tables gives you a clean way to express expectations and decide what should happen when records violate them. That's useful because pipeline behavior becomes explicit. You can fail, drop, or quarantine based on the severity of the issue.
One verified advantage is that implementing Delta Live Tables with ON VIOLATION clauses can achieve a 92% reduction in data downtime by quarantining invalid records instead of failing entire pipelines, and enforcing explicit schema constraints through Delta Lake before ingestion prevents 85% of downstream pipeline brokenness caused by silent schema drift, according to Atlan's Databricks data quality write-up.
That pattern works especially well for:
Required-field enforcement at ingestion
Simple domain constraints like positive amounts or valid date ranges
Quarantine flows that let the rest of the batch continue
Foundational contract enforcement between upstream producers and Lakehouse tables
What Lakehouse Monitoring adds
Lakehouse Monitoring handles a different problem. It observes metrics over time rather than just checking whether a current write violates a predefined rule. That's valuable when data “looks valid” structurally but behavior shifts in a way that affects trust.
A useful verified benchmark here is that Databricks Lakehouse Monitoring, described as an AI-powered monitoring service, enables real-time data quality prediction with 88% accuracy by tracking custom metrics tied to business logic and correlating alerts with Unity Catalog lineage for root-cause analysis. The same source says organizations using automated contract-based testing with continuous observability reduce data quality incidents by 75%. Those figures come from XenonStack's Databricks quality standards article.
Native monitoring is strongest when you already know which metrics matter and want the platform to watch them consistently.
For a new Databricks deployment, I'd use native monitoring for:
Freshness and completeness metrics on shared tables
Null rate and duplicate tracking on high-value entities
Drift indicators on important dimensions and features
Lineage-aware triage so incidents route faster
Where native features hit a ceiling
Many implementations stall because, while Databricks supports constraints such as NOT NULL and CHECK, its native model is limited for nuanced, record-level business logic across multiple columns and audit-heavy requirements. Databricks' native focus leans toward schema enforcement and broad freshness or completeness checks rather than rich record validation. That gap is documented in Databricks' own data quality management material.
Timeliness is another weak spot. Native anomaly detection can monitor freshness by predicting the next commit time and marking a table stale if it's late, but it doesn't calculate expected delivery time from user-defined schedules or historical business SLAs in the more proactive way many teams need. That limitation is described in Microsoft's Unity Catalog data quality monitoring documentation.
So the practical takeaway is straightforward. Native Databricks is strong for baseline enforcement and platform-integrated monitoring. It's weaker when you need business-rule depth, expected-arrival monitoring, or broad cross-dataset policy management.
Extending Quality with Open Source and Enterprise Platforms
Once native controls are in place, the next question is whether to extend with open source, move to an enterprise platform, or combine both. There isn't one right answer. The right choice depends on how much custom logic you need, how much operational overhead your team can absorb, and whether timeliness and observability are business-critical.

A useful comparison resource is this roundup of open-source data observability tools, especially if you're evaluating where framework-based validation stops and broader operational monitoring begins.
What open source does well
Tools like Great Expectations and Deequ fit well when your team wants declarative, test-like assertions and is comfortable owning the framework. They're a good match for analytics engineering teams that already think in contracts and validations.
Open source is attractive for three reasons:
Rule expressiveness. You can define richer expectations than you typically get from warehouse constraints alone.
Developer ergonomics. Tests live close to code, which makes them easier to review in pull requests.
Control. Teams can tailor the framework to local conventions and pipeline styles.
If your project is still early and the main challenge is validating transformation outputs, open source often gives you enough coverage without forcing a bigger platform decision.
Where operational overhead starts to hurt
The trouble starts at scale. Someone has to own framework upgrades, result storage, scheduling, flaky test suppression, alert routing, and cross-project consistency. The more domains you onboard, the more “simple validation” turns into another internal product.
This is also where static rules become expensive. Teams write dozens of thresholds, then spend time revisiting them because data seasonality, source volatility, and business cycles keep changing. Traditional checks still matter, but they don't adapt well on their own.
Open source is excellent for declared expectations. It's less elegant for estate-wide observability, adaptive anomaly detection, and operational workflows that non-specialists need to use.
When an enterprise platform makes sense
An enterprise platform makes sense when you need broader coverage than rule execution alone. That usually means one or more of the following are true:
Need | Native Databricks | Open source | Enterprise platform |
|---|---|---|---|
Basic schema and pipeline constraints | Strong | Moderate | Strong |
Complex record validation | Limited | Strong with engineering effort | Strong |
Adaptive anomaly detection | Developing | Usually custom-built | Built-in on some platforms |
Proactive timeliness monitoring | Limited | Usually custom-built | Available on some platforms |
Centralized operations across many datasets | Moderate | Harder to scale | Strong |
For anomaly detection specifically, AI-powered systems use machine learning to identify unusual patterns without predefined rules and adapt as environments change, which helps catch deviations that static thresholds miss, as described in Plixer's overview of AI-powered anomaly detection. At the model level, unsupervised methods such as Isolation Forests and autoencoders detect anomalies in unlabeled data, with autoencoders flagging points they can't reconstruct well from compressed representations, as explained by MindBridge's anomaly detection guide.
One example in this category is digna. Verified product information shows that modern data quality platforms like digna automate advanced algorithms including Isolation Forests and autoencoders, require no ML expertise, calculate metrics in-database, learn baselines, and flag anomalies without manual rule maintenance or Python coding while keeping customer data private in their environment, according to digna's anomaly detection techniques page. Digna also officially launched Release 2026.04 on April 15, 2026, adding time-series analytics such as linear, quadratic, cubic, and piecewise regression, reusable enumerations, validation rule templates, and in-database statistical computation with no vendor data access, based on this Newsfile release. A separate release notes update says the platform supports global database connections, multiple source connections per project, referential integrity checks, multi-column uniqueness checks, module-specific notifications, CSV inspection exports, and an anomaly relevance condition for reducing noise, according to this Yahoo Finance coverage.
That doesn't make enterprise software mandatory. It means there's a clear maturity point where teams stop asking, “Can we script this?” and start asking, “Do we want to keep owning this ourselves?”
Automating Quality Checks in Your CI/CD Pipeline
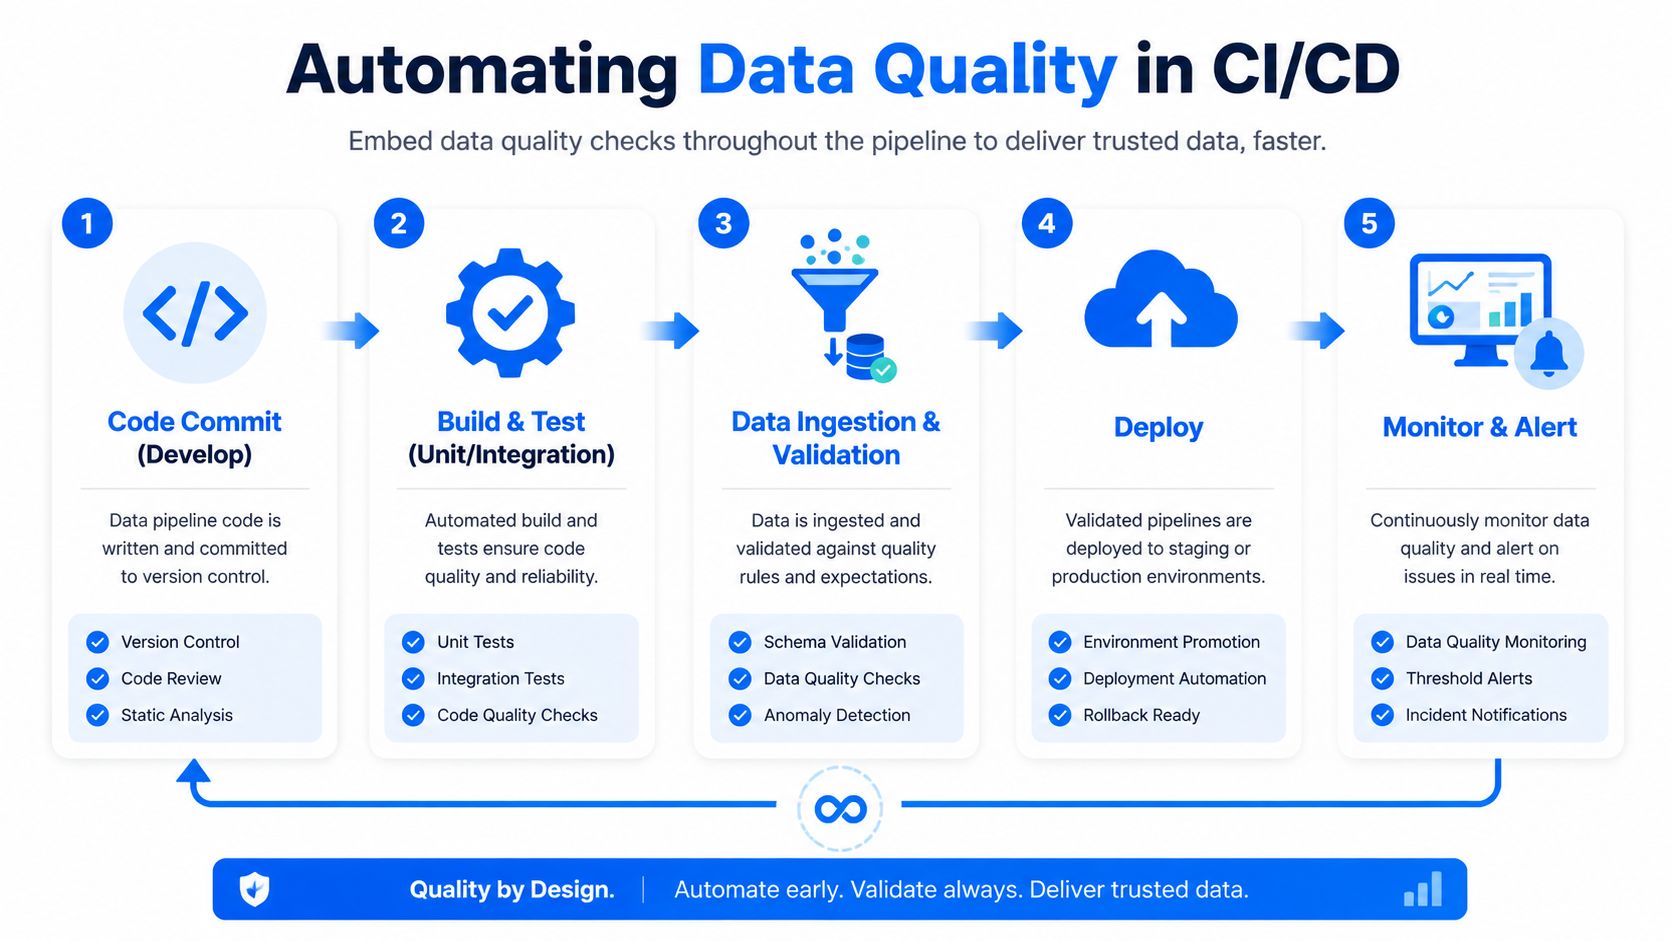
Data quality gets more reliable when it becomes part of delivery, not a manual gate after deployment. The target state is simple: every change to pipeline code, transformation logic, or contract definitions triggers quality checks before production data consumers feel the impact.
If your stack already includes dbt, freshness checks are often the cleanest starting point for pipeline-aware monitoring. This guide to dbt source freshness patterns is useful when you want timeliness checks to participate in release workflows instead of living in a separate operational silo.
A practical deployment workflow
The implementation doesn't need to be complicated. What matters is that quality checks exist at multiple points, each with a different purpose.
On pull request, run lightweight checks. Validate SQL, transformation logic, schema contracts, and rule definitions. Keep this fast enough that developers won't bypass it.
On merge to main, run integration-grade checks against controlled data, with open-source expectations or warehouse-native validations proving that the pipeline still produces compliant outputs.
Before production deployment, apply publish gates for critical tables. If a key contract fails, stop the release.
After deployment, trigger monitoring refreshes and route alerts to the right owners.
The principle is consistent. Development catches logic mistakes. Deployment gates catch breaking changes. Runtime monitoring catches behavioral drift that tests couldn't predict.
Alerting without creating noise
Teams often don't fail because they lack alerts. They fail because they create too many low-value alerts, and engineers stop trusting them.
Use a tiered model:
Blockers should fail the pipeline. Examples include missing required columns, invalid primary business keys, or unrecoverable contract breaks.
Warnings should notify but not block. Drift in optional dimensions or moderate freshness delay often belongs here.
Trend-based incidents should go to operational channels with enough context for triage.
Unity Catalog lineage is especially useful after a failed check. It helps responders see whether the problem began in an ingestion table, a transformation step, or a reference dependency. That shortens root-cause analysis and prevents teams from debugging the wrong layer first.
A few practical standards help:
Keep rule definitions versioned. A data contract outside source control won't survive team growth.
Test quarantine behavior. Don't just test the happy path. Confirm that invalid data lands where engineers can inspect it.
Separate deploy-time checks from runtime monitoring. CI should stay deterministic. Production monitoring should stay adaptive.
The best CI/CD quality design feels boring. Developers know what gets checked, critical failures are predictable, and downstream consumers rarely discover issues before engineering does.
Common Data Quality Pitfalls and Best Practices
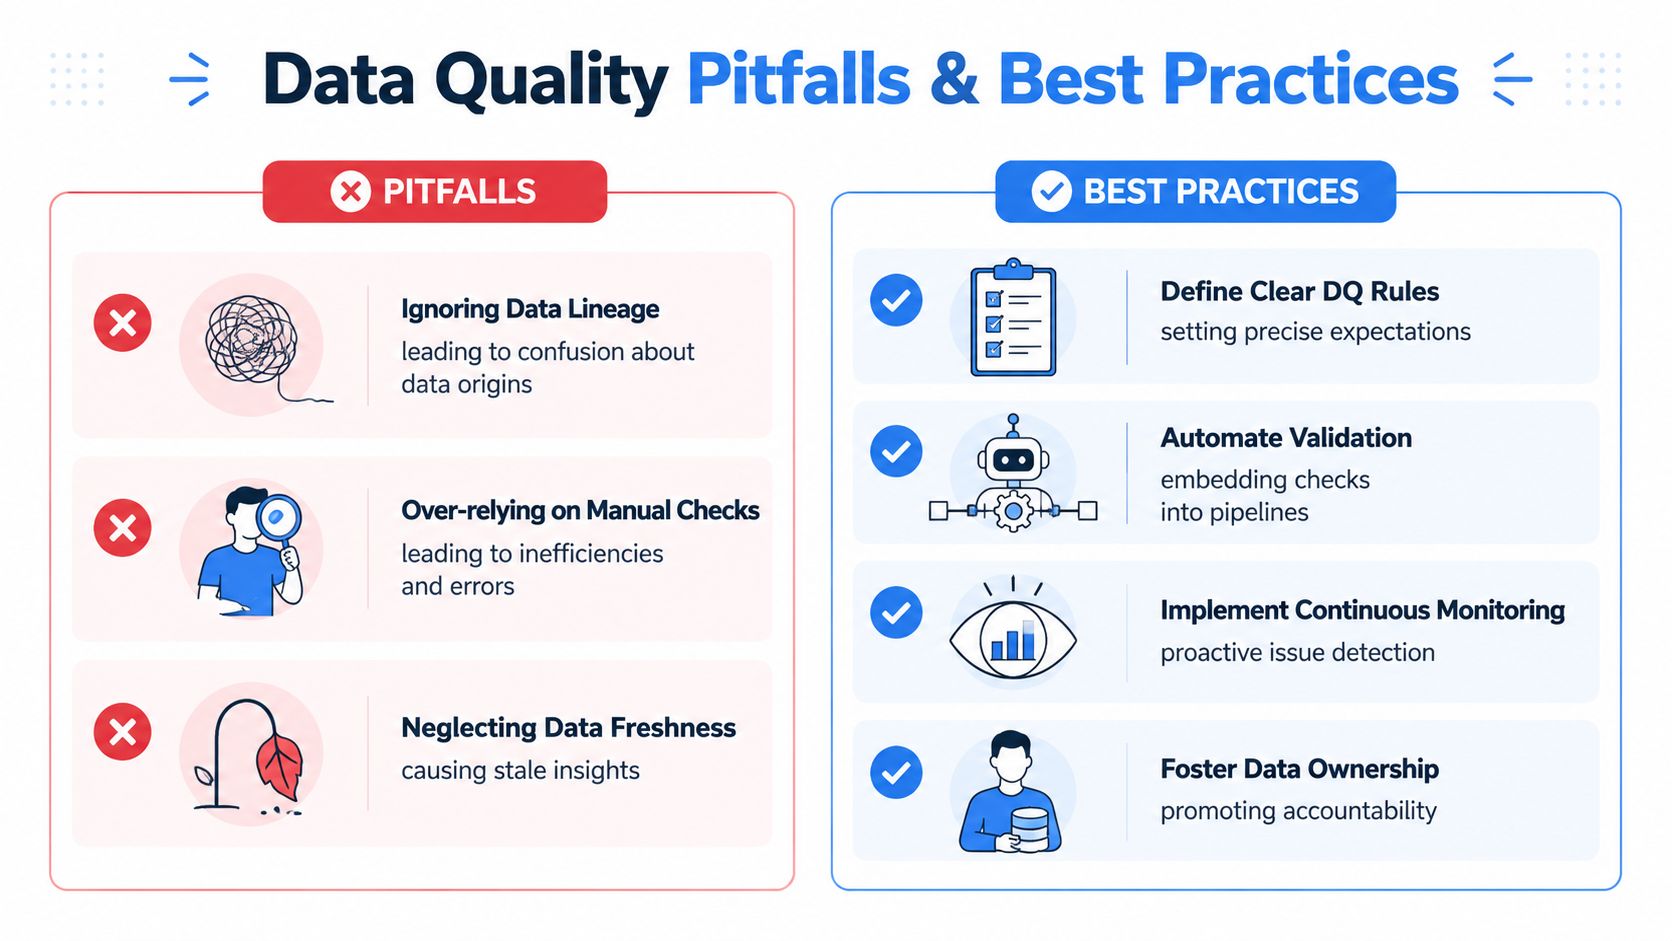
Most Databricks quality failures aren't exotic. They're usually the result of a few predictable shortcuts repeated across pipelines, teams, and deadlines.
Pitfalls that show up early
The first is schema inference. It feels convenient during initial ingestion, but it creates instability later. One verified warning is that relying on schema inference rather than explicit definition leads to a 40% increase in null percentage anomalies within 6 months of production deployment, and the recommended practice is to use Unity Catalog's built-in metrics to detect drift early, according to Atlan's Databricks data quality reference.
The second is leaving timeliness until a dashboard fails. Freshness checks added after a business user raises a ticket are already late. Teams need expected-arrival thinking, not just stale-table detection.
The third is assuming software QA practices don't apply to data pipelines. They do. Many of the habits from application engineering transfer well, especially versioned test suites, release gates, and defect ownership. This overview of software quality assurance strategies is a solid reminder that quality discipline isn't unique to apps.
Bad data pipelines rarely fail because nobody cared. They fail because ownership, validation, and monitoring were treated as separate problems.
Practices worth standardizing
A durable operating model usually includes these habits:
Define explicit schemas early. Convenience during ingestion creates cleanup work later.
Place checks where they're cheapest. Structural issues belong near Bronze, entity integrity in Silver, and business reconciliation in Gold.
Assign dataset owners in governance metadata. An alert without an owner is just log noise.
Use adaptive monitoring for changing signals. Static thresholds break down on seasonal or fast-moving data.
Keep remediation paths clear. Engineers need quarantine tables, inspection outputs, and lineage context, not just a failed job message.
A good quality program isn't the one with the most rules. It's the one that helps the team catch the right failures early, route them to the right people, and recover without guesswork.
If your Databricks environment has moved beyond basic constraints and you need record-level validation, timeliness monitoring, and in-database anomaly detection in one operating model, digna is one option to evaluate alongside your native and open-source stack.
See how digna does this in practice: Databricks data quality monitoring.
Frequently asked questions
How do you ensure data quality in Databricks?
Use a layered model rather than a single feature. Enforce what you can at ingestion, validate more aggressively during transformation, monitor behavior over time, and route incidents to owners who can act. In Databricks, the medallion architecture and Unity Catalog give that model its structure and ownership.
Which data quality checks belong in the Bronze, Silver, and Gold layers?
Bronze handles schema enforcement, parseability, and null handling on required ingestion fields. Silver carries most of the work: deduplication, key integrity, standardization, and business rule validation. Gold stays narrow, with KPI reconciliation, semantic consistency, and freshness for consumers. The earlier the check, the cheaper the fix.
How do Delta Live Tables expectations handle bad records?
Delta Live Tables lets you declare expectations and decide whether violating records fail the pipeline, get dropped, or are quarantined. Atlan figures cited in the article say ON VIOLATION clauses that quarantine invalid records instead of failing entire pipelines can reduce data downtime by 92%, while the rest of the batch continues.
What are the limits of native Databricks data quality features?
Native constraints like NOT NULL and CHECK struggle with nuanced, record-level business logic across multiple columns and audit-heavy requirements. Timeliness is another gap: native freshness monitoring predicts the next commit time but does not calculate expected delivery from user-defined schedules or historical business SLAs.
How do you add data quality checks to a Databricks CI/CD pipeline?
Run lightweight checks on pull requests, integration-grade checks on merge to main, publish gates for critical tables before production deployment, and monitoring refreshes after deployment. Tier the alerts: blockers fail the pipeline, warnings notify without blocking, and trend-based incidents go to operational channels with triage context.



