How to Measure Reliability: Data, Pipelines, & ML
|
7
min read

You're probably dealing with this right now. A dashboard that looked fine yesterday is suddenly wrong. A model input table picked up a silent schema change. A finance report is stale, but the pipeline says “success.” Everyone asks the same question: can we trust the data?
That's the fundamental problem behind how to measure reliability. In enterprise warehouses, reliability isn't a lab exercise. It's an operational discipline. If you only validate sampled extracts outside the warehouse, you miss the failures that happen inside live pipelines, on production tables, and across changing schemas. Modern teams need a way to measure reliability where the data already lives.
Table of Contents
Why Your Dashboards and ML Models Keep Breaking
Monday morning failures rarely look dramatic at first. A sales dashboard shows negative revenue. A churn model starts scoring everyone as low risk because one source table stopped updating. A customer support dashboard drops half its categories because a join key changed upstream. The warehouse is still running, but trust is gone.
That's why reliability has to be measured in business terms, not just technical checks. The cleanest operational metric is data downtime, calculated as Number of incidents × (average time to detection + average time to resolution), and the benchmark many teams use is that top-tier enterprises target less than 1% annually, while average organizations often see 5–10% of data assets unusable according to Monte Carlo's explanation of data downtime.
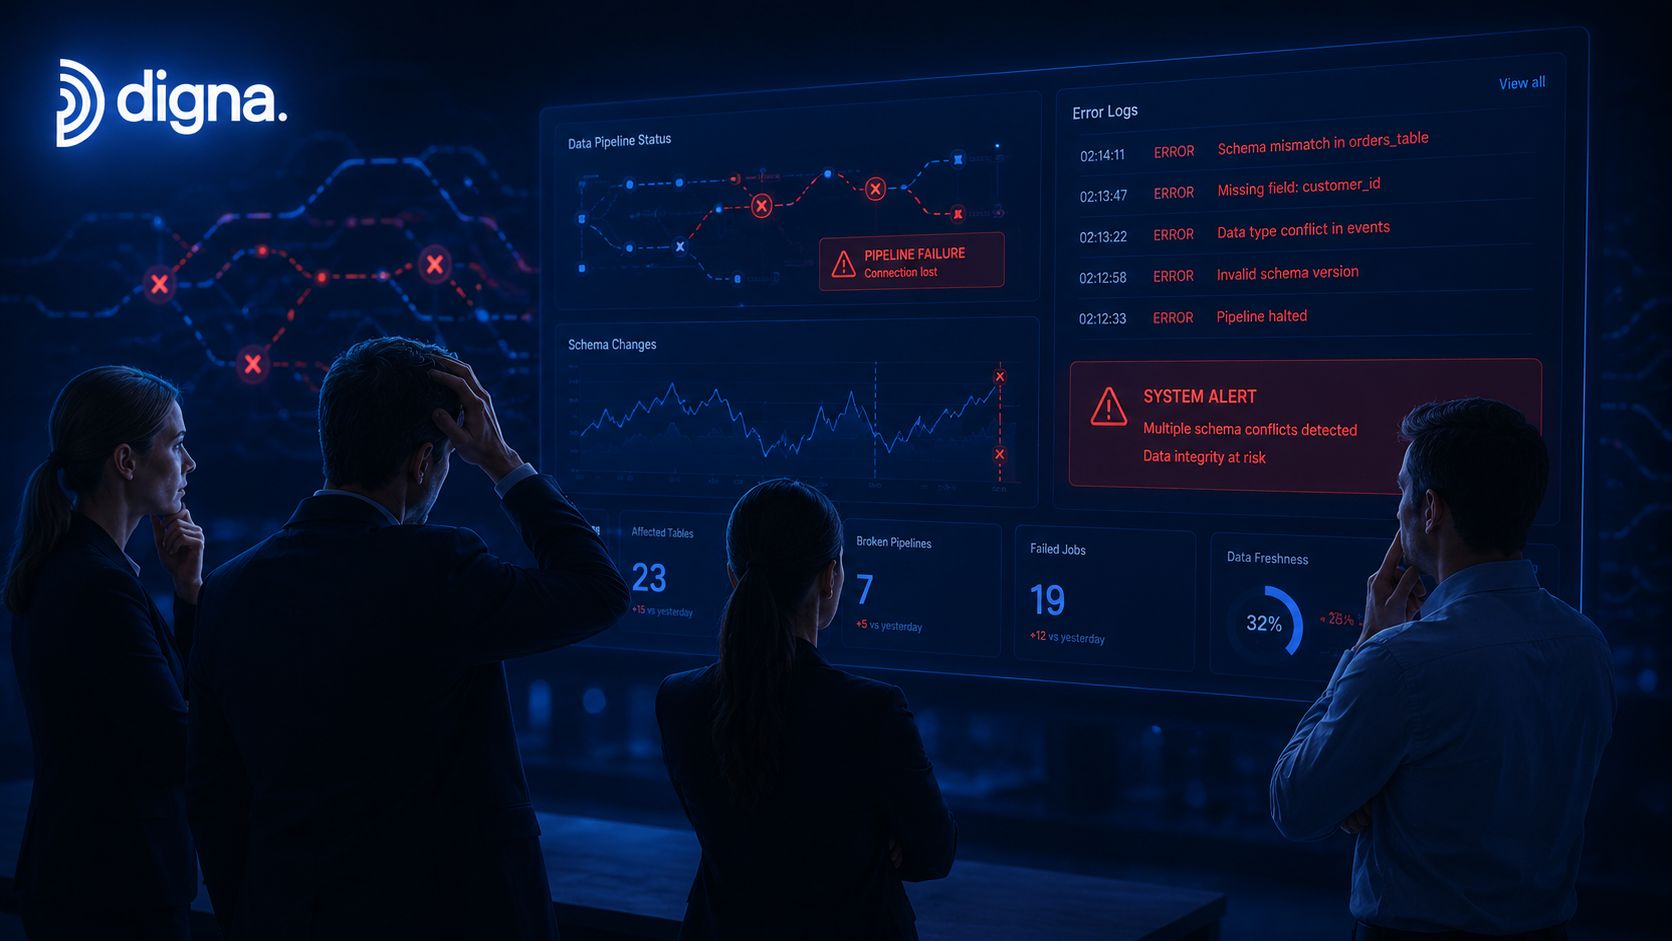
Reliability failures usually start upstream
Most bad incidents don't begin with a dashboard. They begin with one of these conditions:
A pipeline completed with bad outputs. Orchestration marked the job green, but nulls spiked in a critical field.
A schema shifted unannounced. A column type changed, a field disappeared, or a source team renamed an attribute.
A source delivered late. Reports refreshed on schedule, but with yesterday's partial data.
A model consumed stale features. The feature store looked available, but one partition never landed.
Security can also be part of the same failure path. If AI agents or automation layers access enterprise data without strong controls, reliability and governance start to overlap. Teams thinking through that operational boundary will find the AI agent security guide for enterprises useful because it frames where data access risk turns into downstream trust issues.
Stakeholders care about trust, not your orchestration graph
A VP doesn't ask whether an Airflow task retried successfully. They ask whether the number on the screen is safe to use. That's why reliability work gets traction when you connect incidents to downtime, missed SLAs, and lost confidence in analytics.
Practical rule: If the business can't tell whether data is usable, you already have a reliability problem.
Teams that want fewer production surprises should also study recurring pipeline failure patterns, especially around late detection and hidden breakage in production data flows. A useful reference is this breakdown of why data pipelines fail in production and how to detect issues early.
The Four Pillars of Data Reliability
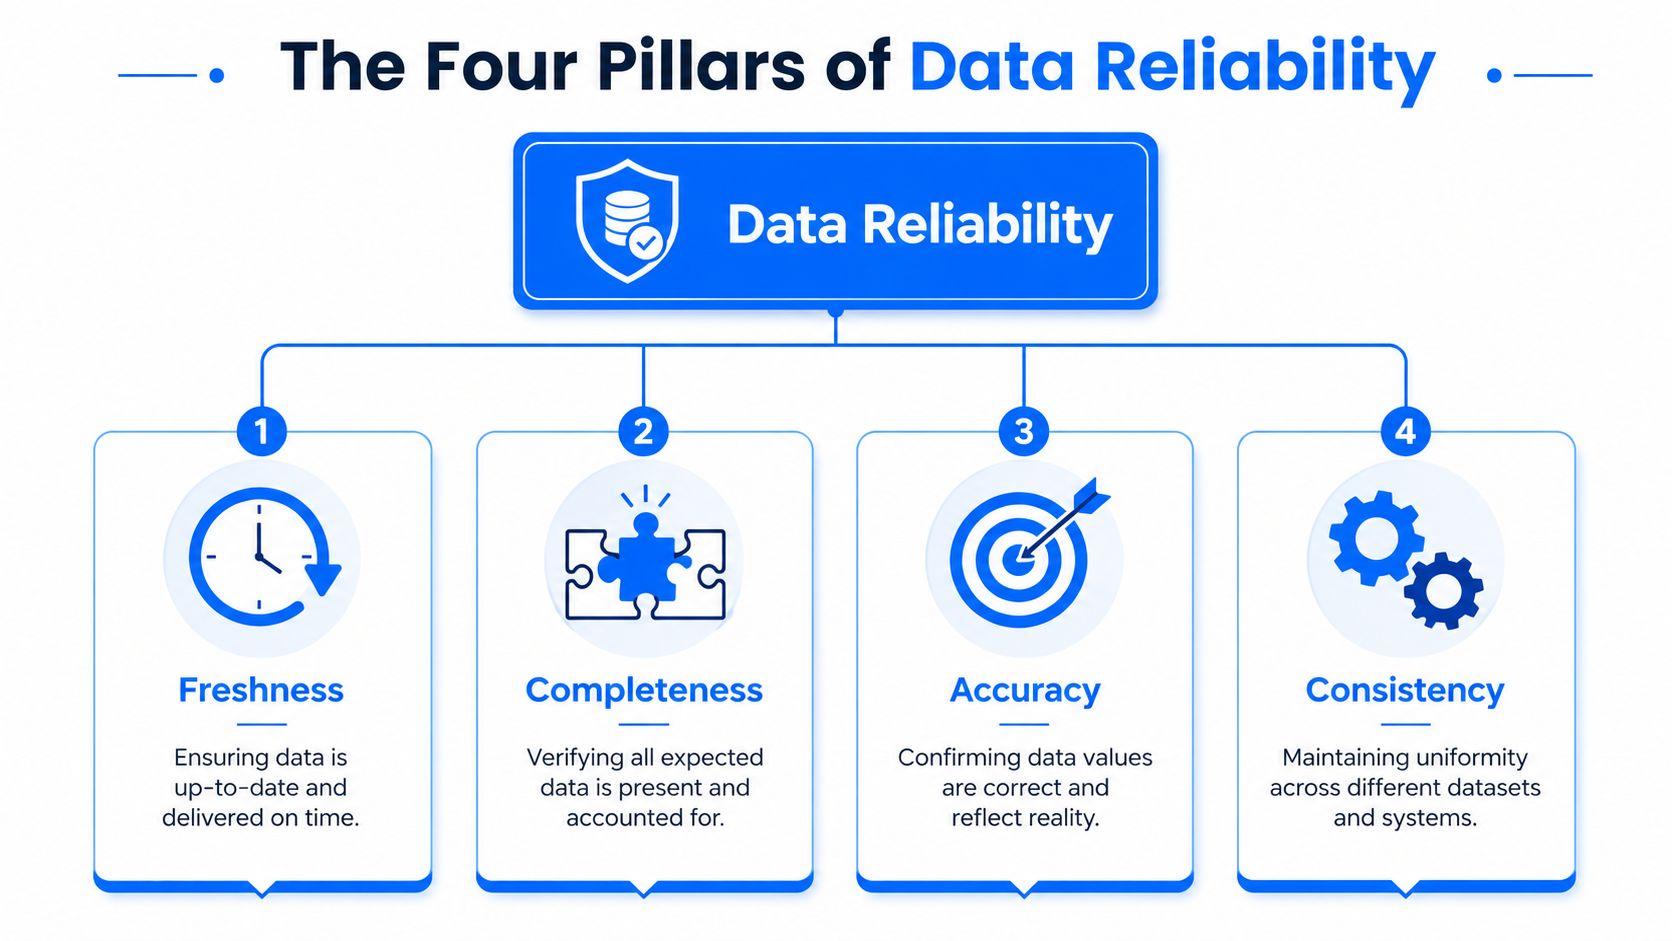
If you want a framework your team can effectively use, split reliability into four pillars. Not ten. Not a giant checklist no one maintains. Four is enough to assign ownership, define checks, and review incidents without turning the process into governance theater.
Freshness and timeliness
Freshness asks whether the data is current. Timeliness asks whether it arrived when the business needed it. In a warehouse, those are related but not identical.
A daily finance mart can be fresh relative to its own last load and still be late for the executive meeting. A streaming fraud table can arrive continuously but still lag enough to break downstream decisions. This pillar belongs to the pipeline layer and the consumption layer at the same time.
Completeness
Completeness is about presence. Are all expected rows there? Are critical columns populated? Did all partitions arrive? Did one region disappear because of an upstream filter change?
Many teams under-monitor. They count total rows and stop there. This practice misses the more common enterprise failure mode, where a subset is absent while the total still looks plausible.
Reliability gets stronger when you check expected shape, not just successful job completion.
Accuracy and correctness
Accuracy is harder because it touches business meaning. A value can exist, conform to type, and still be wrong. Currency signs get stripped. Status codes drift from allowed business states. Foreign keys point to records that no longer exist.
For data architects, this pillar usually combines technical validation with business rules. Some checks are universal, like referential integrity. Others are table-specific and must be owned by the team that understands the process behind the data.
Consistency
Consistency is what keeps integrated systems usable. Formats, data types, key logic, naming conventions, and schema expectations have to hold over time. This pillar catches the issues that insidiously poison downstream joins, dashboards, and feature pipelines.
A practical way to use the four pillars is to assign each critical asset a primary failure pattern:
Executive dashboards usually fail first on freshness and accuracy.
ML feature tables usually fail first on consistency and schema stability.
Financial close datasets usually fail first on completeness and correctness.
Shared dimensions usually fail first on consistency because many downstream systems depend on them.
That classification makes reviews faster. It also keeps teams from applying the same checks everywhere, which is one of the main reasons monitoring becomes noisy and expensive.
Key Reliability Metrics and In-Database Computation
The phrase how to measure reliability becomes useful only when it leads to something computable. In warehouse environments, the best metrics are the ones you can calculate directly in SQL on production-adjacent tables, metadata tables, and system logs. If you have to export data first, you've already added latency and risk.
What classical reliability metrics still teach us
Classical measurement science still matters. In questionnaire design, Cronbach's alpha is the standard for scale reliability, and 0.8 or more is considered acceptable. For continuous variables, the Intraclass Correlation Coefficient (ICC) is the most common parameter for estimating reliability by comparing repeated measurements, as summarized by the University of Southampton library guide on reliability, validity, and reproducibility.
Those methods are valuable when you're evaluating repeated human or instrument measurements. They're less useful for live warehouse operations because your problem usually isn't “Do two raters agree?” It's “Did the data land, conform, and remain stable inside a changing production system?”
A useful mental model is this: traditional reliability statistics validate measurement consistency on samples. Warehouse reliability metrics validate operational consistency on continuously changing assets. If you need a practical example of turning abstract measurement into operational scorecards, Halo AI's metrics playbook is worth reading because it shows how teams make metrics usable instead of merely reportable.
Metrics you can compute inside the warehouse
Below is a compact operating table. The point isn't to copy these queries verbatim. The point is to build measures that run where the data lives.
Pillar | Metric Example | What It Measures | Example SQL Concept |
|---|---|---|---|
Freshness | Time since last successful load | Delay between expected and actual availability |
|
Completeness | Row count drift | Missing or unexpectedly inflated volume | compare current partition row count to historical pattern |
Accuracy | Invalid value rate | Business rule violations in critical columns |
|
Consistency | Schema change frequency | Structural drift that breaks downstream usage | compare current information schema to prior snapshot |
A few practical patterns work well.
These are simple by design. They map to four questions every engineer understands:
Is it late
Is anything missing
Are values valid
Did the structure change
For teams building a durable metric catalog, this guide to data quality metrics is useful because it helps separate vanity checks from measures that support operations.
Don't start with dozens of checks. Start with the smallest set that can explain a failed dashboard, a broken join, or an unstable model input.
The trade-off is obvious. In-database computation keeps context and reduces movement, but you need disciplined query design so observability jobs don't compete with production workloads. That's why senior teams usually begin with critical tables, partition-aware checks, and metadata-driven scans instead of full-table brute force validation.
Setting Actionable SLOs and Baselines
Raw metrics don't change behavior. Teams change behavior when a metric crosses a threshold that everyone understands. That's what SLOs do. They turn observation into an operational contract.
A weak reliability program says, “We monitor freshness.” A strong one says, “The customer orders fact must be available before downstream reconciliation starts, and an alert fires if the expected arrival window is missed.” The exact threshold depends on business use, not engineering preference.

Thresholds have to match business damage
Different assets deserve different objectives. A board report, a near-real-time fraud table, and a model training archive shouldn't share the same alert policy.
Use these decision rules when setting SLOs:
Decision-critical assets need tighter freshness and correctness thresholds because people act on them immediately.
Shared upstream tables need stronger consistency controls because one structural break can fan out across many consumers.
Regulated datasets need explicit validation rules and traceable exceptions because auditability matters as much as timeliness.
ML feature inputs need stability-oriented baselines so drift and schema changes are caught before model quality degrades.
That last category is where static thresholds often fail. A row count rule can catch catastrophic loss, but it won't tell you whether a learned behavioral pattern has shifted enough to make a feature unreliable.
Why static rules break at scale
Static rules look attractive because they're easy to explain. They're also expensive to maintain in large estates. If every table gets hand-coded thresholds, teams spend their time tuning alerts instead of improving reliability.
That's why baseline learning matters. In-database metric computation and baseline learning occur within the customer's configured tables. For example, digna reads Teradata's DBC system tables directly via SQL queries to convert operational metrics into time-series data for AI-driven anomaly detection, as described in digna's Teradata workload analysis overview.
That approach changes the operating model. Instead of asking an engineer to define every normal state in advance, the system can learn recurring patterns directly from warehouse-resident signals. For high-volume environments, that's the difference between maintainable observability and alert fatigue.
A threshold should reflect the cost of being wrong, not the convenience of writing the rule.
There's still a trade-off. Learned baselines reduce manual maintenance, but they need review when business behavior undergoes a significant change. Quarterly close, product launches, source migrations, and regional expansions can all produce real pattern shifts. Teams that do this well pair automated baselines with explicit business calendars and owner review.
Instrumenting Your Data Stack for Full Visibility
Most observability content assumes you'll move data out, aggregate it elsewhere, and judge reliability from the outside. That's workable at small scale. It becomes a liability in large warehouse estates, especially when privacy, latency, and operational load all matter.
The in-database reliability paradox
The paradox is simple. You want to measure reliability continuously, but the act of exporting data to measure it can add cost, delay, and governance friction. Worse, it separates the measurement system from the environment where breakage happens.
The gap is sharper for AI-based detection. The unresolved challenge is what some engineers call the in-database reliability paradox. Most guidance focuses on external samples, but not on validating whether an algorithm's learned baseline remains consistent when computation happens natively inside the warehouse. That challenge is described directly in this discussion of the in-database reliability paradox for enterprise data engineers.

That's the part many teams miss. It's not enough to monitor data. You also need confidence that your monitoring logic remains stable when source volume spikes, schema shifts, or historical patterns change.
What to instrument in practice
For a warehouse-first reliability program, instrument three layers at once.
First, monitor arrival behavior. You need to know whether expected datasets landed, whether they landed on time, and whether delays are isolated or systemic.
Second, monitor structural stability. Schema drift breaks pipelines and models more often than teams admit, especially when upstream application teams ship changes without analytics review.
Third, monitor record-level validity for business-critical entities. Aggregates can hide deep errors. Referential breaks, duplicated keys, and invalid status transitions usually show up only when you check rows, not summaries.
A practical dashboard for platform teams should include:
Freshness views that highlight late tables, delayed partitions, and stale downstream marts
Schema views that show added columns, removed columns, and data type changes
Validation views that surface rule violations by table, owner, and business domain
Historical views that help engineers compare this incident to prior patterns
If you're formalizing this capability, a good conceptual reference is what data observability means in practice. It helps anchor observability as an engineering operating model, not just another dashboard.
External sampling can prove a point. In-database instrumentation can run the platform.
The trade-off here is organizational. Full visibility requires agreement across platform engineering, analytics engineering, governance, and ML teams. Without shared ownership, each team instruments its own corner and nobody sees the full failure chain.
Building a Reliability-Driven Workflow
A reliability alert is only valuable if it triggers the right response. Otherwise you've built a notification system, not a reliability program.
The workflow has to be boring in the best sense. Repeatable. Assigned. Easy to audit after a bad incident. When teams skip this and rely on heroic debugging, they solve the immediate outage and preserve the exact conditions that caused the next one.
What happens after the alert
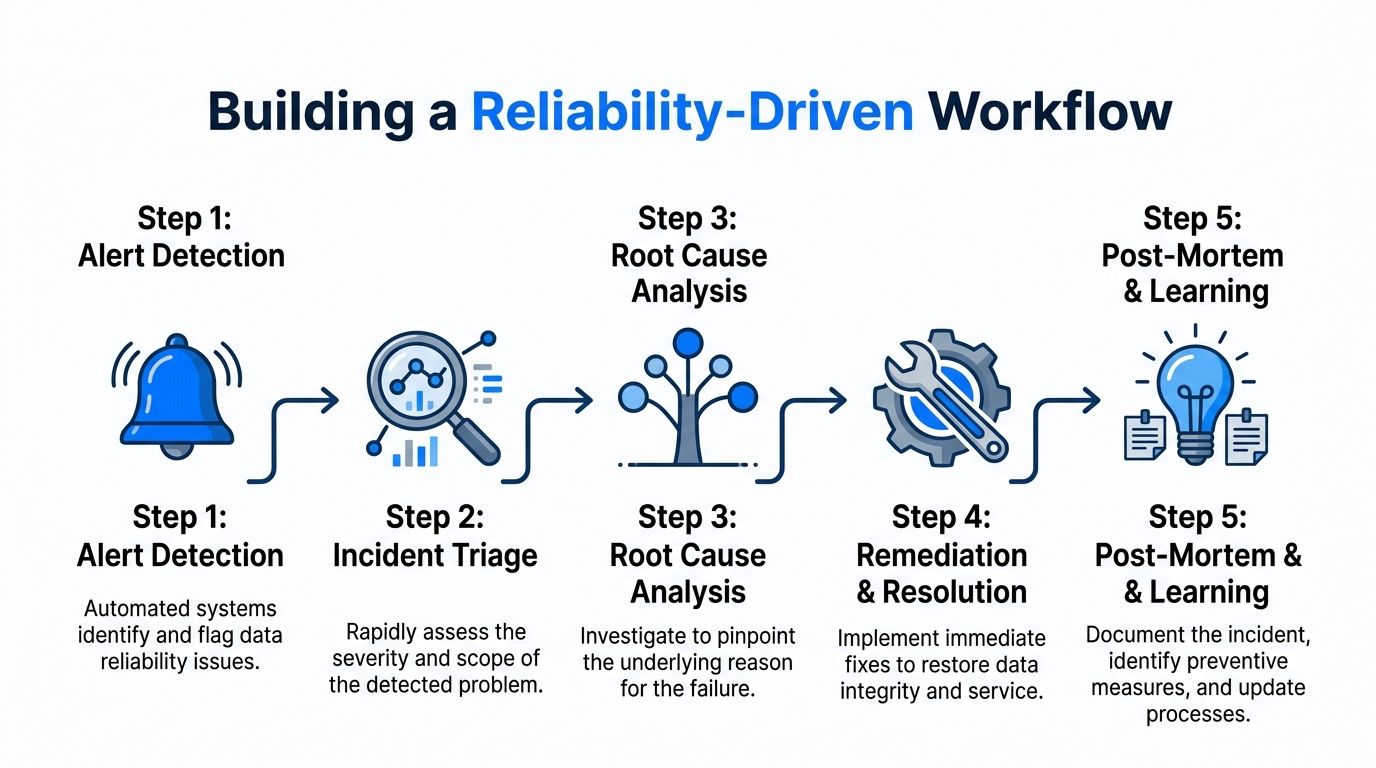
A strong workflow usually follows five motions, but not all incidents need the same depth.
Detect the issue
The signal can come from freshness, schema, validation, or downstream business checks. What matters is that detection happens before stakeholders discover the problem manually.Triage fast
Decide whether the issue is isolated, shared, or executive-facing. A broken feature table used by one training job is different from a late finance mart consumed across the business.Trace the root cause
Check pipeline logs, warehouse metadata, source delivery patterns, and schema history. Ask whether the problem came from late arrival, structural change, logic regression, or bad source data.Remediate safely
Backfill if the issue is missing data. Patch transformation logic if the issue is semantic. Roll forward schema compatibility when possible. Avoid silent one-off fixes that leave no trace.Capture the learning
Add a new guardrail, adjust ownership, or refine a baseline. If the same incident can happen again without a new control, the process isn't complete.
Use incidents to harden the platform
Historical observability matters here because trends often reveal what a single incident hides. Repeated lateness in one source domain may point to upstream contract weakness. Frequent schema breaks in shared dimensions may point to release coordination problems. Validation spikes in one business process may show that the issue isn't in SQL at all, but in operational data entry or system integration.
One particularly useful operational pattern is monitoring arrival behavior against expected schedules and learned patterns. The platform's timeliness monitoring tracks data arrival against learned behavioral patterns, calculating expected delivery times and detecting delays, directly preventing stale reports and broken dashboards caused by late or missing data loads, as described in this product update on timeliness monitoring and time-series analysis.
For teams designing broader automated response flows, the principles in AI agent architecture and design are useful because they force clear thinking about orchestration, handoffs, and controlled escalation. That same discipline applies to data reliability operations.
The best post-mortem output isn't a document. It's a new control that prevents the same class of failure.
A mature workflow doesn't try to eliminate every incident. It reduces surprise, shortens diagnosis, and makes each failure teach the platform something new.
If you want to measure reliability without moving data out of your environment, digna is built for that operating model. It helps teams detect anomalies, validate records, monitor timeliness, and track schema changes directly inside customer-controlled data environments, so reliability measurement stays close to the systems that break.
Frequently asked questions
How do you measure data reliability?
With metrics you can compute where the data already lives. Time since last successful load covers freshness, row count drift covers completeness, invalid value rate covers accuracy, and schema change frequency covers consistency. Exporting data first adds latency and governance friction before you have measured anything.
What are the four pillars of data reliability?
Freshness and timeliness, completeness, accuracy and correctness, and consistency. Four is enough to assign ownership and review incidents without turning the process into governance theater. Give each critical asset a primary failure pattern: executive dashboards usually fail on freshness, ML feature tables on consistency and schema stability.
What is data downtime and how is it calculated?
Number of incidents multiplied by the sum of average time to detection and average time to resolution. It states reliability in business terms rather than orchestration terms. Top-tier enterprises target under 1% annually, while average organizations often see 5% to 10% of data assets unusable.
Why do static thresholds break at scale?
They are easy to explain and expensive to maintain. Hand-coding thresholds for every table means teams spend their time tuning alerts instead of improving reliability. A row count rule catches catastrophic loss but will not tell you that a learned behavioral pattern has shifted enough to make a feature unreliable.
What should a reliability program instrument first?
Three layers at once: arrival behavior, structural stability, and record-level validity for business-critical entities. Aggregates hide deep errors, because referential breaks, duplicated keys and invalid status transitions show up only when you check rows. Start with the smallest set that can explain a broken dashboard.



