Dbt Source Freshness: Prevent Stale Data in 2026
|
7
min read

You usually notice stale data when someone else notices it first.
A finance lead pings you because yesterday's numbers are still on today's dashboard. The orchestrator shows green. dbt models built successfully. Nothing looks broken until you trace the issue back upstream and realize the source table stopped receiving new records. That's the uncomfortable part of timeliness problems. They often fail unnoticed.
Many teams learn this lesson the same way. They invest in transformation tests, documentation, and lineage, but they don't add a direct check for whether raw data is still arriving on time. If you're already working through what stale data means in practice, dbt source freshness is one of the cleanest ways to close that gap. It gives you a simple operational answer to a high-value question: has this source updated when it was supposed to?
That matters because stale data rarely stays isolated. A delayed ingestion can flow into executive dashboards, revenue models, ML features, and audit-facing reports before anyone realizes the source is old. If you're tightening your process around identifying data reliability flaws, freshness checks belong near the top of the list. They don't replace quality tests, but they catch a class of failure that standard schema and logic tests won't.
Table of Contents
The Problem with Stale Data
The most frustrating data incidents aren't always loud. A job can complete, logs can look normal, and downstream models can still materialize on top of outdated inputs.
That's why stale data causes trust problems so quickly. The business user doesn't care whether Airflow, Dagster, or dbt technically “ran.” They care that the metric on the dashboard matches reality. If a payments source stopped loading overnight, a healthy transformation run just republishes old truth.
Silent failures are the expensive ones
A typical failure chain looks like this:
An upstream extractor stalls. The source table keeps yesterday's latest timestamp.
dbt still runs downstream models. Transformations succeed because the table exists and the schema still matches.
Dashboards update on schedule. Stakeholders assume the data is current because the BI layer refreshed.
Trust drops fast. Once someone spots the gap, every number near that dashboard becomes suspect.
This is exactly the problem dbt source freshness is built to catch. It checks whether a source has been updated recently enough to match the cadence you expect.
Freshness issues rarely start as “bad SQL.” They usually start as “data stopped arriving and nobody was watching the clock.”
Why this issue slips through mature teams
Teams often have strong test coverage for nulls, uniqueness, relationships, and accepted values. Those checks matter, but they answer different questions. A source can pass every quality test and still be stale.
That distinction matters most for operational data. Revenue, payments, marketing spend, inventory, and clinical or compliance-sensitive reporting all depend on timeliness, not just correctness. If the latest row is old, perfectly modeled downstream tables still tell the wrong story.
The practical fix is straightforward. Put a freshness contract on the raw sources that matter, wire the result into orchestration, and stop the pipeline when the source has missed its expected arrival window. That turns stale data from a reactive support ticket into an actionable engineering signal.
Understanding dbt Source Freshness
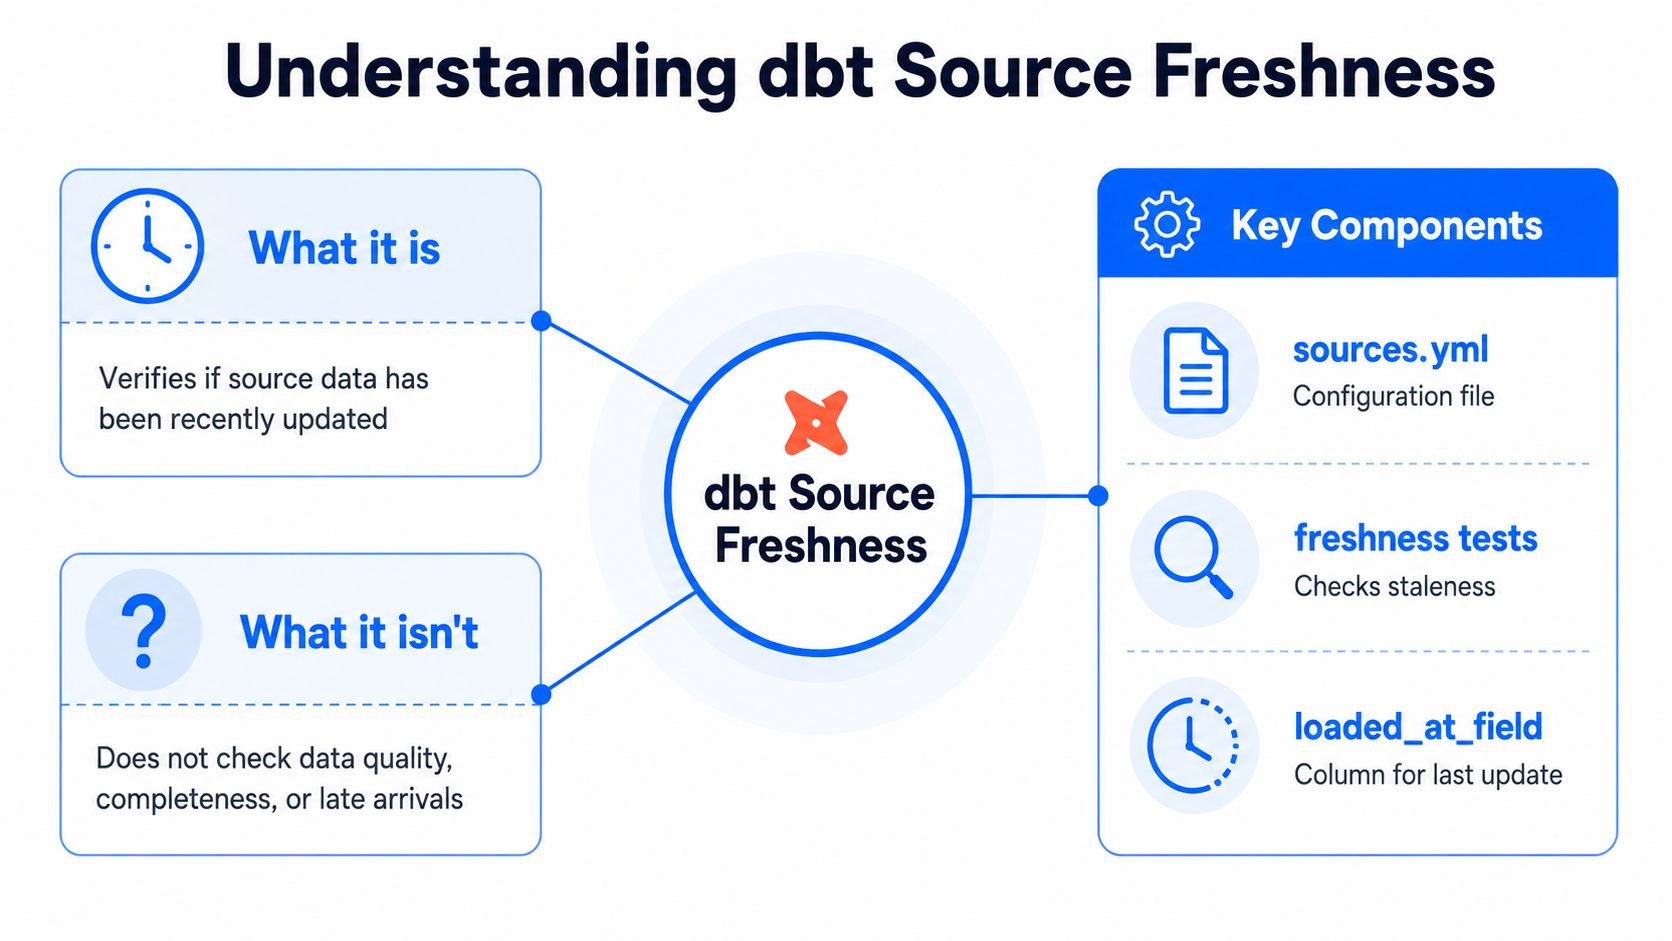
dbt source freshness is a built-in way to monitor whether source tables are arriving on time. It's been a core dbt feature since 2019, and it works by comparing the most recent timestamp in a loaded_at_field against configurable warn_after and error_after thresholds. If the data is older than the allowed period, the dbt source freshness command exits with a non-zero code, which can fail CI jobs and block downstream work, as documented in dbt source testing.
If you need a business-facing explanation of the concept, this guide to data freshness and why it matters for business decisions is a useful companion to the implementation details.
What it is
dbt source freshness functions as an SLA check for raw data arrival.
You define a source in sources.yml, point dbt at the timestamp column that represents when records landed, and tell it how old that source is allowed to get before you want a warning or an error. dbt then queries the maximum value of that field and compares it to the current time.
That makes it very effective for sources with a known cadence. If a sales table should update daily, a freshness error tells you the latest data is older than that accepted window.
What it isn't
dbt source freshness isn't a full quality framework by itself.
It doesn't tell you whether values are correct, whether a primary key is duplicated, whether a foreign key still resolves, or whether business logic changed upstream. It also doesn't natively understand nuanced arrival behavior beyond the threshold you define.
That's why I think of it as a smoke detector, not a fire investigation. It tells you that the stream may have stopped flowing. It doesn't explain every reason why.
Practical rule: Use freshness checks for timeliness, then use dbt tests and other monitoring for correctness, completeness, and drift.
The three pieces that matter most
When someone is setting this up for the first time, I tell them to focus on three configuration decisions:
Pick the right
loaded_at_field
This field should reflect data arrival or load recency, not an arbitrary business event timestamp.Set realistic thresholds
warn_aftershould tell you the source is trending late.error_aftershould tell your pipeline to stop trusting it.Choose the right scope
Not every source deserves the same level of monitoring. Start with the tables that feed high-visibility dashboards, finance reporting, or ML features.
Get those three right and dbt source freshness becomes operationally useful very quickly.
Configuring Freshness Checks in Your Project
The setup lives in your source YAML. That's good news because it keeps timeliness rules close to the source definitions your team already maintains.
The dbt source freshness command relies on a freshness block in source YAML, where you define warn_after and error_after with a period and count such as {count: 1, period: day}. When it runs, dbt compares the max value of the loaded_at_field to the current time and saves results to target/sources.json, which makes the output easy to feed into other tooling and visualizations, as shown in dbt freshness configuration documentation.
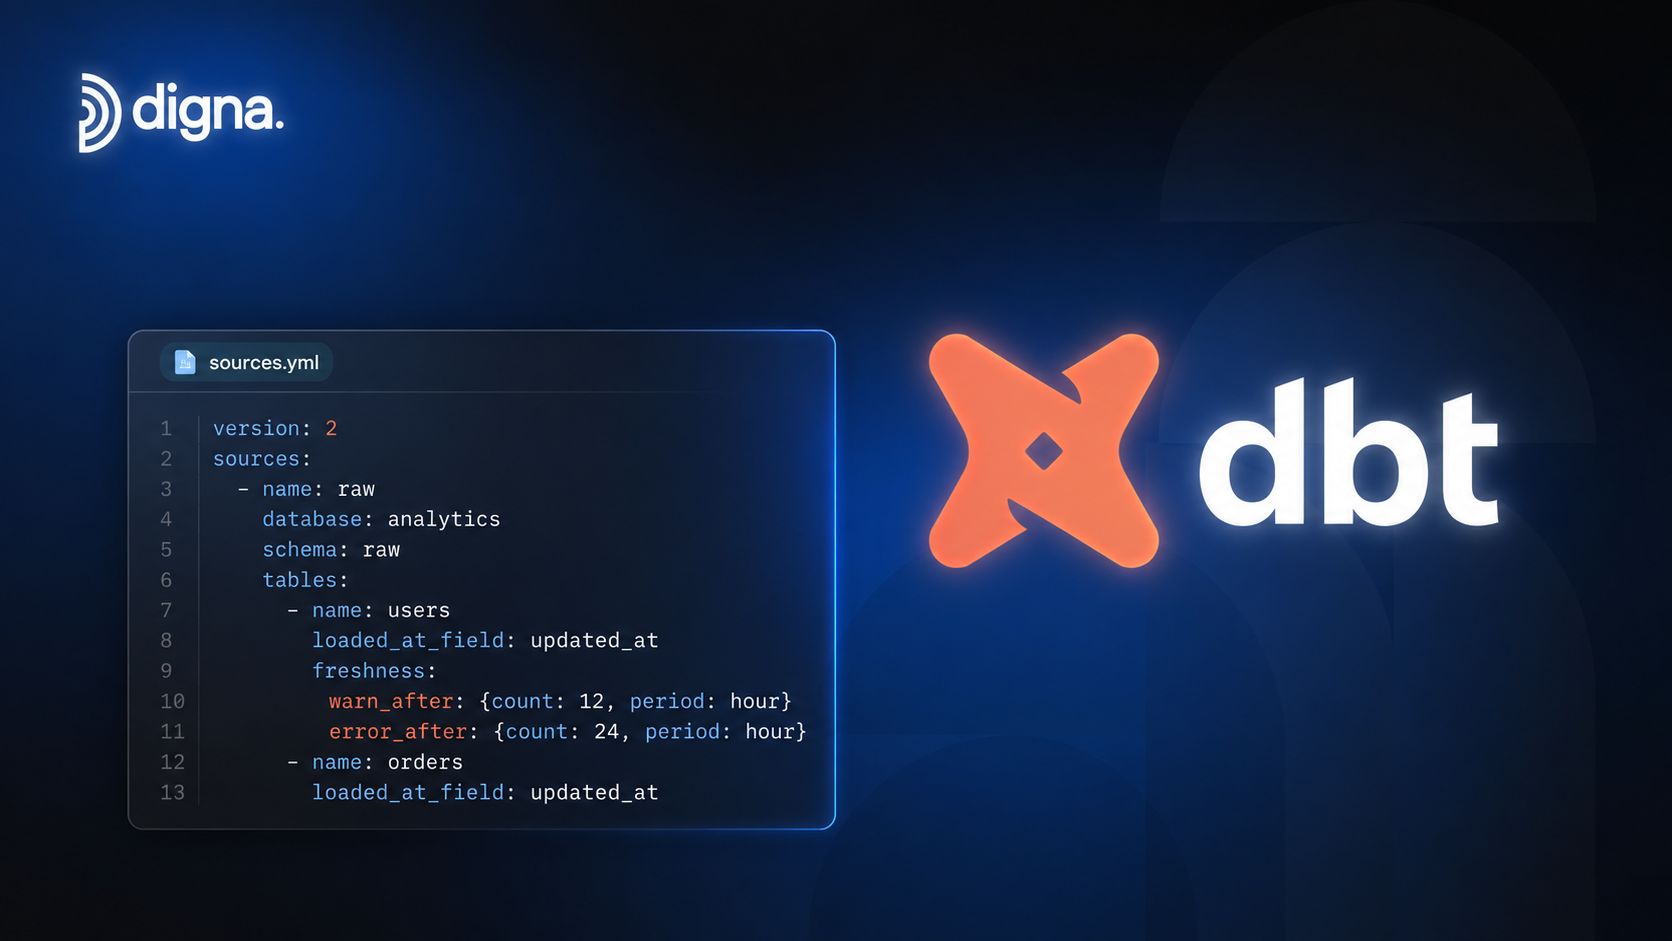
A practical YAML example
Here's a clean pattern you can adapt:
This example does three useful things:
It uses one load timestamp convention.
_etl_loaded_atis explicit and easy to standardize across ingestion tools.It sets different thresholds per table. Charges and payouts don't have the same arrival pattern, so they shouldn't share the same freshness rule.
It keeps rules readable. Anyone reviewing the project can understand the operational expectation without reading external documentation.
How to choose thresholds
The mistake I see most often is copying the same values everywhere. Freshness thresholds should reflect actual ingestion behavior and business tolerance.
Source pattern | Good warning threshold | Good error threshold | Why |
|---|---|---|---|
Near-real-time event stream | 30 minutes | 60 minutes | Gives you room for short ingestion jitter without ignoring a real outage |
Hourly batch feed | 30 minutes after expected lag | 1 hour after expected lag | Catches delay before dashboards are materially behind |
Daily business system export | 1 day | 2 days | Useful when the source updates once per business cycle |
Low-priority reference data | Qualitative, based on use | Qualitative, based on use | Some dimensions don't need aggressive alerting |
Use this table as a decision aid, not a template to apply blindly.
What works in real projects
A few habits make setup smoother:
Prefer ingestion timestamps over business timestamps.
created_atmight describe when a customer acted. It doesn't always describe when the row landed in your warehouse.Keep freshness close to ownership. If one team owns a source, make sure they agree with the thresholds in code review.
Document exceptions. Some sources arrive late by design on weekends, month-end, or after external vendor processing.
If you start with your most important raw sources and get those definitions right, the first rollout of dbt source freshness usually takes less effort than the debugging it prevents later.
Running Checks and Interpreting Results
Once the YAML is in place, you can run the check with the command your team will use constantly:
dbt source freshness
You don't need to run it across everything every time. dbt also supports node-specific execution such as dbt source freshness --select source:stripe.charges, which is useful when you're debugging a volatile table or validating a change without the overhead of a full project-wide check.
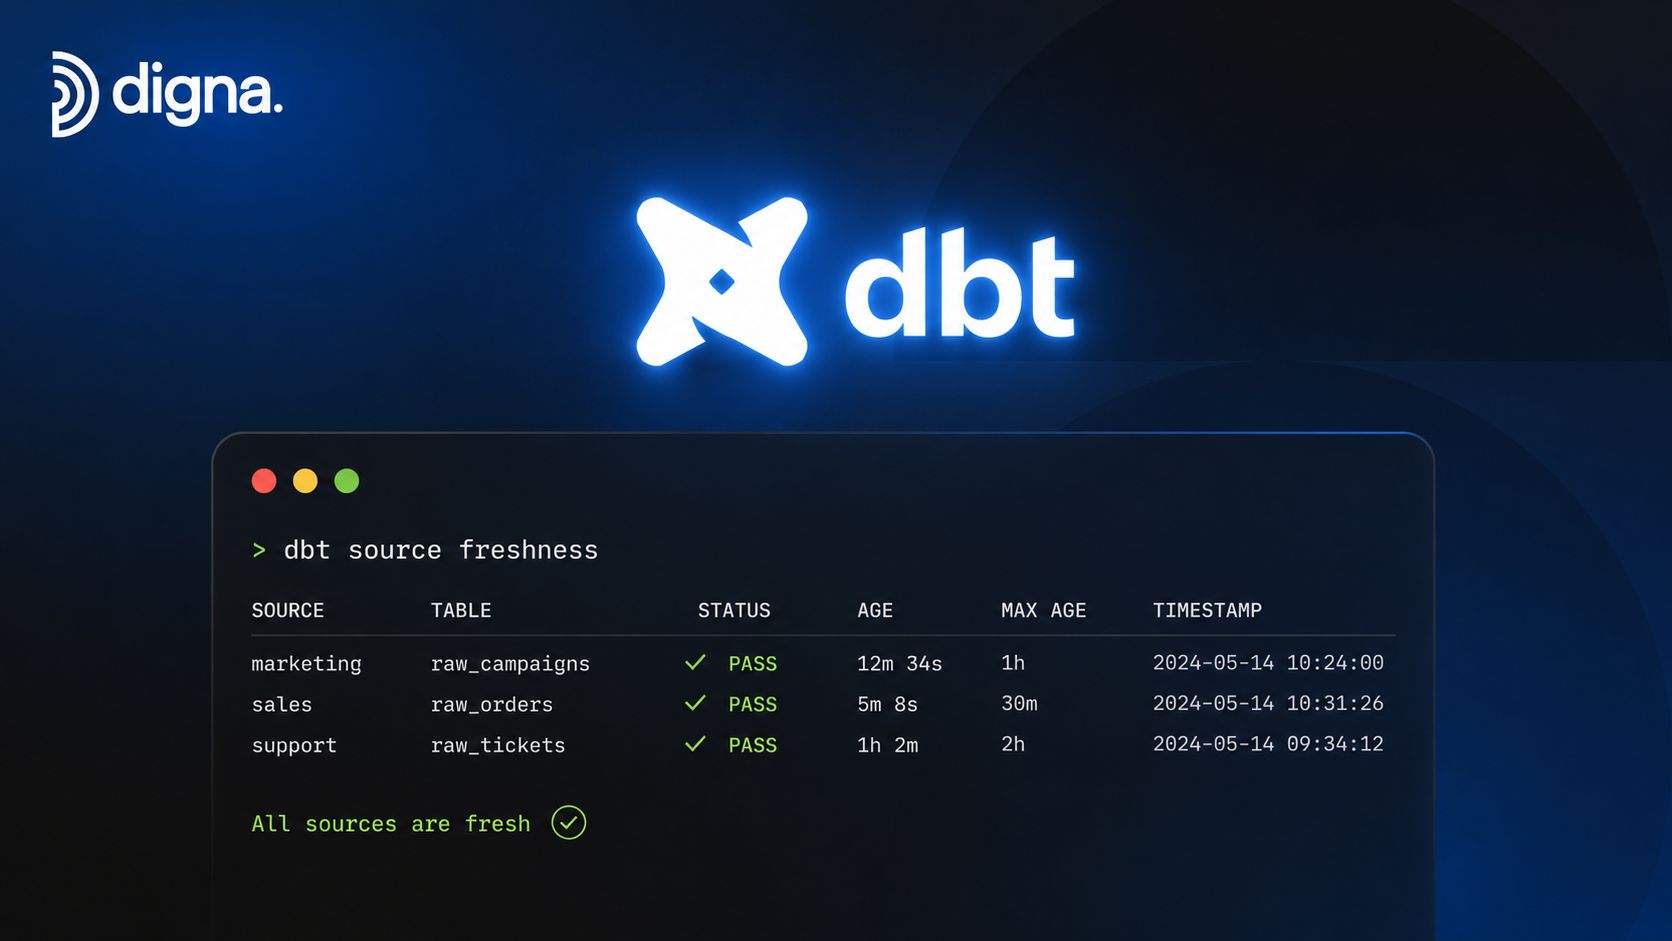
What the statuses mean
The output is simple, and that's one reason it fits well into CI and orchestration:
PASS means the latest timestamp is inside your acceptable threshold.
WARN means the source is older than
warn_after, but not yet pasterror_after.ERROR means the source crossed the failure threshold and should be treated as stale.
That WARN state is useful operationally. It gives you an early signal that a source is trending late, while still letting you decide whether to halt dependent work.
Why the exit code matters
The command's exit code is what turns freshness from a dashboard into a control point.
If a source fails freshness, dbt exits non-zero. That lets GitHub Actions, GitLab CI, Airflow, Dagster, or dbt Cloud jobs stop downstream execution automatically. In practice, that means you can prevent stale source data from propagating into marts, dashboards, and exports.
A freshness check that only writes a log is observability. A freshness check that blocks bad downstream runs is an operating control.
Scheduling strategy
A practical rule from Secoda's dbt source freshness guidance is to run checks at least twice as frequently as the expected data cadence. Their example is every 30 minutes for hourly loads. That gives you enough coverage to catch a missed update before the stale data becomes visible downstream.
A good lightweight workflow looks like this:
Run freshness before transformation jobs for critical sources.
Fail fast on error so stale inputs don't feed trusted models.
Route WARN results to alerts so engineers can investigate early.
Use selective runs in development when testing one source or one ingestion path.
This is one of those controls that's small in code and large in impact.
Common Pitfalls and Advanced Techniques
Most dbt source freshness setups fail for boring reasons, not exotic ones. The command works. The configuration is valid. But the operational result is noisy, slow, or misleading.
The biggest trap is assuming any timestamp column will do. It won't.
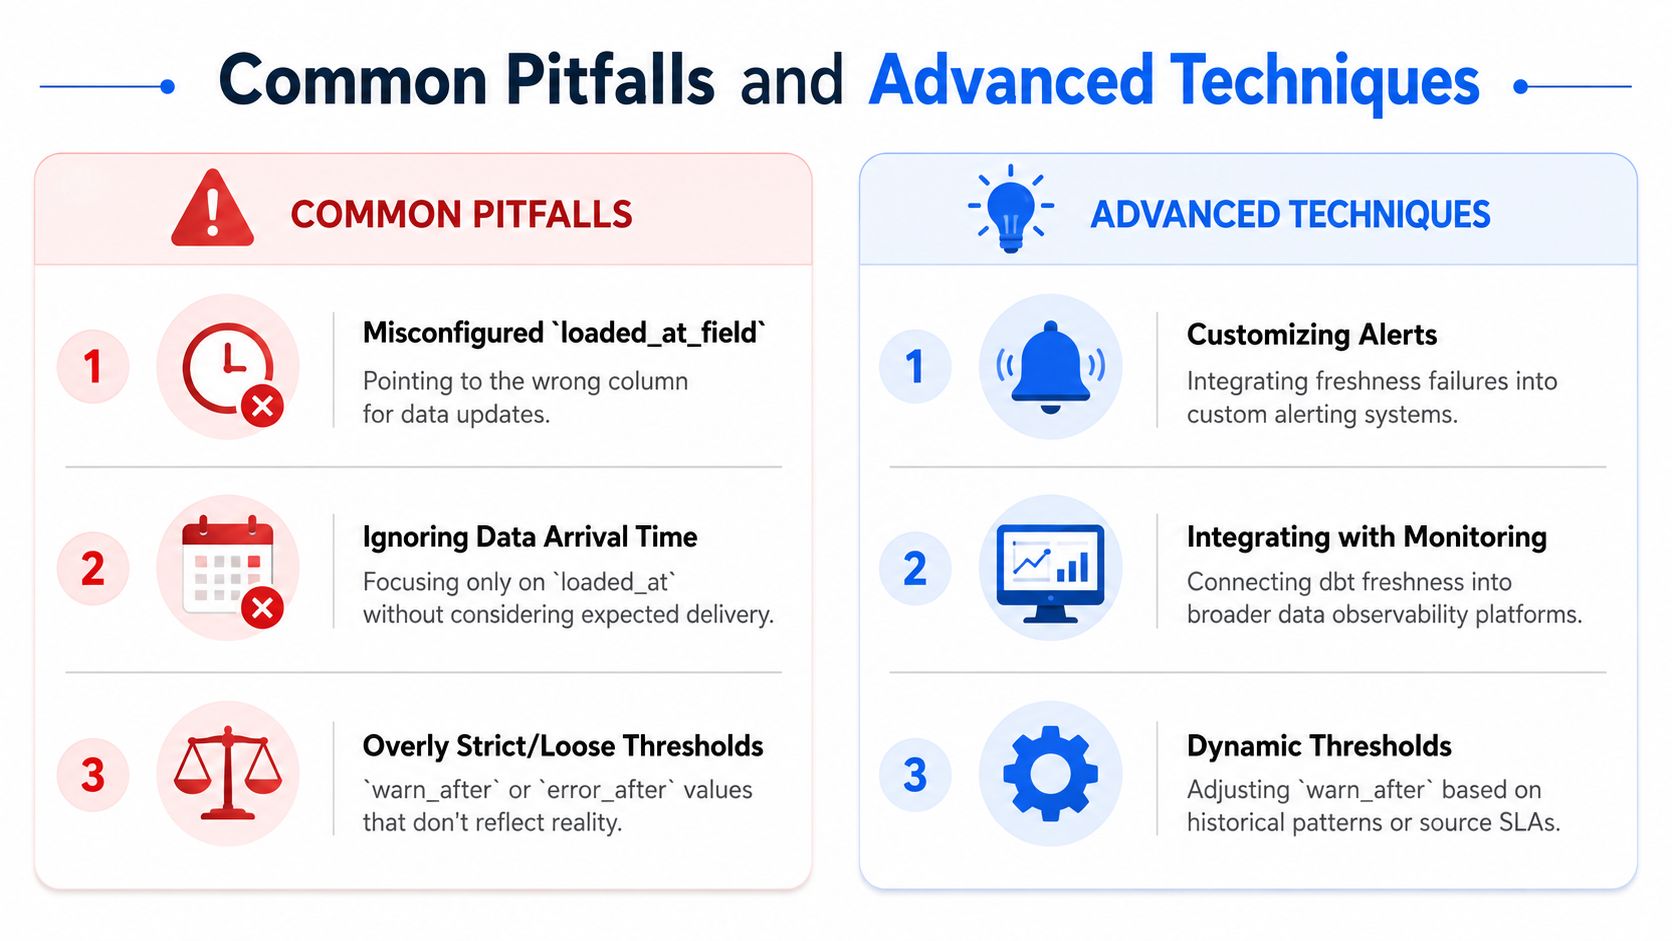
The failure modes that show up first
A useful summary from advanced dbt freshness implementation notes highlights three common issues. Non-indexed timestamp columns can increase query latency by 40 to 60 percent, timezone mismatches can cause false alerts, and omitting a filter on large tables can lead to a 25 percent higher incidence of undetected stale data.
Those aren't academic edge cases. They show up quickly in production.
Wrong timestamp semantics
Ifloaded_at_fieldpoints to an event timestamp instead of a warehouse arrival timestamp, dbt may report a table as fresh even when ingestion is delayed.Timezone confusion
If your records are stored in UTC but your comparison logic effectively runs against local system time, you can create false stale alerts that train the team to ignore freshness failures.Heavy scans on historical tables
On large raw tables, a freshness query without a useful filter can waste compute and still miss the operational story you care about right now.
What to change when the basics are stable
Once the core checks are reliable, you can use dbt more selectively.
One useful pattern is to build only off sources that are newly updated. The source_status:fresher+ selector helps trigger downstream models from sources that changed, which is a good fit when your project contains a mix of high-frequency and low-frequency upstream systems.
Don't treat every freshness check as a binary alarm. Some should be gating rules. Others should be routing rules for selective builds.
A practical hardening checklist
When a team asks me to review their setup, I usually check these items first:
Index or optimize the timestamp path where your warehouse supports it, especially on large source tables.
Standardize on UTC for stored load timestamps, then keep comparison behavior explicit.
Add a
filterfor very large history tables so dbt evaluates the recent operational window rather than scanning irrelevant history.Tune thresholds after observing actual arrival behavior instead of locking them on day one.
Separate critical from noncritical sources so one flaky, low-value feed doesn't block trusted delivery everywhere.
dbt source freshness is easy to enable. Making it dependable takes a little more engineering judgment.
Beyond Freshness Building a Full Observability Workflow
Static freshness thresholds solve an important problem, but they don't solve the whole timeliness problem.
A source can arrive “on time” according to error_after and still be late enough to disrupt analysts, executive reporting, or downstream feature generation. That gap becomes clearer in real production systems where delays aren't evenly distributed. The average interval might look fine while rare, severe slowdowns keep surfacing at exactly the wrong time.
Research summarized in Paradime's source freshness best practices points to this underserved issue directly: 70% of stale data incidents stem from delays exceeding 3x the average interval, which is why average-based or even percentile-based threshold setting can miss important tail-delay events.

Where dbt stops
dbt source freshness asks a direct question: is the latest timestamp older than the threshold?
That's useful, but limited. It won't by itself tell you whether a feed that usually lands at a predictable time is trending late today, whether delays are worsening over time, or whether a source is still technically “fresh” but already violating the expectation your business users operate against.
Here, broader observability starts to matter. You're no longer just testing staleness. You're monitoring timeliness behavior.
What mature teams add next
Teams usually expand in three directions:
Timeliness monitoring
They track when data is expected to arrive, not just whether it is currently stale.Pattern learning
They compare today's arrival against historical norms instead of relying only on fixed thresholds.Integrated response
They connect freshness, schema, anomaly, and validation signals so incident response starts with context.
One example is data observability workflows built around in-database monitoring. The verified capability that matters here is that digna's timeliness component monitors data arrival against learned patterns and user schedules, and it executes analyses inside the customer's database rather than through external polling, as described on digna's timeliness overview. That makes it a different layer from dbt's static threshold check, not a replacement for it.
A practical maturity model
The progression usually looks like this:
Stage | What you monitor | Main limitation |
|---|---|---|
Basic | Static source thresholds in dbt | Misses nuanced arrival drift |
Controlled | dbt freshness tied to CI and orchestration | Still mostly reactive |
Mature | Timeliness patterns, delays, and expected delivery behavior | Requires broader observability design |
The useful mental model is simple. dbt source freshness tells you when a source is stale. Timeliness monitoring helps you catch when it is becoming late.
That difference matters most in environments where a single missed or delayed load has outsized impact, especially when tail delays are rare enough to evade simplistic thresholds but common enough to keep breaking trust.
If your team already uses dbt source freshness and wants broader visibility into late arrivals, record-level validation, and in-database observability workflows, digna is one option to evaluate alongside your existing stack.
Frequently asked questions
What is dbt source freshness?
It is a dbt check that compares the most recent timestamp in a source table against thresholds you define, returning a warning or an error when the data is older than expected. It tests the age of the source, not whether your models built correctly.
Why do models build successfully while the data is stale?
Because dbt transforms whatever is in the source, including yesterday's rows. The orchestrator shows green and the models succeed, so nothing signals failure until a business user notices that today's dashboard is showing yesterday's numbers.
How do you choose freshness thresholds?
Derive them from the promise the data makes to its consumers, not from how often the job runs. Set the warning threshold where someone would want to investigate and the error threshold where the data is no longer safe to use for its intended decision.
Why does the exit code of a freshness check matter?
Because it determines whether the pipeline stops. A freshness check that only writes to a log lets stale data flow onward. Wiring the error status into the orchestration is what turns the check from a report into an actual control.
What does dbt source freshness not cover?
It only answers whether data arrived recently. It says nothing about whether the rows are correct, complete, or consistent with an upstream system. Freshness needs pairing with validation and distribution monitoring to give a full picture of trustworthiness.



